. 2016 Oct 6;167(2):382-396.e17.
doi: 10.1016/j.cell.2016.09.012. Epub 2016 Sep 29.

IRGB10 Liberates Bacterial Ligands for Sensing by the AIM2 and Caspase-11-NLRP3 Inflammasomes

Affiliations

IRGB10 Liberates Bacterial Ligands for Sensing by the AIM2 and Caspase-11-NLRP3 Inflammasomes

Si Ming Man et al. Cell. .

Abstract

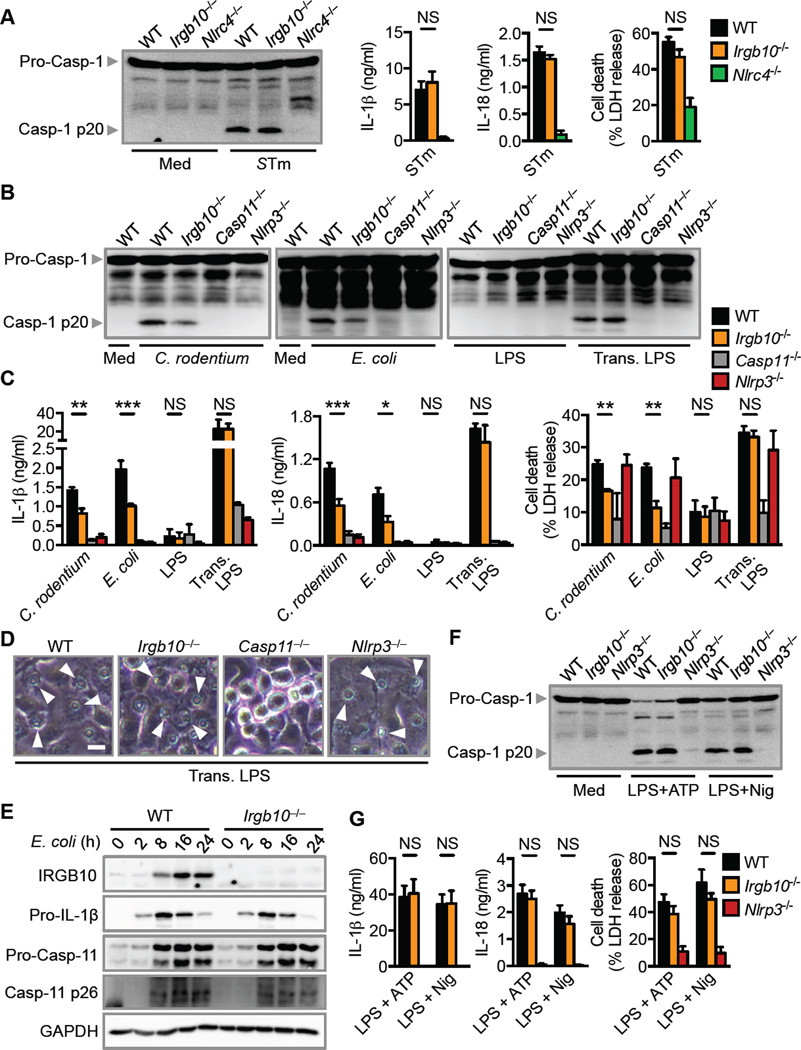
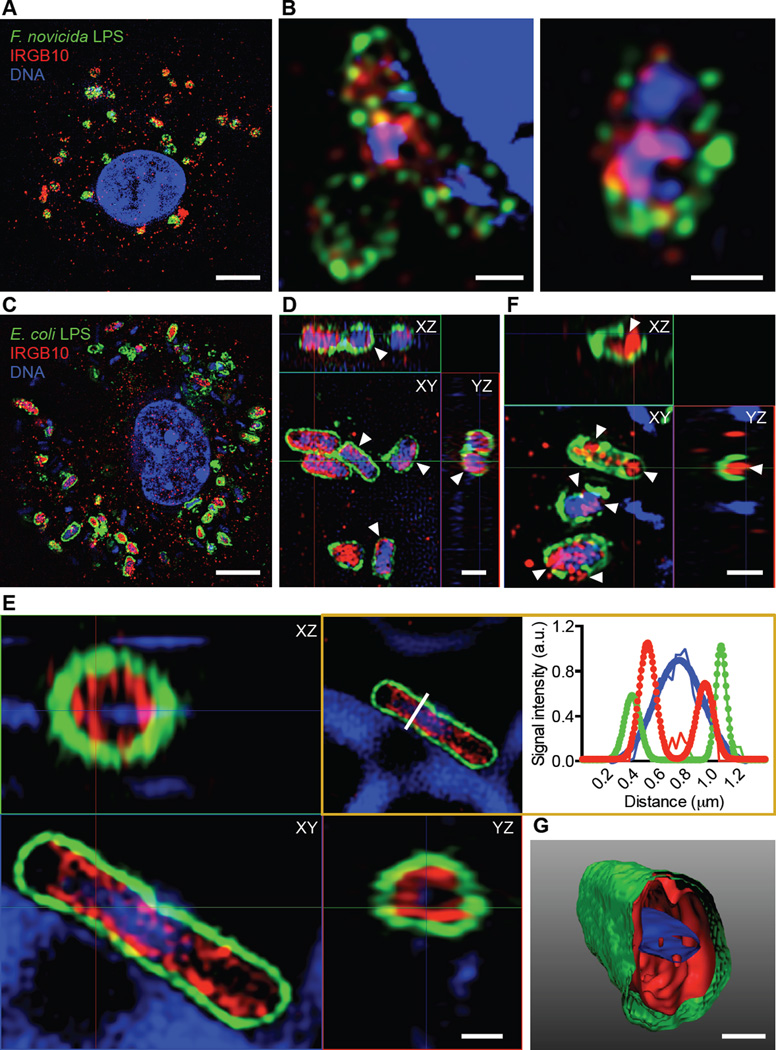
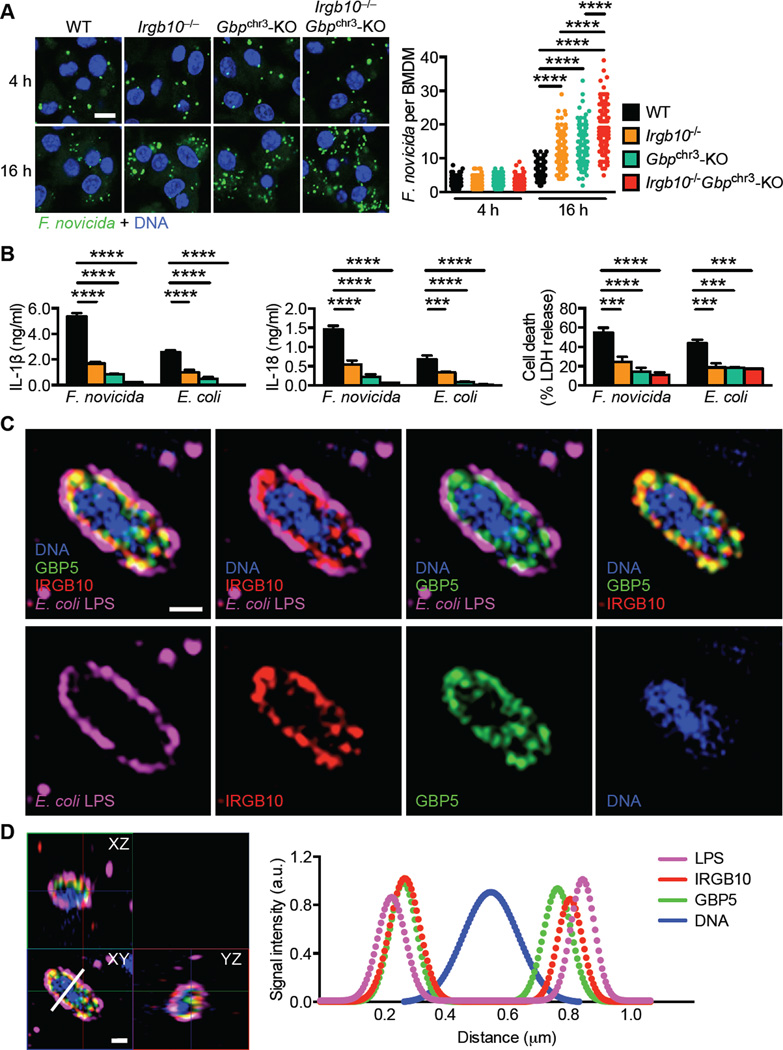
The inflammasome is an intracellular signaling complex, which on recognition of pathogens and physiological aberration, drives activation of caspase-1, pyroptosis, and the release of the pro-inflammatory cytokines IL-1β and IL-18. Bacterial ligands must secure entry into the cytoplasm to activate inflammasomes; however, the mechanisms by which concealed ligands are liberated in the cytoplasm have remained unclear. Here, we showed that the interferon-inducible protein IRGB10 is essential for activation of the DNA-sensing AIM2 inflammasome by Francisella novicida and contributed to the activation of the LPS-sensing caspase-11 and NLRP3 inflammasome by Gram-negative bacteria. IRGB10 directly targeted cytoplasmic bacteria through a mechanism requiring guanylate-binding proteins. Localization of IRGB10 to the bacterial cell membrane compromised bacterial structural integrity and mediated cytosolic release of ligands for recognition by inflammasome sensors. Overall, our results reveal IRGB10 as part of a conserved signaling hub at the interface between cell-autonomous immunity and innate immune sensing pathways.

Keywords: GBP2; GBP5; GBPs; LPS; caspase-1; cell-autonomous immunity; immunity-related GTPases; innate immunity; interferons; non-canonical inflammasome.


Figures

Figure 1
Figure 1. IRGB10 is required for activation of the AIM2 inflammasome by F. novicida (See also Figures S1–S3)
(A) Immunoblot analysis of IRF1, IRGB10, GBP2, GBP5 and GAPDH (loading control) in unprimed wild-type (WT) or mutant BMDMs at various times (above lane) after infection with F. novicida (multiplicity of infection [MOI], 50). (B) Real-time quantitative RT-PCR analysis of the gene encoding IRGB10 in BMDMs 8 h after infection with F. novicida, presented relative to that of the gene encoding GAPDH. (C) Immunoblot analysis of pro-caspase-1 (Pro-Casp-1) and the caspase-1 subunit p20 (Casp-1 p20) in unprimed WT or mutant BMDMs left uninfected or untreated (medium alone [Med]) or assessed 20 h after infection with F. novicida (MOI, 100; left) or 5 h after transfection with poly(dA:dT) and pcDNA (middle) or 10 h after infection with mouse cytomegalovirus (MCMV; right). (D) Release of IL-1β (top), IL-18 (middle) and death (bottom) of unprimed BMDMs after treatment as in (C). (E) Microscopy analysis of the death of unprimed BMDMs after treatment as in (C). (F) Confocal microscopy analysis of ASC in unprimed BMDMs infected with F. novicida (MOI, 100) for 20 h or 5 h after transfection with poly(dA:dT). Quantification of the prevalence of ASC inflammasome speck. At least 200 BMDMs from each genotype were analyzed. Scale bars, 10 µm (E and F). Arrowheads indicate dead cells (E) or inflammasome specks (F). NS, not statistically significant, ***P < 0.001 and ****P < 0.0001 (two-tailed t-test [D]); one-way analysis of variance [ANOVA] with Dunnett’s multiple-comparisons test [F]). Data are representative of two (B and F) or three independent experiments (A, C–E; mean and s.e.m. in B, D and F).
Figure 2
Figure 2. IRGB10 contributes to activation of the caspase-11–NLRP3 inflammasome (See also Figures S3 and S4)
(A) Immunoblot analysis of caspase-1, the release of IL-1β and IL-18, and death of unprimed BMDMs left untreated or assessed 4 h after infection with Salmonella Typhimurium (STm; MOI, 1). (B) Immunoblot analysis of caspase-1 in unprimed BMDMs left untreated or assessed 20 h after infection with C. rodentium, E. coli or 10 h after LPS transfection. (C) Release of IL-1β (left), IL-18 (middle) and death (right) of unprimed BMDMs after treatment as in (B). (D) Microscopy analysis of the death of primed BMDMs 10 h after LPS transfection. (E) Immunoblot analysis of IRGB10, pro-IL-1β, pro-caspase-11 (Pro-Casp-11) and the caspase-11 subunit p26 (Casp-11 p26) and GAPDH (loading control) in unprimed WT or mutant BMDMs at various times (above lane) after infection with E. coli (MOI, 20). (F) Immunoblot analysis of caspase-1 in unprimed BMDMs (Med) or LPS-primed BMDMs stimulated with ATP (LPS + ATP) or nigericin (LPS + Nig). (G) Release of IL-1β and IL-18 and death of BMDMs analyzed as in (F). Scale bar, 10 µm (D). Arrowheads indicate dead cells (D). NS, not statistically significant, *P < 0.05, **P < 0.01 and ***P < 0.001 (two-tailed t-test [A, C and G]). Data are representative of three independent experiments (A–G; mean and s.e.m. in A, C and G).
Figure 3
Figure 3. Recruitment of IRGB10 to bacteria requires guanylate-binding proteins (See also Figure S4)
(A) Immunofluorescence staining of LPS (green), IRGB10 (red) and DNA (blue) in unprimed WT BMDMs 16 h after infection with F. novicida (left) or E. coli (right). (B) Immunofluorescence staining as in (A) in unprimed WT, Irgb10−/− and Gbpchr3-KO BMDMs 16 h after infection with F. novicida (top) or E. coli (bottom). (C) Immunoblot analysis of IRGB10 in cross-linked fraction or the lysate of unprimed BMDMs left untreated or assessed 16 h after stimulation with IFN-β (200 U/ml) or infection with F. novicida (MOI, 100). (D) Release of IL-1β, IL-18 and death of unprimed BMDMs assessed 16 h after infection as in (A). (E) Immunoblot analysis of IRGB10, GBP2, GBP5 and GAPDH (loading control) in unprimed WT and Gbpchr3-KO BMDMs infected with F. novicida (MOI, 50). Scale bar, 10 µm (A) and 5 µm (B). White arrowheads indicate bacteria targeted by IRGB10 (B). Black arrowheads indicate a non-specific band (C). **P < 0.01, ***P < 0.001 and ****P < 0.0001; (two-tailed t-test [D]). Data are representative of two (C) or three independent experiments (A, B, D and E; mean and s.e.m. in D).
Figure 4
Figure 4. IRGB10 directly targets intracellular bacteria (See also Figure S4 and Movie S1)
(A) Immunofluorescence staining of LPS (green), IRGB10 (red) and DNA (blue) in unprimed WT BMDMs 16 h after infection with F. novicida. Three-dimensional images were taken using the Structured Illumination Microscopy (SIM) technique. A single z-plane of a 3D image is shown. (B) A higher resolution image of F. novicida cells taken using SIM as in (A). (C) Immunofluorescence staining of LPS (green), IRGB10 (red) and DNA (blue) in unprimed WT BMDMs 16 h after infection with E. coli. Images were taken using SIM. (D) An enlarged and orthogonal-view image of E. coli cells taken using SIM as in (C). (E) An enlarged and orthogonal-view image of an E. coli cell taken using SIM. White line (boxed image) indicates a line scan analysis of the SIM image. The line scan values for each signal were plotted and fitted with single and double Gaussian equations (boxed graph). (F) An enlarged and orthogonal-view image of an E. coli cell taken using SIM. (G) Three-dimensional surface rendering of an E. coli cell shown in (E). Scale bars, 5 µm (A and C), 0.5 µm (B, E and G) and 1 µm (D and F). Arrowheads indicate a layer of IRGB10 staining internal to a layer of LPS staining (D) or a disrupted LPS layer (F). Data are representative of two independent experiments (A–G).
Figure 5
Figure 5. IRGB10 targets the bacterial cell membrane (See also Figures S5 and S6)
(A) Immunogold staining of IRGB10 in unprimed WT BMDMs 16 h after infection with E. coli, acquired using transmission electron microscopy (left). Quantification of the number of IRGB10 puncta in regular-shaped (n = 35) and irregular-shaped (n = 74) bacteria in control samples (secondary antibody only) and regular-shaped (n = 82) and irregular-shaped (n = 79) bacteria in IRGB10-stained samples (right). Images of regular-shaped (top inset) and irregular-shaped (bottom inset) bacteria. (B) Images of E. coli cells targeted by IRGB10, acquired as in (A). White arrowheads indicate an intact bi-layer bacterial cell membrane. Black arrowheads indicate the presence of IRGB10 and a loss of the bacterial cell membrane. Images of IRGB10-containing vesicles fused with the bacterial cell membrane (insets). (C) Images of E. coli cells targeted by IRGB10, acquired as in (A). Black arrowheads indicate IRGB10-containing vesicles being delivered to or fused with the bacterial cell membrane. Scale bars, 500 nm (A), 200 nm (B), and 100 nm (C). NS, not statistically significant, ****P < 0.0001 (one-way ANOVA with Tukey’s multiple-comparisons test [A]). Data are from two (A–C) independent experiments (mean and s.e.m. in A).
Figure 6
Figure 6. IRGB10 and GBPs coordinate to mediate bacterial killing (See also Figure S7)
(A) Immunofluorescence staining of F. novicida LPS (green) and DNA (blue) in unprimed BMDMs 4 and 16 h after infection with F. novicida (left). Quantification of F. novicida in WT BMDMs (4 h, n = 177; 16 h, n = 127), Irgb10−/− (4 h, n = 160; 16 h, n = 130), Gbpchr3-KO (4 h, n = 158; 16 h, n = 116), and Irgb10−/− Gbpchr3-KO (4 h, n = 178; 16 h, n = 143) BMDMs, assessed by confocal microscopy (right). Each symbol represents an individual BMDM. (B) Release of IL-1β (left), IL-18 (middle) and death (right) of unprimed BMDMs and 16 h after infection with F. novicida (MOI, 100) or E. coli (MOI, 20). (C) Immunofluorescence staining of DNA (blue), GBP5 (green), IRGB10 (red), and LPS (magenta) in unprimed WT BMDMs 16 h after infection with E. coli. 3D images were taken using SIM. A single z-plane of a 3D image of an enlarged image of an E. coli cell is shown (top). (D) An enlarged and orthogonal-view image of the same E. coli cell as in (C) is shown (left). White line indicates a line scan analysis of the SIM image. The line scan values for each signal were plotted and fitted with single and double Gaussian equations (right). Scale bars, 10 µm (A) and 0.5 µm (C and D). ***P < 0.001 and ****P < 0.0001 (one-way ANOVA with Dunnett’s multiple-comparisons test [A and B]). Data are from two (A, C and D) or three (B) independent experiments (mean and s.e.m. in B).
Figure 7
Figure 7. IRGB10 provides host protection against infection with F. novicida in vivo
(A) Survival of 8-week-old WT mice (n = 20), Irgb10−/− mice (n = 30), Gbpchr3-KO mice (n = 13), Aim2−/− (n = 20) and Casp1Null mice (n = 12) infected subcutaneously with 7.5 × 10⁴ CFU of F. novicida. (B) Body weight of 8-week-old WT mice (n = 12), Irgb10−/− mice (n = 20), Gbpchr3-KO mice (n = 8), Aim2−/− (n = 11) and Casp1Null mice (n = 10) 0–7 d (horizontal axis) after subcutaneous infection with 1.5 × 10⁵ CFU of F. novicida, presented relative to initial body weight at day 0, set as 100%. (C) Bacterial burden in the liver (left) and spleen (right) of 8-week-old WT mice (n = 18), Irgb10−/− (n = 10) and Aim2−/− mice (n = 8) on day 3 after infection with 1 × 10⁵ CFU of F. novicida. (D) Concentration of IL-18 in the serum of WT mice (n = 28), Irgb10−/− mice (n = 23), Gbpchr3-KO mice (n = 7), Aim2−/− (n = 14) and Casp1Null mice (n = 14) 24 h after infection with 1.5 × 10⁵ CFU of F. novicida. Each symbol represents an individual mouse (C and D). ***P < 0.0001 and ****P < 0.0001 (log-rank test [A] or one-way ANOVA with Dunnett’s multiple-comparisons test [C and D]). Data are pooled from two independent experiments (A, C and D) or are from one experiment representative of two independent experiments (B; mean and s.e.m. in B, C and D).

Comment in

Similar articles

Cited by

References

    1. Bekpen C, Hunn JP, Rohde C, Parvanova I, Guethlein L, Dunn DM, Glowalla E, Leptin M, Howard JC. The interferon-inducible p47 (IRG) GTPases in vertebrates: loss of the cell autonomous resistance mechanism in the human lineage. Genome biology. 2005;6:R92. - PMC - PubMed
    1. Bernstein-Hanley I, Balsara ZR, Ulmer W, Coers J, Starnbach MN, Dietrich WF. Genetic analysis of susceptibility to Chlamydia trachomatis in mouse. Genes and immunity. 2006a;7:122–129. - PubMed
    1. Bernstein-Hanley I, Coers J, Balsara ZR, Taylor GA, Starnbach MN, Dietrich WF. The p47 GTPases Igtp and Irgb10 map to the Chlamydia trachomatis susceptibility locus Ctrq-3 and mediate cellular resistance in mice. Proceedings of the National Academy of Sciences of the United States of America. 2006b;103:14092–14097. - PMC - PubMed
    1. Broz P, Newton K, Lamkanfi M, Mariathasan S, Dixit VM, Monack DM. Redundant roles for inflammasome receptors NLRP3 and NLRC4 in host defense against Salmonella. The Journal of experimental medicine. 2010;207:1745–1755. - PMC - PubMed
    1. Broz P, Ruby T, Belhocine K, Bouley DM, Kayagaki N, Dixit VM, Monack DM. Caspase-11 increases susceptibility to Salmonella infection in the absence of caspase-1. Nature. 2012;490:288–291. - PMC - PubMed

Publication types

MeSH terms