Relationship between structural and functional connectivity change across the adult lifespan: A longitudinal investigation
- PMID: 27654880
- PMCID: PMC5148650
- DOI: 10.1002/hbm.23403
Relationship between structural and functional connectivity change across the adult lifespan: A longitudinal investigation
Abstract
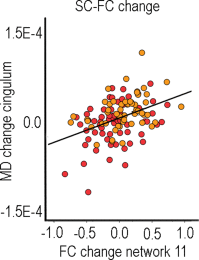
Extensive efforts are devoted to understand the functional (FC) and structural connections (SC) of the brain. FC is usually measured by functional magnetic resonance imaging (fMRI), and conceptualized as degree of synchronicity in brain activity between different regions. SC is typically indexed by measures of white matter (WM) properties, for example, by diffusion weighted imaging (DWI). FC and SC are intrinsically related, in that coordination of activity across regions ultimately depends on fast and efficient transfer of information made possible by structural connections. Convergence between FC and SC has been shown for specific networks, especially the default mode network (DMN). However, it is not known to what degree FC is constrained by major WM tracts and whether FC and SC change together over time. Here, 120 participants (20-85 years) were tested at two time points, separated by 3.3 years. Resting-state fMRI was used to measure FC, and DWI to measure WM microstructure as an index of SC. TRACULA, part of FreeSurfer, was used for automated tractography of 18 major WM tracts. Cortical regions with tight structural couplings defined by tractography were only weakly related at the functional level. Certain regions of the DMN showed a modest relationship between change in FC and SC, but for the most part, the two measures changed independently. The main conclusions are that anatomical alignment of SC and FC seems restricted to specific networks and tracts, and that changes in SC and FC are not necessarily strongly correlated. Hum Brain Mapp 38:561-573, 2017. © 2016 Wiley Periodicals, Inc.
Keywords: aging; functional connectivity; longitudinal; magnetic resonance imaging; resting-state; structural connectivity; tractography.
© 2016 Wiley Periodicals, Inc.
Conflict of interest statement
The authors declare no competing financial interests.
Figures


Similar articles
-
Structural architecture supports functional organization in the human aging brain at a regionwise and network level.Hum Brain Mapp. 2016 Jul;37(7):2645-61. doi: 10.1002/hbm.23200. Epub 2016 Apr 4. Hum Brain Mapp. 2016. PMID: 27041212 Free PMC article.
-
Multimodal description of whole brain connectivity: A comparison of resting state MEG, fMRI, and DWI.Hum Brain Mapp. 2016 Jan;37(1):20-34. doi: 10.1002/hbm.22995. Epub 2015 Oct 27. Hum Brain Mapp. 2016. PMID: 26503502 Free PMC article.
-
The structural and functional connectivity of the posterior cingulate cortex: comparison between deterministic and probabilistic tractography for the investigation of structure-function relationships.Neuroimage. 2014 Nov 15;102 Pt 1:118-27. doi: 10.1016/j.neuroimage.2013.12.022. Epub 2013 Dec 21. Neuroimage. 2014. PMID: 24365673 Review.
-
White Matter Structural Connectivity Is Not Correlated to Cortical Resting-State Functional Connectivity over the Healthy Adult Lifespan.Front Aging Neurosci. 2017 May 18;9:144. doi: 10.3389/fnagi.2017.00144. eCollection 2017. Front Aging Neurosci. 2017. PMID: 28572765 Free PMC article.
-
Dynamic functional connectivity of neurocognitive networks in children.Hum Brain Mapp. 2017 Jan;38(1):97-108. doi: 10.1002/hbm.23346. Epub 2016 Aug 18. Hum Brain Mapp. 2017. PMID: 27534733 Free PMC article.
Cited by
-
Association of Brain Microstructure and Functional Connectivity With Cognitive Outcomes and Postnatal Growth Among Early School-Aged Children Born With Extremely Low Birth Weight.JAMA Netw Open. 2023 Mar 1;6(3):e230198. doi: 10.1001/jamanetworkopen.2023.0198. JAMA Netw Open. 2023. PMID: 36862414 Free PMC article.
-
Poor Sleep Quality Associates With Decreased Functional and Structural Brain Connectivity in Normative Aging: A MRI Multimodal Approach.Front Aging Neurosci. 2018 Nov 20;10:375. doi: 10.3389/fnagi.2018.00375. eCollection 2018. Front Aging Neurosci. 2018. PMID: 30524267 Free PMC article.
-
Covariance-based vs. correlation-based functional connectivity dissociates healthy aging from Alzheimer disease.Neuroimage. 2022 Nov 1;261:119511. doi: 10.1016/j.neuroimage.2022.119511. Epub 2022 Jul 30. Neuroimage. 2022. PMID: 35914670 Free PMC article.
-
Exploring subtypes of multiple sclerosis through unsupervised machine learning of automated fiber quantification.Jpn J Radiol. 2024 Jun;42(6):581-589. doi: 10.1007/s11604-024-01535-1. Epub 2024 Feb 27. Jpn J Radiol. 2024. PMID: 38409299
-
White matter disconnection is related to age-related phonological deficits.Brain Imaging Behav. 2020 Oct;14(5):1555-1565. doi: 10.1007/s11682-019-00086-8. Brain Imaging Behav. 2020. PMID: 30937829 Free PMC article.
References
-
- Adamczuk K, De Weer A‐S, Nelissen N, Dupont P, Sunaert S, Bettens K, Sleegers K, Van Broeckhoven C, Van Laere K, Vandenberghe R (2016): Functional changes in the language network in response to increased amyloid β deposition in cognitively intact older adults. Cereb Cortex. pii: bhw117. [Epub ahead of print]. - PubMed
-
- Agosta F, Pievani M, Geroldi C, Copetti M, Frisoni GB, Filippi M (2012): Resting state fMRI in Alzheimer's disease: Beyond the default mode network. Neurobiol Aging 33:1564–1578. - PubMed
-
- Akaike H (1974): A new look at the statistical model identification. IEEE Trans Automat Contr 19:716–723.
-
- Antonenko D, Floel A (2014): Healthy aging by staying selectively connected: A mini‐review. Gerontology 60:3–9. - PubMed
Publication types
MeSH terms
Substances
Grants and funding
LinkOut - more resources
Full Text Sources
Other Literature Sources
Medical

