. 2016 Oct;22(10):1108-1119.
doi: 10.1038/nm.4181. Epub 2016 Sep 19.

Inhibition of acetyl-CoA carboxylase suppresses fatty acid synthesis and tumor growth of non-small-cell lung cancer in preclinical models

Affiliations

Inhibition of acetyl-CoA carboxylase suppresses fatty acid synthesis and tumor growth of non-small-cell lung cancer in preclinical models

Robert U Svensson et al. Nat Med. 2016 Oct.

Abstract

Continuous de novo fatty acid synthesis is a common feature of cancer that is required to meet the biosynthetic demands of a growing tumor. This process is controlled by the rate-limiting enzyme acetyl-CoA carboxylase (ACC), an attractive but traditionally intractable drug target. Here we provide genetic and pharmacological evidence that in preclinical models ACC is required to maintain the de novo fatty acid synthesis needed for growth and viability of non-small-cell lung cancer (NSCLC) cells. We describe the ability of ND-646-an allosteric inhibitor of the ACC enzymes ACC1 and ACC2 that prevents ACC subunit dimerization-to suppress fatty acid synthesis in vitro and in vivo. Chronic ND-646 treatment of xenograft and genetically engineered mouse models of NSCLC inhibited tumor growth. When administered as a single agent or in combination with the standard-of-care drug carboplatin, ND-646 markedly suppressed lung tumor growth in the Kras;Trp53-/- (also known as KRAS p53) and Kras;Stk11-/- (also known as KRAS Lkb1) mouse models of NSCLC. These findings demonstrate that ACC mediates a metabolic liability of NSCLC and that ACC inhibition by ND-646 is detrimental to NSCLC growth, supporting further examination of the use of ACC inhibitors in oncology.


Conflict of interest statement

COMPETING FINANCIAL INTERESTSJ.G. and S.B. are employed by Schrödinger; G.H., W.F.W., H.J.H., and R.K. are employed by Nimbus Therapeutics.

Figures
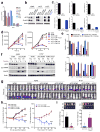
Figure 1
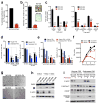
Figure 1. Acetyl-CoA Carboxylase 1 (ACC1) is required for FASyn to support viability of non-small cell lung cancer cells in vitro and in vivo
(a) ACC1 and ACC2 mRNA expression in eight human NSCLC cell lines. (b) CRISPR/Cas9 deletion of ACC1 in A549 and H157 NSCLC cells. Western blot shows ACC detection from one of three separate experiments. (c) Palmitate (left), stearate (middle) or oleate (right) synthesis in [U-13C6]glucose labeled A549 clones (top) or H157 clones (bottom). (d) Cellular growth of A549 and H157 WT and ACC1-KO clones in medium containing regular FBS ± 200 μM exogenous palmitate (PA). (e) Viability of WT and ACC1-KO clones (A549: top, H157: bottom) after 7 days. (f) Cleaved PARP and CHOP expression in WT and ACC1-KO clones after 5 days of growth. (g) Bioluminescence overlay images of subcutaneous growth of WT and ACC1-KO clones in nude mice (n=5 per clone). Day 42 images normalized to Day 0. Scale bar =1 cm (h) Tumor growth of WT and ACC1-KO clones, represented as logarithmic fold change in photon flux during each imaging time-point relative to Day 0 (n= 10 tumors per clone). (i) Average weight of all tumors from A549 (left) and H157 (right) clones. Number in graph represents total number of tumors per genotype. Inset images are representative of dissected tumors. Scale bar =1 cm. For (c–e) triplicate values were recorded and data are shown from one of least two separate experiments. All values are expressed as means ± s.e.m. * P<0.05 ** P<0.01 *** P<0.001 **** P< 0.0001 relative to WT (c, e, hi-left) or relative to ACC1-KO (d, hi-right) determined by ANOVA (d, e, h) with Tukeys method for multiple comparison or two sided student t test (c, i).
Figure 2
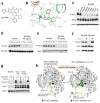
Figure 2. Properties of ND-646, a small molecule allosteric inhibitor of ACC. AMPK phosphorylation sites can be used as a biomarker to monitor ACC engagement by ND-646
(a) Chemical structure of ND-646. (b) Model of ND-646 bound to the BC domain of human ACC1. Image depicts a docked pose of ND-646 and ACC1 derived from co-crystal structures of ND-646 complexed with huACC2. (c) P-ACC detection in A549 cells treated for 24 hrs with 5000 nM ND-608 or a dose response of ND-646. (d) P-ACC detection in livers of FVB/n mice and (f) KrasG12D/+; p53−/ lung tumors in mice treated orally with a single dose of vehicle or 50 mg/kg ND-646 for 3 hrs. Numbers represent individual samples from separate mice (n=5 per treatment). (f) P-ACC detection in A549 cells co-treated with either 500 nM ND-608 or ND-646 ± Calyculin A (Cal-A) for 1 hr. (g) P-ACC detection in ACC1-KO HEK293 cells transiently expressing Mock, ACC1 wild-type or ACC1 phosphopeptide binding mutant (ACC1R172A). Cells were treated with 500 nM ND-646 ± Cal-A. (h) Model describing the mechanism of ACC inhibition by ND-646 and the P-ACC biomarker. Identical effects occur in ACC2-BC at the conserved residues. For (cg) data are representative from one of at least two separate experiments.
Figure 3
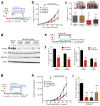
Figure 3. ND-646 inhibits FASyn in vitro and induces apoptosis in NSCLC cells
(a) Palmitate synthesis in [U-13C6]glucose labeled A549 cells treated with either 500 nM ND-608 or 500 nM ND-646 for 24 hrs. (b) Quantitation of cellular fatty acid content in A549 cells treated with 500 nM ND-608 or 500 nM ND-646 for 72 hrs. Inset images show Oil-Red-O staining of A549 cells. Scale bar = 50 μm (c) Percent reduction of individual fatty acids in A549 cells after 72hrs. (d) Growth of A549 (left) and H460 (right) cells treated with vehicle, 500 nM ND-608 or ND-646 in media containing either regular FBS or delipidated FBS. Cell number shown at day 7-post treatment normalized to percent vehicle. (e) Viability of A549 (left) and H157 (right) WT or ACC1-KO clones treated with 500 nM ND-646. Percent viability normalized to WT vehicle. (f) Cellular growth of A549 cells co-treated in delipidated FBS with either 500 nM ND-608 or 500 nM ND-646 and 200 μM palmitate (PA). (g) Images of A549 cells at day 7 post treatment. Scale bar = 50 μm (h) Cleaved PARP expression in A549 cells treated with either 500 nM ND-608 or 500 nM ND-646 in media containing regular FBS at 3, 4 or 5 days post treatment. Arrow denotes molecular weight of cleaved PARP. (i) Palmitate rescue of apoptosis and ER stress in A549 cells co-treated with 200 μM Palmitate and 500 nM ND-608 or 500 nM ND-646 in media containing either regular FBS or delipidated FBS for 5 days.. Technical replicates ranged from three (ad) to six (e) and are shown from one of at least two separate experiments. All values are expressed as means ± s.e.m. * P<0.05 ** P<0.01 *** P<0.001 **** P<0.001 relative to ND-608 or WT control determined by ANOVA with Tukeys method for multiple comparison (df) or two sided student t test (ac).
Figure 4
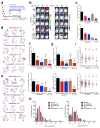
Figure 4. ND-646 inhibits FASyn and tumor growth in NSCLC xenograft models
(a) Schematic of ND-646 trial design in A549 subcutaneous tumors (b) Growth of A549 tumors treated with vehicle BID (n=8 mice) or ND-646 at 25 mg/kg QD (n=9 mice), 25 mg/kg BID (n=8 mice) or 50 mg/kg QD (n=10 mice). (c) Box and Whisker plot of tumor volumes at the end of the study (day 42). Inset images are representative from vehicle and ND-646 25mg/kg BID treated mice. Scale bar = 1cm. (d) P-ACC and P-EIF2αS51 analysis in A549 tumors. .Numbers represent individual tumors from separate mice. (e) Schematic of 2H2O labeling to measure FASyn in A549 lung tumors (n=4 mice per treatment). (f) Fractional de novo palmitate (C16:0) and stearate (C18:0) synthesis (left) and maximal synthesis flux rate (right) is shown in A549 lung tumors (n=12 tumors per treatment) (g) Schematic of ND-646 trial design in A549 xenograft lung tumors. (h) Growth of A549 lung tumors treated with vehicle BID (n=9 mice), ND-646 50 mg/kg BID (n=7 mice), or 100 mg/kg BID (n=9 mice) or Carboplatin (n=9 mice). (i) Quantitation of tumor area as a percentage of total lung area. Average tumor area per treatment is shown. Numbers in graphs (c, f, i) represent percent decrease compared to vehicle control. All values are expressed as means ± s.e.m. * P<0.05 ** P<0.01 *** P<0.001 relative to vehicle control determined by two sided student t test. Experiments were performed once for each assay.
Figure 5
Figure 5. ND-646 inhibits FASyn in lung tumors of KrasG12D p53−/− and KrasG12D Lkb1−/− mouse models of NSCLC and lowers plasma free fatty acids
(a) Schematic of 2H2O labeling to quantitate FASyn in KPluc and KLluc autochthonous lung tumors (n= 4–5 mice per treatment). (b) Maximal synthesis rate of palmitate (C16:0) and stearate (C18:0) in KPluc lung tumors (left) and KLluc lung tumors (right) after 1 week of ND-646 treatment (PO). 3 tumors per mouse were analyzed. Total number of tumors analyzed is shown in graph. Numbers above bars represent percent decrease compared to vehicle treatment. (c) Quantitation of individual free fatty acids (FFA) in KPluc lung tumors and (d) KLluc lung tumors. Left panel shows high abundance FFAs and right panel shows low abundance FFAs. (e) Quantitation of individual free fatty acids (FFA) in plasma from KPluc and (f) KLluc mice. Left panel shows high abundance FFAs and right panel shows low abundance FFAs. Number of tumors and plasma samples analyzed per experiment are shown in graphs. Experiments were performed once for each assay. All values are expressed as means ± s.e.m. * P<0.05 ** P<0.01 *** P<0.001 relative to vehicle treatment determined by two sided student t test. # Represents p values >0.05 p <0.1. Exact p values (cf) and % reduction in FFAs are shown in Supplementary Fig. 5e–f.
Figure 6
Figure 6. ND-646 suppresses KrasG12D p53−/− and KrasG12D Lkb1−/− autochthonous NSCLC tumor growth
(a) Schematic of ND-646 pre-clinical trial design in KrasG12D/+ p53fl/fl (KPluc) and KrasG12D/+ LKB1fl/fl (KLluc) genetic NSCLC tumor models (b) Bioluminescence overlay images of ND-646 efficacy in KPluc (left) and KLluc (right) lung tumors. Images are representative for each treatment condition. Scale bar = 1cm. (c) Fold change in photon flux for each group during the treatment period (day 35 to day 77). KPluc (top) and KLluc (bottom). (d) Representative H&E stained sections of KPluc and (e) KLluc lung tumors from each treatment group. Number of animals (n) per treatment condition is shown. Scale bar = 5000 μm (f) Tumor burden analysis in KPluc (top) and KLluc (bottom) treated mice. Tumor area was calculated as a percentage of total lung area. Average tumor area per treatment is shown. (g) Average tumor size (mm2) in KPluc (top) and KLluc (bottom) mice. (h) KPluc (left) and KLluc (right) tumors binned by size (from g) and percent of tumors within in each size bin represented per treatment condition. (i) BrdU positivity of KPluc (top) and KLluc (bottom) tumors from each treatment (log2 scale). % BrdU positive cells per tumor was quantified and each dot represents an individual tumor (n=48–262 tumors per treatment). Number of mice per treatment group shown in (d, e). For (g-h) number of tumors analyzed ranged from 46 to 327 based on treatment condition (see source data). All values are expressed as means ± s.e.m. * P<0.05 ** P<0.01 *** P<0.001 relative to vehicle control determined by Mann Whitney test (f, g) or ANOVA with Tukeys method for multiple comparison (i).

Comment in

Similar articles

Cited by

References

    1. Vander Heiden MG, Cantley LC, Thompson CB. Understanding the Warburg effect: the metabolic requirements of cell proliferation. Science. 2009;324:1029–1033. - PMC - PubMed
    1. Hanahan D, Weinberg RA. Hallmarks of cancer: the next generation. Cell. 2011;144:646–674. - PubMed
    1. Kuhajda FP. Fatty-acid synthase and human cancer: new perspectives on its role in tumor biology. Nutrition. 2000;16:202–208. - PubMed
    1. Menendez JA, Lupu R. Fatty acid synthase and the lipogenic phenotype in cancer pathogenesis. Nat Rev Cancer. 2007;7:763–777. - PubMed
    1. Currie E, Schulze A, Zechner R, Walther TC, Farese RV., Jr Cellular fatty acid metabolism and cancer. Cell Metab. 2013;18:153–161. - PMC - PubMed

MeSH terms