. 2016 Oct 26;3(4):361-373.e6.
doi: 10.1016/j.cels.2016.08.012. Epub 2016 Sep 15.

A Portrait of the Human Organelle Proteome In Space and Time during Cytomegalovirus Infection

Affiliations

A Portrait of the Human Organelle Proteome In Space and Time during Cytomegalovirus Infection

Pierre M Jean Beltran et al. Cell Syst. .

Abstract

The organelles within a eukaryotic host are manipulated by viruses to support successful virus replication and spread of infection, yet the global impact of viral infection on host organelles is poorly understood. Integrating microscopy, subcellular fractionation, mass spectrometry, and functional analyses, we conducted a cell-wide study of organelles in primary fibroblasts throughout the time course of human cytomegalovirus (HCMV) infection. We used label-free and isobaric-labeling proteomics to characterize nearly 4,000 host and 100 viral proteins, then classified their specific subcellular locations over time using machine learning. We observed a global reorganization of proteins across the secretory pathway, plasma membrane, and mitochondria, including reorganization and processing of lysosomal proteins into distinct subpopulations and translocations of individual proteins between organelles at specific time points. We also demonstrate that MYO18A, an unconventional myosin that translocates from the plasma membrane to the viral assembly complex, is necessary for efficient HCMV replication. This study provides a comprehensive resource for understanding host and virus biology during HCMV pathogenesis.

Keywords: HCMV; cytomegalovirus; organelle; proteomics; spatial.


Figures

Figure 1
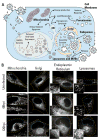
Figure 1. Cytoplasmic organelles undergo changes in shape, size, number, and organization following HCMV infection
A HCMV life cycle and the functional roles of organelles in viral replication. B Representative images of the structural reorganization of organelles in HCMV infection (n≥17). Images acquired from live cells (uninfected, 48 hpi, and 120 hpi) stained with dyes specific to each organelle. Yellow - cell periphery; Blue - nuclear periphery. Scale bar = 10μm. See also movie S1 and fig S1.
Figure 2
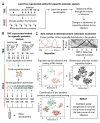
Figure 2. Proteomic approach to define spatial-temporal changes in organelle proteins throughout HCMV infection
A Workflow to determine temporal changes in organelle proteins throughout infection. B Workflow to determine changes in the subcellular localization of proteins throughout infection. C Data analysis to determine protein subcellular localization. The relative abundance between organelle fractions collected using the methods in A or B are inspected by dimensional reduction. Manually-curated organelle markers are used to assess the quality of the organelle separation in the gradient and to determine the identity of each cluster. Organelle markers are used to train machine learning models, which then classify the remaining proteins, resulting in confident spatial assignment of proteins at each time point of viral infection. See also fig S2.
Figure 3
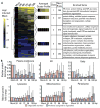
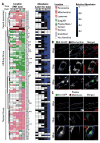
Figure 3. Temporal label-free proteomic analysis of organelles throughout HCMV infection
A Heatmap showing temporal changes of organelle proteins throughout infection. Only proteins with no missing values were displayed (2065 proteins). Hierarchical cluster determined five average cluster profiles. Significant gene ontology terms for each cluster are shown. MP = metabolic process. B Temporal change in protein abundance grouped by organelle for organelle markers (red) and proteins from localizations predicted in this study (blue). The median fold change normalized to uninfected (mock) is displayed with the interquartile range shown as black bars.
Figure 4
Figure 4. Protein subcellular localization assignment using organelle fractionation and alterations in the subcellular organization of lysosomal proteins
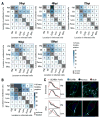
A 2-D representation of subcellular fractionation data using tSNE. The maps were overlaid with organelle markers (left) or assigned subcellular localizations using machine learning (right). Sizes are proportional to the probability scores for assignments. ER = endoplasmic reticulum. B Percent agreement of the localization assignment with other datasets in uninfected cells for mitochondria (left (Calvo et al., 2016) and right (Rhee et al., 2013)), lysosomes (Lubke et al., 2009), ER/Golgi (Christoforou et al., 2016), and the PM (Weekes et al., 2014). C Distribution of lysosomal proteins in the density gradient from uninfected and infected (120 hpi) cells. At 120 hpi, two distinct profiles are distinguished in fractions 3 (red) and 4 (blue). D Distributions of two representative lysosome proteins that either remain in fraction 3 (LAMP1) or shift to fraction 4 (LYAG) at 24, 48, 72, 96, and 120 hpi, and in uninfected cells (U). E IF images for endogenous LAMP1 and LYAG in uninfected and infected cells. At 120 hpi LAMP1 is enriched at the perinuclear Assembly Complex. F Distribution of LYAG peptides across the density gradient, originating from precursor ends or the 76kDa mature form. G WB showing differential LYAG processing at 72 hpi. IE1 (marker for early infection), UL99 (marker for late infection), and tubulin (loading control) are shown. See also Fig S3, S4, and S5.
Figure 5
Figure 5. Temporal localizations and abundances of viral proteins throughout infection
A Heatmap of the subcellular localization of viral proteins and their relative abundances throughout infection. Viral proteins were assigned localization to peroxisomes (brown), mitochondria (red), lysosomes (yellow), Golgi/ER (green), cytosol/PM (blue), and nucleus (pink). Darker colors indicate higher confidence in assignment. Identified proteins that did not pass the score threshold shown grey. Levels are normalized to the most abundant time point. B UL13-GFP co-localization with mitochondria by live fluorescenct microscopy at 24, 72, and 120 hpi. Scale bar = 10μm. C UL13-GFP co-localization with plasma membrane by live fluorescenct microscopy at 24, 72, and 120 hpi. Scale bar = 10μm. See also Fig S6
Figure 6
Figure 6. Protein translocation upon HCMV infection
A Heatmap showing the number of translocation events at each time point of infection. Rows indicate location in uninfected samples, and columns indicate localization at a specific time point of infection. PM = plasma membrane. B Sum of all translocation events throughout the course of infection. C Profile of SCARB1 compared to plasma membrane (PM) or lysosome markers in uninfected samples and at 72 hpi (left). IF validation of SCARB1 translocation (right). In uninfected cells, SCARB1 is observed at intracellular vesicles (arrowheads) and partially at the PM (arrows). At 96 hpi, SCARB1 primarily localizes to the PM (arrows). Merged images show SCARB1 (green), nucleus (blue), UL99 (infection marker, red), and delineation of the cell periphery (aqua). Scale bar = 10μm. See also Fig S7.
Figure 7
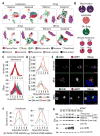
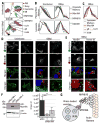
Figure 7. MYO18A translocates to the viral Assembly Complex and is important for viral production
A 2-D visualization for MYO18A gradient profile and its relation to other organelle-assigned proteins. B Gradient profile for MYO18A, MYO18A-associated host proteins (MYH9/10 and GOLGB1), and markers for the PM and lysosome. C Gradient profiles for MYO18A, viral proteins with similar profiles, and lysosome markers. D IF microscopy of MYO18A and Golgi marker (GOLGB1). Anti-MYO18A antibody detects both the full and the truncated (lacking the PDZ domain) isoforms. Scale bar = 10μm. E Co-staining of MYO18A and UL99 (Assembly Complex marker) by IF under different permeabilization conditions. Scale bar = 10μm. F RNAi-mediated knockdown of Myo18A decreases infectious particle production, as measured by IE1-positive infectious units (IU) per ml. Error bars show 95% C.I. Statistical significance (**) was assessed by two-sided student t-test for siCtrl vs siMyo18A-1 (p=9.7×10⁻⁵) and siCtrl vs siMyo18A-2 (p=8.9×10⁻⁴). G Hypothetical model for MYO18A function in HCMV replication.

Similar articles

Cited by

References

    1. Ahlqvist J, Mocarski E. Cytomegalovirus UL103 controls virion and dense body egress. J Virol. 2011;85:5125–5135. - PMC - PubMed
    1. Alwine JC. The human cytomegalovirus assembly compartment: a masterpiece of viral manipulation of cellular processes that facilitates assembly and egress. PLoS Pathog. 2012;8:e1002878. - PMC - PubMed
    1. Billington N, Beach JR, Heissler SM, Remmert K, Guzik-Lendrum S, Nagy A, Takagi Y, Shao L, Li D, Yang Y, et al. Myosin 18A coassembles with nonmuscle myosin 2 to form mixed bipolar filaments. Curr Biol. 2015;25:942–948. - PMC - PubMed
    1. Bishe B, Syed GH, Field SJ, Siddiqui A. Role of phosphatidylinositol 4-phosphate (PI4P) and its binding protein GOLPH3 in hepatitis C virus secretion. J Biol Chem. 2012;287:27637–27647. - PMC - PubMed
    1. Calvo SE, Clauser KR, Mootha VK. MitoCarta2.0: an updated inventory of mammalian mitochondrial proteins. Nucleic Acids Res. 2016;44:D1251–1257. - PMC - PubMed

Publication types

LinkOut - more resources