

Countdown to 2015 country case studies: what can analysis of national health financing contribute to understanding MDG 4 and 5 progress?
- PMID: 27634209
- PMCID: PMC5025819
- DOI: 10.1186/s12889-016-3403-4
Countdown to 2015 country case studies: what can analysis of national health financing contribute to understanding MDG 4 and 5 progress?
Abstract
Background: Countdown to 2015 (Countdown) supported countries to produce case studies that examine how and why progress was made toward the Millennium Development Goals (MDGs) 4 and 5. Analysing how health-financing data explains improvements in RMNCH outcomes was one of the components to the case studies.
Methods: This paper presents a descriptive analysis on health financing from six Countdown case studies (Afghanistan, Ethiopia, Malawi, Pakistan, Peru, and Tanzania), supplemented by additional data from global databases and country reports on macroeconomic, health financing, demographic, and RMNCH outcome data as needed. It also examines the effect of other contextual factors presented in the case studies to help interpret health-financing data.
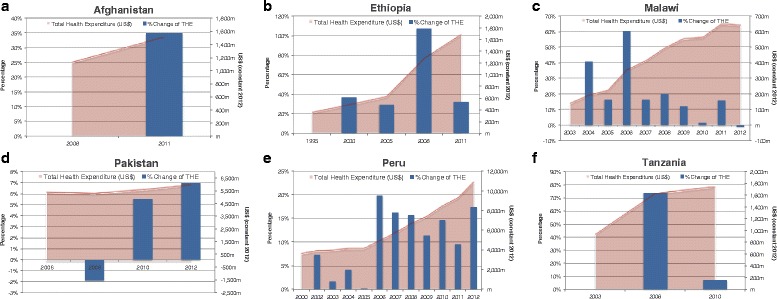
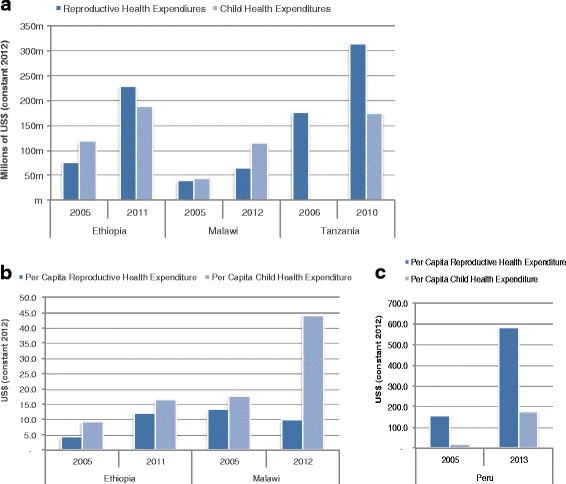
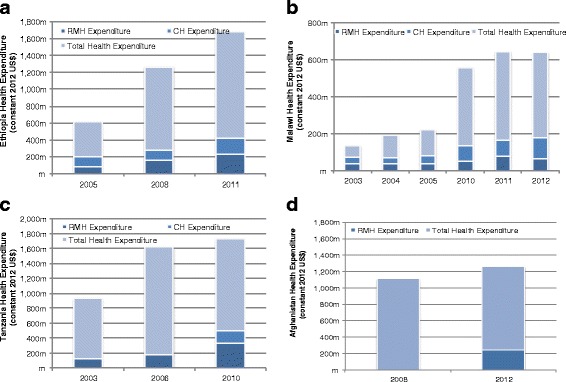
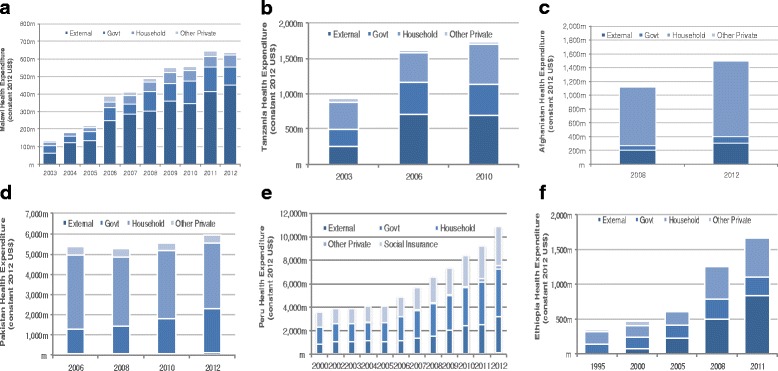
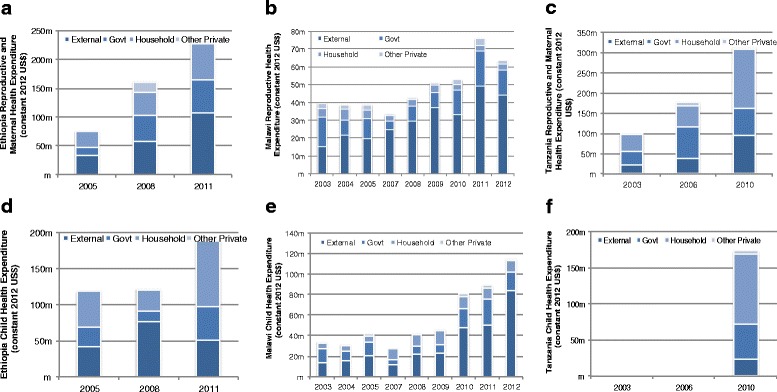
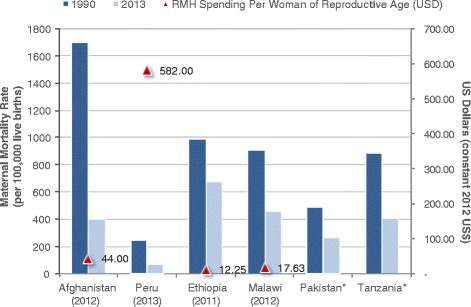
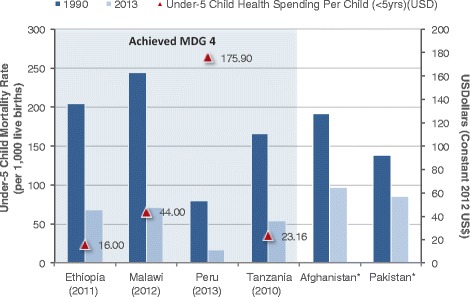
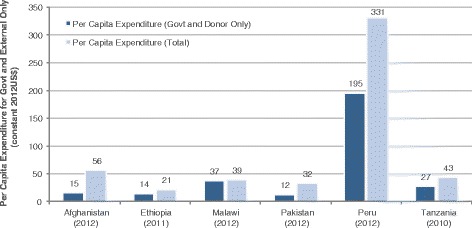
Results: Dramatic increases in health funding occurred since 2000, where the MDG agenda encouraged countries and donors to invest more resources on health. Most low-income countries relied on external support to increase health spending, with an average 20-64 % of total health spending from 2000 onwards. Middle-income countries relied more on government and household spending. RMNCH funding also increased since 2000, with an average increase of 119 % (2005-2010) for RMNH expenditures (2005-2010) and 165 % for CH expenditures (2005-2011). Progress was made, especially achieving MDG 4, even with low per capita spending; ranging from US$16 to US$44 per child under 5 years among low-income countries. Improvements in distal factors were noted during the time frame of the analysis, including rapid economic growth in Ethiopia, Peru, and Tanzania and improvements in female literacy as documented in Malawi, which are also likely to have contributed to MDG progress and achievements.
Conclusions: Increases in health and RMNCH funding accompanied improvements in outcomes, though low-income countries are still very reliant on external financing, and out-of-pocket comprising a growing share of funds in middle-income settings. Enhancements in tracking RMNCH expenditures across countries are still needed to better understand whether domestic and global health financing initiatives lead to improved outcomes as RMNCH continues to be a priority under the Sustainable Development Goals.
Keywords: Afghanistan; Child health; Ethiopia; Health finance; Malawi; Maternal health; Newborn health; Pakistan; Peru; Reproductive health; Tanzania.
Figures
Similar articles
-
Countdown to 2015 country case studies: what have we learned about processes and progress towards MDGs 4 and 5?BMC Public Health. 2016 Sep 12;16 Suppl 2(Suppl 2):794. doi: 10.1186/s12889-016-3401-6. BMC Public Health. 2016. PMID: 27633919 Free PMC article.
-
Countdown to 2015: changes in official development assistance to reproductive, maternal, newborn, and child health, and assessment of progress between 2003 and 2012.Lancet Glob Health. 2015 Jul;3(7):e410-21. doi: 10.1016/S2214-109X(15)00057-1. Lancet Glob Health. 2015. PMID: 26087987
-
Past, present, and future of global health financing: a review of development assistance, government, out-of-pocket, and other private spending on health for 195 countries, 1995-2050.Lancet. 2019 Jun 1;393(10187):2233-2260. doi: 10.1016/S0140-6736(19)30841-4. Epub 2019 Apr 25. Lancet. 2019. PMID: 31030984 Free PMC article.
-
Tracking development assistance for health and for COVID-19: a review of development assistance, government, out-of-pocket, and other private spending on health for 204 countries and territories, 1990-2050.Lancet. 2021 Oct 9;398(10308):1317-1343. doi: 10.1016/S0140-6736(21)01258-7. Epub 2021 Sep 22. Lancet. 2021. PMID: 34562388 Free PMC article. Review.
-
Countdown to 2030: tracking progress towards universal coverage for reproductive, maternal, newborn, and child health.Lancet. 2018 Apr 14;391(10129):1538-1548. doi: 10.1016/S0140-6736(18)30104-1. Epub 2018 Jan 31. Lancet. 2018. PMID: 29395268 Review.
Cited by
-
How equitable is health spending on curative services and institutional delivery in Malawi? Evidence from a quasi-longitudinal benefit incidence analysis.Int J Equity Health. 2022 Feb 18;21(1):25. doi: 10.1186/s12939-022-01624-5. Int J Equity Health. 2022. PMID: 35180861 Free PMC article.
-
How Ethiopia achieved Millennium Development Goal 4 through multisectoral interventions: a Countdown to 2015 case study.Lancet Glob Health. 2017 Nov;5(11):e1142-e1151. doi: 10.1016/S2214-109X(17)30331-5. Lancet Glob Health. 2017. PMID: 29025635 Free PMC article.
-
Countdown to 2015 country case studies: what have we learned about processes and progress towards MDGs 4 and 5?BMC Public Health. 2016 Sep 12;16 Suppl 2(Suppl 2):794. doi: 10.1186/s12889-016-3401-6. BMC Public Health. 2016. PMID: 27633919 Free PMC article.
-
Falling aid for reproductive, maternal, newborn and child health in the lead-up to the COVID-19 pandemic.BMJ Glob Health. 2021 Jun;6(6):e006089. doi: 10.1136/bmjgh-2021-006089. BMJ Glob Health. 2021. PMID: 34108147 Free PMC article. No abstract available.
-
Using the World Health Organization health system building blocks through survey of healthcare professionals to determine the performance of public healthcare facilities.Arch Public Health. 2017 Aug 31;75:50. doi: 10.1186/s13690-017-0221-9. eCollection 2017. Arch Public Health. 2017. PMID: 29075485 Free PMC article.
References
-
- The World Bank: World DataBank. World Development Indicators, Macroeconomic data on Afghanistan, Ethiopia, Malawi, Peru, Pakistan, and Tanzania. In. http://databank.worldbank.org/data/reports.aspx?source=world-development.... (Accessed April 2015).
-
- United Nations: The Millennium Development Goals Report 2005. In. http://unstats.un.org/unsd/mi/pdf/mdg%20book.pdf (Accessed Apr 2015).
-
- International Institute for Sustainable Development (IISD): MDG Summit Bulletin, A report of the High-level Plenary Meeting of the 65th Session of the UN General Assembly on the Millennium Development Goals (MDGs). Final Issue 2010, 153(9). In. http://www.iisd.ca/download/pdf/sd/ymbvol153num9e.pdf. (Accessed Dec 2015).
-
- Rajkumar AS, Swaroop V. Public spending and outcomes: Does governance matter? J Dev Econ. 2008;86(1):96–111. doi: 10.1016/j.jdeveco.2007.08.003. - DOI
MeSH terms
LinkOut - more resources
Full Text Sources
Other Literature Sources
Medical
