. 2016 Sep 13:5:e16970.
doi: 10.7554/eLife.16970.

A computational approach to map nucleosome positions and alternative chromatin states with base pair resolution

Affiliations

A computational approach to map nucleosome positions and alternative chromatin states with base pair resolution

Xu Zhou et al. Elife. .

Abstract

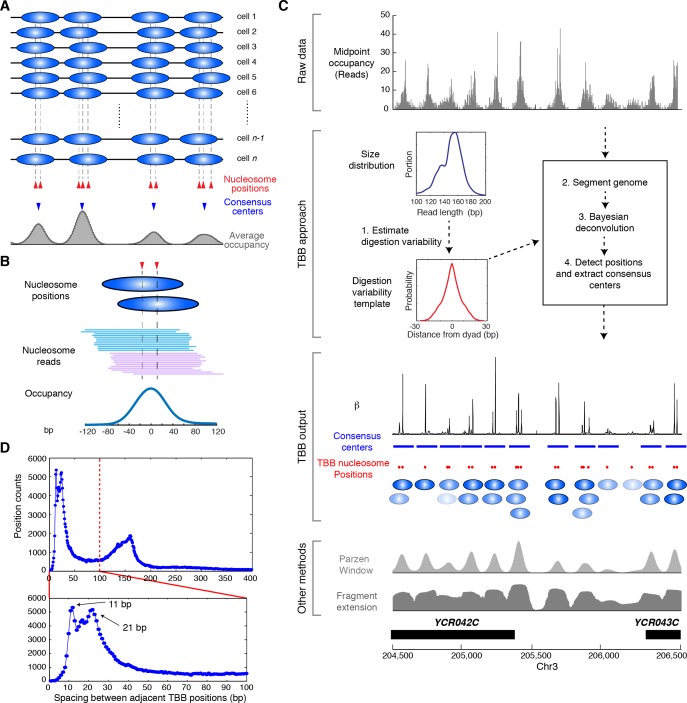
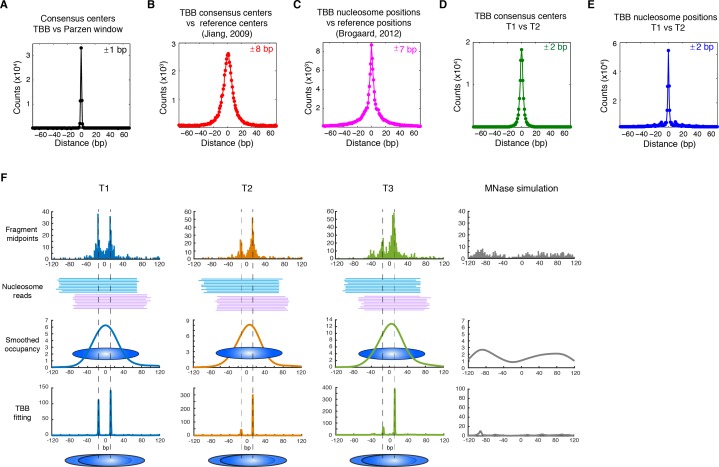
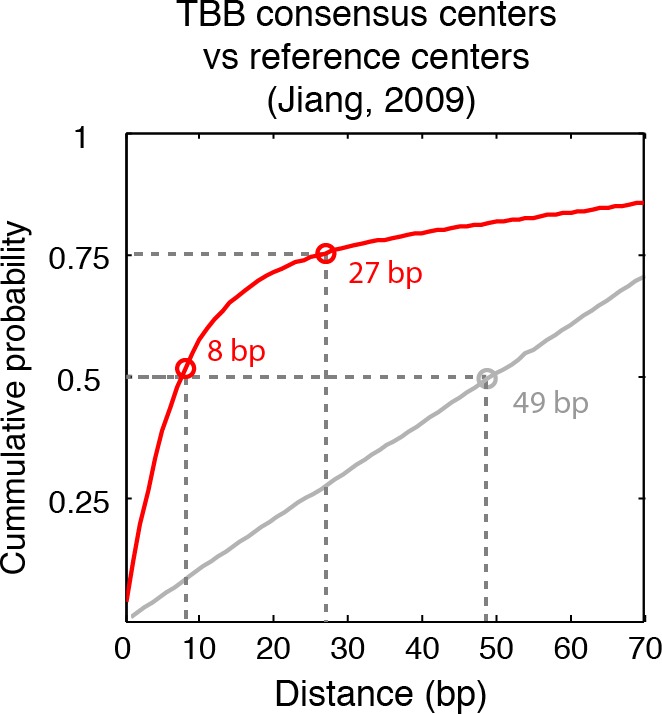
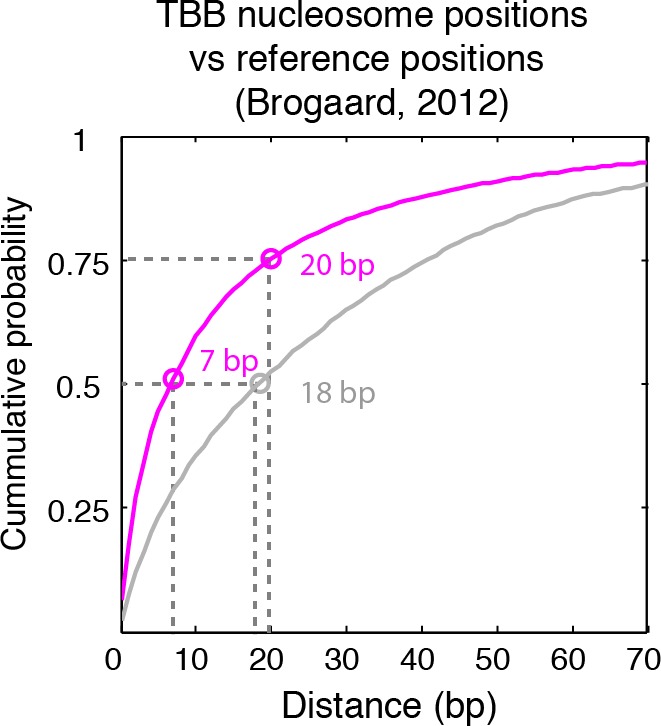
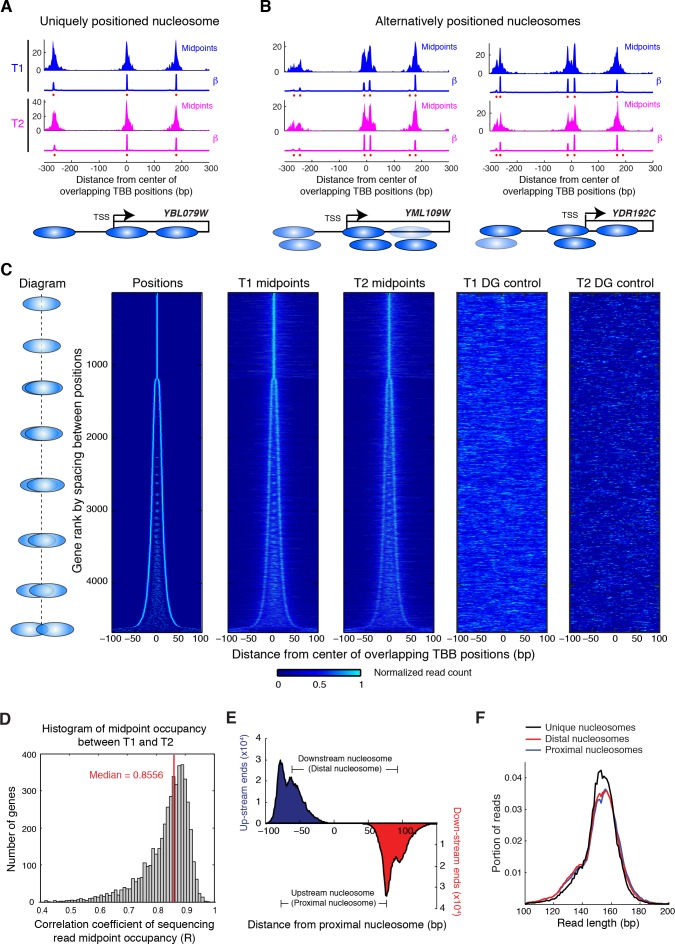
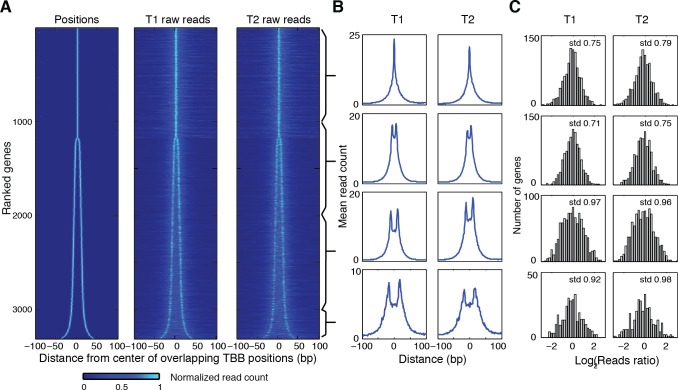
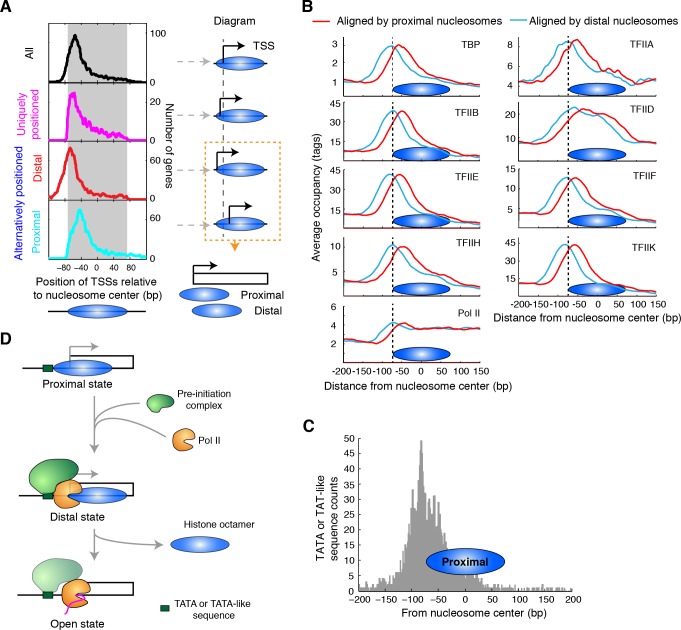
Understanding chromatin function requires knowing the precise location of nucleosomes. MNase-seq methods have been widely applied to characterize nucleosome organization in vivo, but generally lack the accuracy to determine the precise nucleosome positions. Here we develop a computational approach leveraging digestion variability to determine nucleosome positions at a base-pair resolution from MNase-seq data. We generate a variability template as a simple error model for how MNase digestion affects the mapping of individual nucleosomes. Applied to both yeast and human cells, this analysis reveals that alternatively positioned nucleosomes are prevalent and create significant heterogeneity in a cell population. We show that the periodic occurrences of dinucleotide sequences relative to nucleosome dyads can be directly determined from genome-wide nucleosome positions from MNase-seq. Alternatively positioned nucleosomes near transcription start sites likely represent different states of promoter nucleosomes during transcription initiation. Our method can be applied to map nucleosome positions in diverse organisms at base-pair resolution.

Keywords: MNase-seq; S. cerevisiae; base-pair resolution; computational biology; evolutionary biology; gene regulation; genomics; heterogenity; human; nucleosome position; systems biology; template-based model.


Conflict of interest statement

EKO: President at the Howard Hughes Medical Institute, one of the three founding funders of eLife. The other authors declare that no competing interests exist.

Figures

Figure 1.
Figure 1.. Illustration of the Template-Based Bayesian (TBB) approach for determining nucleosome positions.
(A) Diagram illustrating the heterogeneous nucleosome positions and the consensus centers of nucleosomes along a genomic region in a population of cells. Blue ovals illustrate individual nucleosomes and dotted lines mark all nucleosome positions. (B) Example of digested nucleosome reads, their nucleosome positions and the overall occupancy. (C) Illustration of the computational pipeline of the TBB approach. Occupancy of sequencing read midpoints indicates the number of midpoints at every base pair for yeast Chr 8, 204, 500–206,500 bp. Blue ovals illustrate overlapping TBB nucleosome positions and are colored according to the magnitude of their coefficients β. Two common presentations of nucleosome sequencing data are shown for comparison: the light gray area represents the nucleosome occupancy generated by smoothing sequencing read midpoints with a Parzen window approach (band size of 20 bp) (Albert et al., 2007; Tsankov et al., 2010); the dark gray area (Fragment extension) represents the nucleosome occupancy generated by extending 73 bp on both ends from the sequencing read midpoints. (D) Histogram showing the distance between adjacent TBB nucleosome positions in a combination of the T1 and T2 experiments. DOI: http://dx.doi.org/10.7554/eLife.16970.003
Figure 1—figure supplement 1.
Figure 1—figure supplement 1.. Diagrams of nucleosome digestion variability template estimation.
Diagrams illustrating the estimation of the nucleosome digestion variability template from the length distribution of paired-end sequencing reads. The length of a sequenced DNA fragment is decomposed into the sum of the length of the nucleosome core (147 bp) and the digestion errors (ε1, ε2) on both ends. Assuming that ε1 and ε2 are sampled randomly from a distribution of the digestion error (ε), the digestion error ε can be then estimated from the length distribution extracted from paired-end sequencing data, and is used to infer the nucleosome digestion variability template around a true nucleosome center. DOI: http://dx.doi.org/10.7554/eLife.16970.004
Figure 1—figure supplement 2.
Figure 1—figure supplement 2.. Length distribution of nucleosome reads.
Plots showing the length distribution of paired-end sequencing reads within gene coding regions and non-coding regions (left), and in the promoters of genes and non-promoter regions (right). DOI: http://dx.doi.org/10.7554/eLife.16970.005
Figure 2.
Figure 2.. Genome-wide evaluation of the TBB approach and alternative nucleosome positions.
Histogram of the nearest distance: (A) between the consensus centers of nucleosomes determined by the TBB approach and by the Parzen window approach; (B) between the consensus centers determined by the TBB approach and the reference MNase nucleosome positions (Jiang and Pugh, 2009a); (C) between the TBB nucleosome positions and the nucleosome positions mapped by the chemical approach (Brogaard et al., 2012); (D,E) between the consensus centers of nucleosomes (D) and the TBB nucleosome positions (E) mapped in two independent experiments. The median of the distance between matched consensus centers or TBB nucleosome positions is reported for each comparison. (F) Example of stable TBB positions that are tolerant to MNase digestion, chr 8, 341651 – 341771. Randomly selected reads fragments are shown to represent the locations of sequenced tags. DOI: http://dx.doi.org/10.7554/eLife.16970.006
Figure 2—figure supplement 1.
Figure 2—figure supplement 1.. Titration of MNase digestion.
(AC) Titration of MNase digestion for obtaining mononucleosomes. T0, T1, T2 and T3 correspond to MNase digestion with 0.5U, 1U, 2U and 4U MNase. (A) Bioanalyzer analysis of purified nucleosomal DNA after MNase digestion. The mononucleosome fractions of the second and third samples were isolated for paired-end sequencing, termed 'T1' and 'T2', respectively. (B) Quantification of the molar fraction of mono-, di- and tri-nucleosomal DNA for the samples in (A). (C) Read length distribution of all digested samples with fragment length over 100 bp. DOI: http://dx.doi.org/10.7554/eLife.16970.007
Figure 2—figure supplement 2.
Figure 2—figure supplement 2.. Cumulative distribution of the nearest distance analysis in Figure 2A.
Cumulative distribution of the nearest distance between the consensus centers of nucleosomes determined by the TBB approach and by the Parzen window approach. Circles mark the distance that matches 50% and 75% in the cumulative probability distribution. DOI: http://dx.doi.org/10.7554/eLife.16970.008
Figure 2—figure supplement 3.
Figure 2—figure supplement 3.. Cumulative distribution of the nearest distance analysis in Figure 2B.
Red traces and gray traces show the cumulative distribution of the nearest distance between the consensus centers determined by the TBB approach (red) or randomly generated consensus centers (gray) and the reference MNase nucleosome positions (Jiang and Pugh, 2009a). Circles mark the distance that matches 50% and 75% in the cumulative probability distribution. DOI: http://dx.doi.org/10.7554/eLife.16970.009
Figure 2—figure supplement 4.
Figure 2—figure supplement 4.. Cumulative distribution of the nearest distance analysis in Figure 2C.
Magenta traces and gray traces show the cumulative distribution of the nearest distance between the TBB nucleosome positions (magenta) or randomly generated nucleosome positions (gray) and the nucleosome positions mapped by the chemical approach (Brogaard et al., 2012). Circles mark the distance that matches 50% and 75% in the cumulative probability distribution. DOI: http://dx.doi.org/10.7554/eLife.16970.010
Figure 2—figure supplement 5.
Figure 2—figure supplement 5.. Cumulative distribution of the nearest distance analysis in Figure 2D.
Green traces and gray traces show the cumulative distribution of the nearest distance between between the TBB consensus centers (green) or randomly generated consensus centers (gray) mapped in two independent experiments. Circles mark the distance that matches 50% and 75% in the cumulative probability distribution. DOI: http://dx.doi.org/10.7554/eLife.16970.011
Figure 2—figure supplement 6.
Figure 2—figure supplement 6.. Cumulative distribution of the nearest distance analysis in Figure 2E.
Blue traces and gray traces show the cumulative distribution of the nearest distance between between the TBB nucleosome positions (Blue) or randomly generated nucleosome positions (gray) mapped in two independent experiments. Circles mark the distance that matches 50% and 75% in the cumulative probability distribution. DOI: http://dx.doi.org/10.7554/eLife.16970.012
Figure 3.
Figure 3.. Nucleosome detection from in silico MNase-seq datasets.
(A) Plots summarizing the distance between the detected TBB nucleosome positions in the in silico datasets and the nearest simulated primary and alternative nucleosome positions. ('C', total sequencing coverage of all overlapping nucleosomes; 'E', the effective magnitude (relative occupancy of neighboring nucleosomes); and 'O', the offset (spacing between nearby nucleosome positions). (B) Examples of nucleosome detection in the simulation at different coverage, effective magnitude and offset (different values are highlighted in red). Sequencing read midpoints (gray) were distributed randomly around the simulated nucleosome positions (blue dots) according to the digestion variability template. The coefficients (blue trace) and nucleosome positions (red dots) determined by the TBB approach are shown for comparison. DOI: http://dx.doi.org/10.7554/eLife.16970.013
Figure 4.
Figure 4.. Dinucleotides frequency of nucleosome positions.
(A–C) Normalized frequency of AA/AT/TA/TT and CC/CG/GC/GG dinucleotides of DNA sequences aligned at the centers of nucleosomes, for all TBB nucleosome positions in yeast, both before (A) and after (C) correction for MNase digestion bias, and for all TBB nucleosome positions on human chromosome 12, position 38,000,000 bp to 48,000,000 bp, a 10 Mbp region randomly chosen in the human genome (B). (D) The frequency of AA/AT/TA/TT for 62,035 randomly selected TBB nucleosome positions (blue trace), and for genome locations with an average distance of either 2 bp (orange trace) or 5 bp (black trace) from these selected TBB nucleosome positions. The distance was randomly perturbed by between 0–4 bp or 0–10 bp for each nucleosome positions, respectively. DOI: http://dx.doi.org/10.7554/eLife.16970.014
Figure 4—figure supplement 1.
Figure 4—figure supplement 1.. Dinucleotides frequency of nucleosome consensus centers.
(left) Dinucleotide frequency for all 62,035 consensus centers of nucleosomes identified in experiment T1. (right) Dinucleotide frequency for all consensus centers of nucleosomes identified on human chromosome 12, position 38,000,000 bp to 48,000,000 bp. DOI: http://dx.doi.org/10.7554/eLife.16970.015
Figure 4—figure supplement 2.
Figure 4—figure supplement 2.. Dinucleotides frequency of selected 147 bp nucleosome reads.
(left) Dinucleotide frequency for 62,035 randomly selected sequence fragments that are exactly 147 bp in length in experiment T1. (right) Dinucleotide frequency for all human nucleosome reads that are exactly 147 bp in length. DOI: http://dx.doi.org/10.7554/eLife.16970.016
Figure 4—figure supplement 3.
Figure 4—figure supplement 3.. Dinucleotides frequency of TBB positions.
Dinucleotide frequency for 62,035 (the same number as consensus centers) randomly selected TBB nucleosome positions from experiment T1. DOI: http://dx.doi.org/10.7554/eLife.16970.017
Figure 4—figure supplement 4.
Figure 4—figure supplement 4.. MNase-digestion correction for dinucleotides frequency of TBB positions.
Dinucleotide frequency for TBB positions from experiment T1(blue, pink) and the nucleosome positions determined from the simulated MNase digestion data set (gray). DOI: http://dx.doi.org/10.7554/eLife.16970.018
Figure 5.
Figure 5.. Alternatively positioned nucleosomes at transcription start sites.
(A,B) Examples of a uniquely positioned nucleosome (A), and alternatively positioned nucleosomes at the TSS (B). Blue and magenta traces show the sequencing read midpoint occupancy and fitted coefficient β from experiments ‘T1’ and ‘T2’, respectively. Ovals indicate the TBB nucleosome positions and are colored based on coefficients β. (C) Heat map showing the TBB nucleosome positions ('Positions'), the occupancy of read midpoints from two experiments (T1 and T2), and the occupancy of read midpoints from the two MNase bias simulations ('T1 DG control' and 'T2 DG control'). All data are aligned by the centers of selected unique or alternative nucleosome positions (essentially the consensus center of +1 nucleosomes) that overlap with the transcription start site (TSS) (4672 open reading frame in total). The order of transcripts is ranked by the maximum space between TBB nucleosome positions within each group, as illustrated by the diagrams on the left. The positive direction of the x-axis indicates 5’ to 3’ for all transcripts. (D) Correlation coefficient of the sequencing read midpoint occupancy (un-smoothed) in experiment T1 and T2 for each gene in panel C. (E) Graph showing the end location of paired-end sequencing reads of the upstream and downstream nucleosomes in panel C (later defined as the proximal and distal nucleosomes, respectively). The ends are aligned at the position of upstream nucleosomes (proximal nucleosomes). (F) Length distribution of paired-end sequencing reads in the unique, proximal and distal nucleosomes at gene promoters. In both (E) and (F), if the midpoint of a sequencing read is within 5 bp of the position of a nucleosome, it is counted as a read of this nucleosome. DOI: http://dx.doi.org/10.7554/eLife.16970.019
Figure 5—figure supplement 1.
Figure 5—figure supplement 1.. Reads occupancy between alternatively positioned nucleosomes.
Bar graphs showing the ratios of the reads corresponding to alternatively positioned nucleosomes. The genes are the same as the panels in Figure 5C from the top to the bottom. Numbers on top of each panel indicate their ranks in Figure 5C. The ratios of the reads were calculated by dividing the total number of sequencing read midpoints 60 bp to the left of the group center by the total number of sequencing read midpoints 60 bp to the right of the group center, and were binned on a log2 scale. The standard deviation of the read ratios on a log2 scale (std) is labeled in the top right corner for each graph. DOI: http://dx.doi.org/10.7554/eLife.16970.021
Figure 5—figure supplement 2.
Figure 5—figure supplement 2.. Heat map showing the TBB nucleosome positions and the midpoint read occupancy.
(A) Heatmaps are the same as Figure 5C, except that the position clusters with more than 2 positions are excluded. (B) Plots show the average midpoint occupancy of genes in groups of 1000. (C) Bar graphs are the same as Figure 5—figure supplement 1, except that the clusters with more than 2 positions are excluded. DOI: http://dx.doi.org/10.7554/eLife.16970.022
Figure 6.
Figure 6.. Alternatively positioned nucleosomes and transcription pre-initiation complex.
(A) Plots (left) showing the locations of TSSs relative to the average centers of all overlapping TBB nucleosome positions shown in Figure 3C ('All', black) to uniquely positioned nucleosomes (magenta) and to the distally (red) and proximally (cyan) positioned nucleosomes. The gray area marks the region covered by the nucleosome core. The cartoon diagrams on the right illustrate the location of the TSS relative to the nucleosome dyad. (B) Area showing the average occupancy of subunits of the pre-initiation complex (TBP, TFIIA, TFIIB, TFIID, TFIIE, TFIIF, TFIIH, TFIIK and RNA polymerase II (Pol II); determined by ChIP-exo) (Rhee and Pugh, 2012) aligned at the center of the proximal (cyan) and the distal nucleosomes (red), determined by the TBB approach. (C) Bar graph showing the distribution of TATA box and TATA-like sequences of all genes (Rhee and Pugh, 2012) aligned at the dyad of the proximal nucleosomes. (D) Illustration of the 3-step model for transcription initiation mediated by alternatively positioned nucleosomes. DOI: http://dx.doi.org/10.7554/eLife.16970.023
Figure 7.
Figure 7.. Sequence features of uniquely and alternatively positioned nucleosomes.
(A) Plots showing the frequency of AA/AT/TA/TT and CC/CG/GC/GG dinucleotides of DNA sequences aligned at the TBB nucleosome positions of either unique, proximal or distal nucleosomes at gene promoters (illustrated by the diagrams). (B) Plots showing the normalized dinucleotide frequency (smoothed with a 3 bp window) of DNA sequences aligned at unique nucleosomes, alternative nucleosomes (proximal + distal) at gene promoters or all TBB nucleosome positions, and the autocorrelation analysis (performed in MATLAB) of the dinucleotide frequency within nucleosome core (−73–73 bp). (C,D) Plots showing the frequency of poly(dA:dT)6 sequences aligned at unique nucleosomes or the average centers of alternatively positioned nucleosomes. The positive direction of the x-axis indicates 5’ to 3’ for all transcripts. Black arrows mark the enriched poly(dA:dT)6 signals. Overall, 1172 genes contain unique nucleosomes and 3469 genes contain proximal and distal nucleosomes at their promoters. Gray traces present the analysis for a random permutation control of selected promoters and the location of nucleosome positions (A,C,D). The number of these random locations matches the number of nucleosomes in each plot. DOI: http://dx.doi.org/10.7554/eLife.16970.025
Author response image 1.
Author response image 1.. Cumulative distribution of the nearest distance analysis for TBB positions around gene TSSs.
The curves show the cumulative distribution of the nearest distance between the TBB nucleosome positions at gene TSSs analyzed for Figure 5C and the nucleosome positions mapped by the chemical approach. Uniquely positioned nucleosomes and alternatively positioned nucleosomes (both distal and proximal nucleosomes) are analyzed separately. DOI: http://dx.doi.org/10.7554/eLife.16970.029
Author response image 2.
Author response image 2.. Significance of the enrichment in uniquely positioned nucleosomes among genes stratified by expression level determined in Newman et al.
DOI: http://dx.doi.org/10.7554/eLife.16970.030
Author response image 3.
Author response image 3.. Significance of the enrichment in uniquely positioned nucleosomes among genes stratified by expression level determined in Zid et al.
DOI: http://dx.doi.org/10.7554/eLife.16970.031

Similar articles

Cited by

References

    1. Albert I, Mavrich TN, Tomsho LP, Qi J, Zanton SJ, Schuster SC, Pugh BF. Translational and rotational settings of H2A.Z nucleosomes across the Saccharomyces cerevisiae genome. Nature. 2007;446:572–576. doi: 10.1038/nature05632. - DOI - PubMed
    1. Albert I, Wachi S, Jiang C, Pugh BF. GeneTrack--a genomic data processing and visualization framework. Bioinformatics. 2008;24:1305–1306. doi: 10.1093/bioinformatics/btn119. - DOI - PMC - PubMed
    1. Andrews AJ, Luger K. Nucleosome structure(s) and stability: variations on a theme. Annual Review of Biophysics. 2011;40:99–117. doi: 10.1146/annurev-biophys-042910-155329. - DOI - PubMed
    1. Betzig E, Patterson GH, Sougrat R, Lindwasser OW, Olenych S, Bonifacino JS, Davidson MW, Lippincott-Schwartz J, Hess HF. Imaging intracellular fluorescent proteins at nanometer resolution. Science. 2006;313:1642–1645. doi: 10.1126/science.1127344. - DOI - PubMed
    1. Blocker AW, Airoldi EM. Template-based models for genome-wide analysis of next-generation sequencing data at base-pair resolution. Journal of the American Statistical Association. 2016:1–68. doi: 10.1080/01621459.2016.1141095. - DOI - PubMed