. 2016 Dec 1;19(6):709-724.
doi: 10.1016/j.stem.2016.08.002. Epub 2016 Sep 8.

Functional Impairment in Miro Degradation and Mitophagy Is a Shared Feature in Familial and Sporadic Parkinson's Disease

Affiliations

Functional Impairment in Miro Degradation and Mitophagy Is a Shared Feature in Familial and Sporadic Parkinson's Disease

Chung-Han Hsieh et al. Cell Stem Cell. .

Abstract

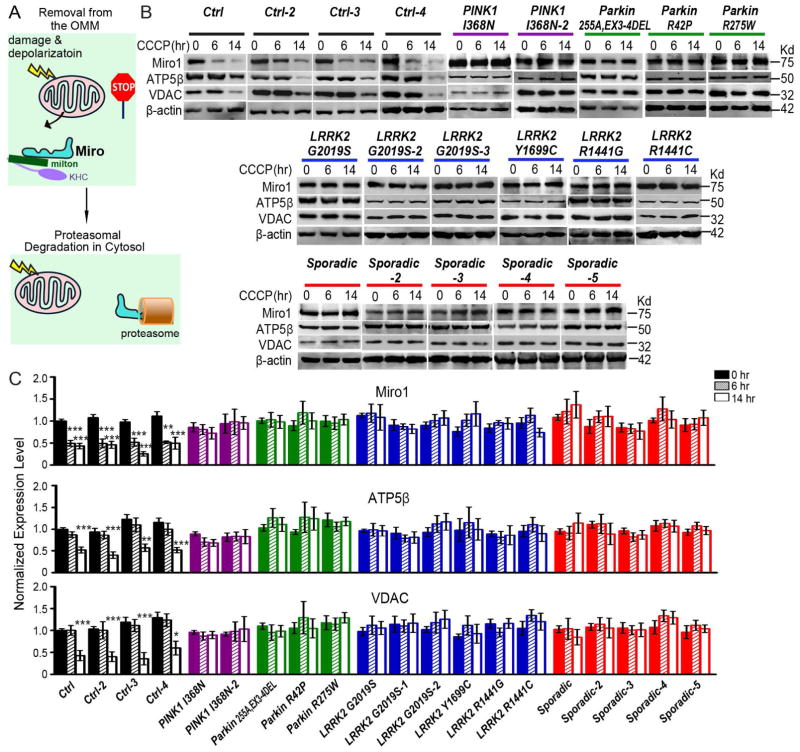
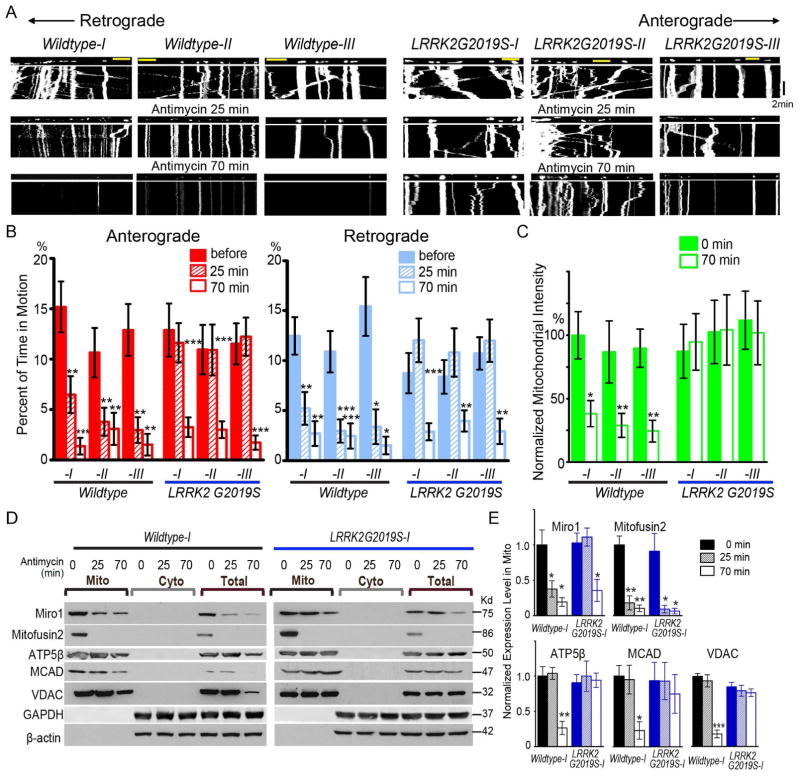
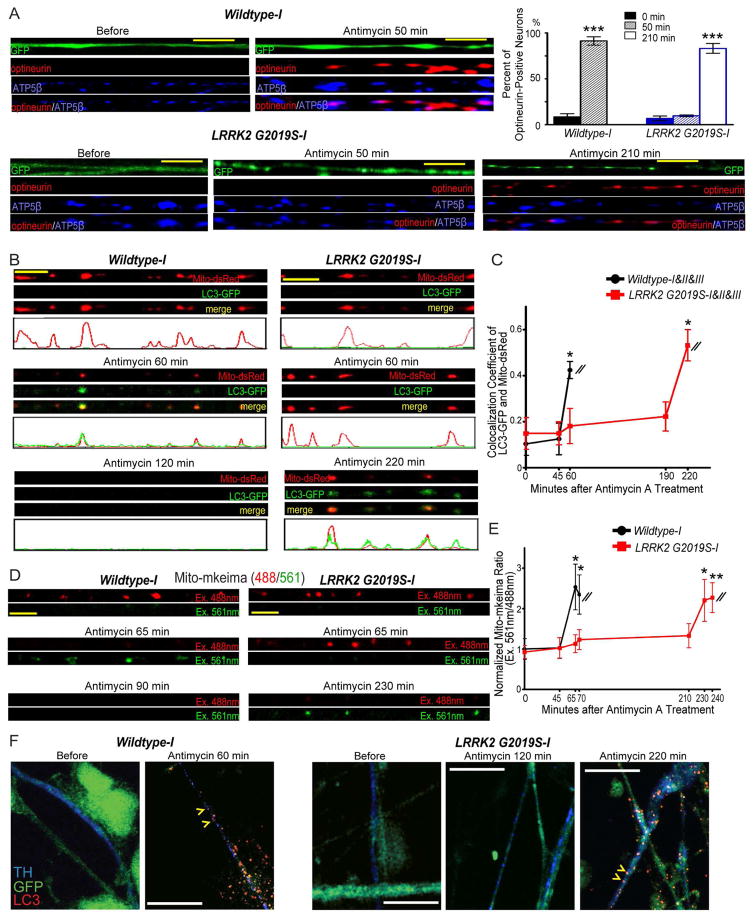
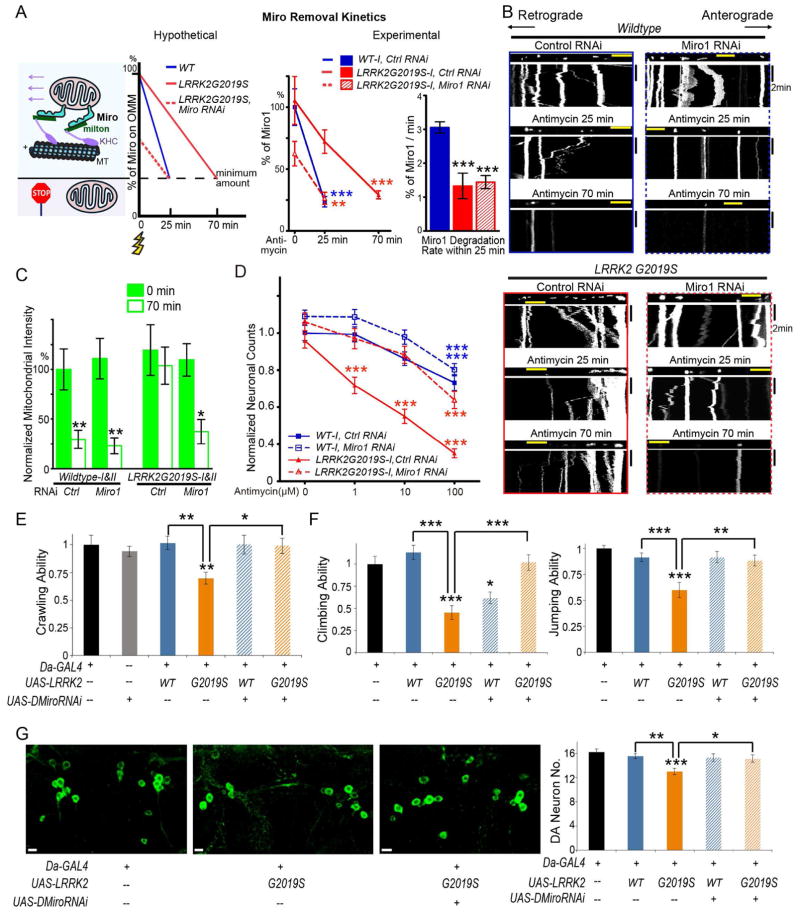
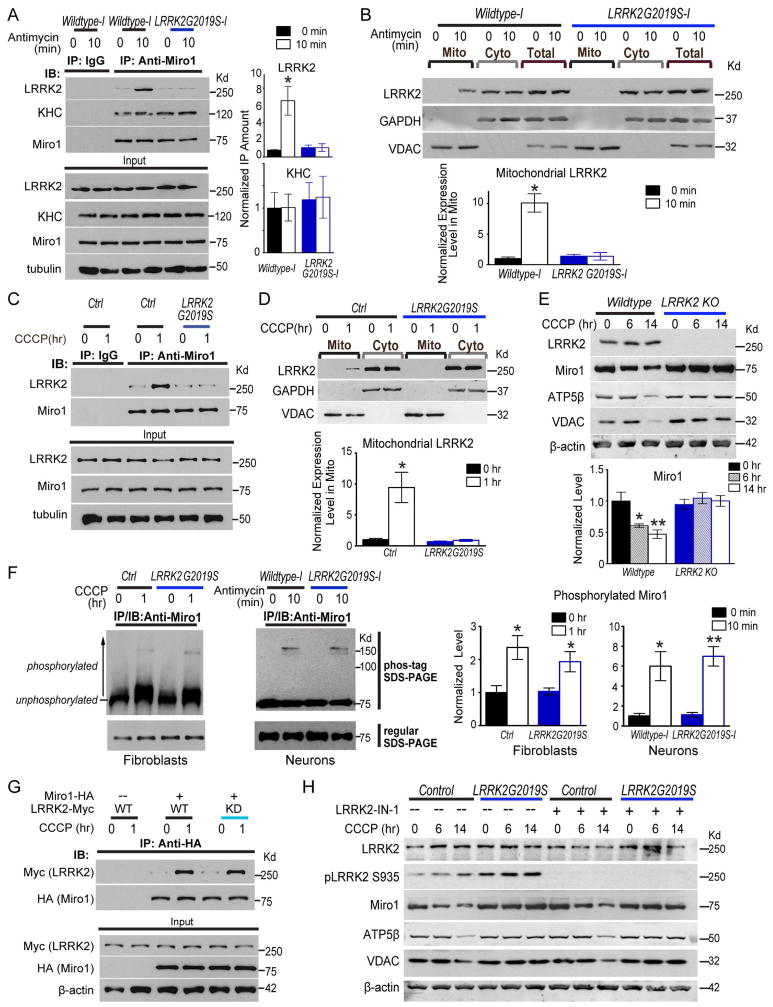
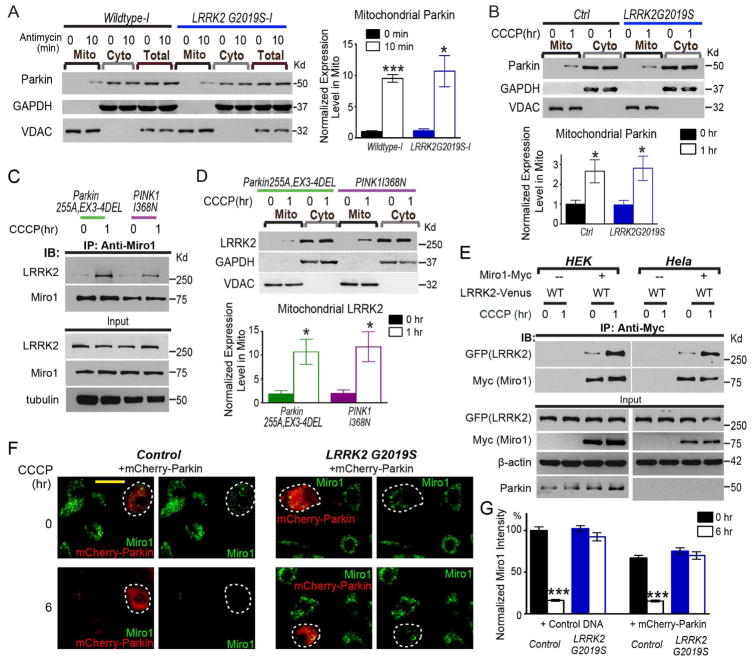
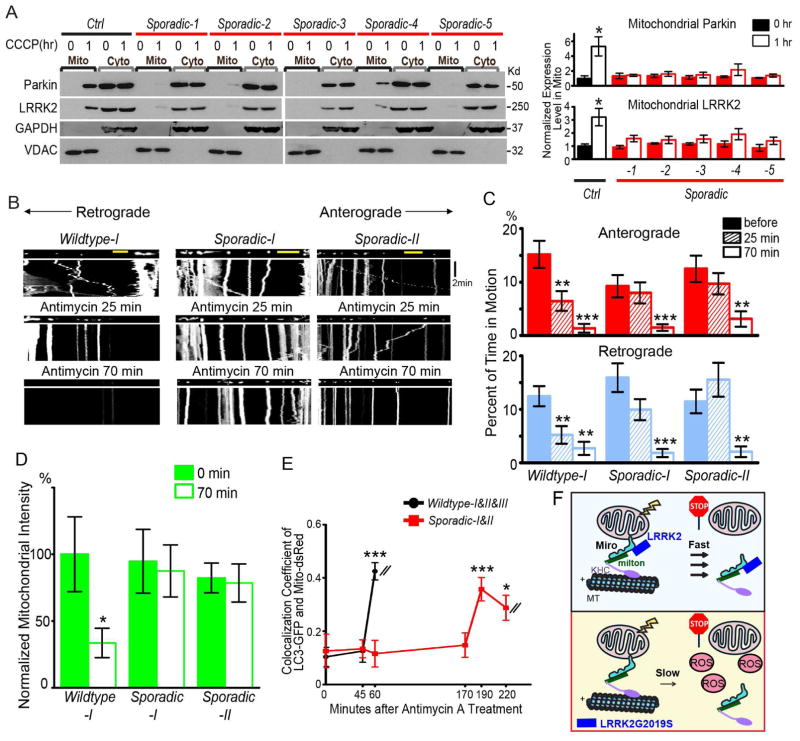
Mitochondrial movements are tightly controlled to maintain energy homeostasis and prevent oxidative stress. Miro is an outer mitochondrial membrane protein that anchors mitochondria to microtubule motors and is removed to stop mitochondrial motility as an early step in the clearance of dysfunctional mitochondria. Here, using human induced pluripotent stem cell (iPSC)-derived neurons and other complementary models, we build on a previous connection of Parkinson's disease (PD)-linked PINK1 and Parkin to Miro by showing that a third PD-related protein, LRRK2, promotes Miro removal by forming a complex with Miro. Pathogenic LRRK2G2019S disrupts this function, delaying the arrest of damaged mitochondria and consequently slowing the initiation of mitophagy. Remarkably, partial reduction of Miro levels in LRRK2G2019S human neuron and Drosophila PD models rescues neurodegeneration. Miro degradation and mitochondrial motility are also impaired in sporadic PD patients. We reveal that prolonged retention of Miro, and the downstream consequences that ensue, may constitute a central component of PD pathogenesis.


Figures

Figure 1
Figure 1. Miro Is Resistant to Degradation in PD Patients
(A) Schematic representation of Miro removal from the OMM of damaged mitochondria causing mitochondrial arrest prior to proteasomal degradation of Miro. KHC, kinesin heavy chain. Milton, a mitochondrial adaptor linking Miro to KHC. (B) Fibroblasts from PD patients and healthy controls were incubated with 40 μM CCCP prior to being lysed. Immunoblots of lysates were probed with antibodies as indicated. (C) The intensity of each band is normalized to the loading control Actin, and expressed as a fraction of the mean of “Control, 0 hr”. “Control” was included in every independent experiment. n=4–27 independent experiments. Fluorescent western blotting was performed to ensure the linear correlation between protein levels and band intensities. The band intensities of Actin are not significantly different among all genotypes and conditions (P=0.1470). * P<0.05, ** P<0.01, *** P<0.001, and error bars represent mean±S.E.M. here and for all figures unless otherwise stated. See also Figures S1–S2.
Figure 2
Figure 2. LRRK2G2019S Delays Mitochondrial Arrest and Clearance in IPSC-Derived Axons
(A) Mitochondrial movement in representative axons transfected with mito-dsRed before and after treatment with 100 μM Antimycin A. The first frame of each live-imaging series is shown above a kymograph generated from the movie. The x-axis is mitochondrial position and the y-axis corresponds to time (moving from top to bottom). Vertical white lines represent stationary mitochondria and diagonal lines are moving mitochondria. Scale bars: 10 μm. (B) From kymographs as in (A), the percent of time each mitochondrion is in motion is determined and averaged. Comparisons with “Wildtype-I, before treatment”. n=30–110 mitochondria from 8 axons from 8 separate transfections per genotype. (C) The mitochondrial intensity normalized to that of the same axonal region at “0 min” is expressed as a percent of the mean of “Wildtype-I, 0 min”. Comparisons with “Wildtype-I, 0 min”. n=8 axons per genotype. (D) The Mitochondrial (Mito) and cytosolic (Cyto) fractions were purified from iPSC-derived neurons with 100 μM Antimycin A treatment and blotted with antibodies indicated. Loading ratio is 2:1:1 for “Mito:Cyto:Total”. (E) Quantification of the band intensities as in (D), of ATP5β, MCAD, VDAC, Miro1, or Mitofusion2 in the mitochondrial fraction. Their band intensities are normalized to those of Actin in “Total”, and then expressed as a fraction of the mean of “Wildtype-I, 0 min”. n=3 independent experiments. The band intensities of Actin are not significantly different among all genotypes and conditions (P=0.9). See also Figures S2–S4, Table S1.
Figure 3
Figure 3. LRRK2G2019S Delays Mitophagy in IPSC-Derived Axons
(A) Neurons were transfected with GFP and immunostained as indicated. The percentage of optineurin-positive neurons is quantified. Comparisons with “Wildtype-I, 0 min”. n=186–241 neurons from 3 independent transfections. (B) Neurons were transfected with mito-dsRed and LC3-GFP. The intensity profile is generated using the ImageJ “Plot Profile” function. (C) Quantification of the colocalization coefficient (the correlation coefficient of the intensities in each color of each individual pixel) of LC3-GFP and mito-dsRed in each axon before and after Antimycin A treatment as shown in (B) using the ImageJ “colocalization” function. “1” represents complete colocalization and “0” represents no colocalization. The values of 8 axons of each line are averaged, and the mean values of three lines (Wildtype-I, II and III; LRRK2G2019S-I, II and III) are grouped. Comparisons with “Wildtype, 0 min”. (D) Neurons were transfected with mito-mkeima. 488 nm (red) excites neutral mitochondria, and 561 nm (green) excites acidic mitochondria. (E) Quantification of the fluorescent ratio as shown in (D), expressed as a fraction of the mean of “Wildtype-I, 0 min”. Comparisons with “Wildtype-I, 0 min”. n=8–9 axons from 8–9 independent transfections. (F) GFP-expressing neurons were treated with Antimycin A for the indicated time durations, and immunostained. Yellow arrowheads show LC3 puncta in TH-positive axons after treatment. In Wildtype neurons at 60 min after Antimycin A treatment LC3-positive axons accounted for 90.90% of total dopaminergic (n=11) and 89.47% of total non-dopaminergic axons (n=57); in LRRK2G2019S, LC3-positive dopaminergic and non-dopaminergic axons were 0% and 0% at 120 min after treatment, but increased to 100% (n=20) and 88.76% (n=89) at 220 min after treatment, respectively. For all panels, 100 μM Antimycin A was applied. Scale bars: 10 μm. See also Figures S2–S4.
Figure 4
Figure 4. Miro RNAi Rescues Phenotypes of LRRK2G2019S IPSC-Derived Neurons and Flies
(A) Schematic representation of Miro removal rates. The y-axis is the percent of total Miro protein levels on the OMM, and the x-axis is the time following depolarization (yellow flash sign). There is a hypothetical minimum amount of Miro on the OMM required for successfully anchoring mitochondria to motors and MT (microtubules) to enable movement. Note that the number of Miro protein on one mitochondrion drawn represents the relative protein amount rather than the actual number of the protein. In the experimental model, the Miro1 protein level is quantified in each condition using immunostaining as in Figure S5 expressed as a percentage of the mean of “Wildtype-I, control RNAi, 0 min”, or the degradation rate of Miro1 (%/min) is calculated within the first 25 min compared to “Wildtype-I, control RNAi”. n=93–151 neurons from 3 independent transfections. (B) Mitochondrial movement in representative axons transfected with mito-dsRed before and after treatment with 100 μM Antimycin A. The types of RNAi and genotypes are indicated. Quantification is in Figure S5C. (C) The normalized mitochondrial intensity is quantified as in Figure 2, expressed as a percent of the mean of “Wildtype, control RNAi, 0 min”. Comparisons with “Wildtype, control RNAi, 0 min”. n=10 axons from 10 separate transfections (pooled from Wildtype-I and II or from LRRK2G2019S-I and II). (D) Quantification of the number of surviving neurons as shown in Figure S6C. Each data point is from 60 fields from 3 independent transfections, expressed as a fraction of the mean of “Wildtype-I, control RNAi, 0 μM”. The densities of neurons before treatment were not significantly different among 4 genotypes (P=0.1071). (E) The crawling ability of third instar larvae with different genotypes is quantified, expressed as a fraction of the mean of the control “Da-GAL4”. n=17–30. (F) The climbing and jumping abilities of adult flies 20 days after eclosion are quantified, expressed as a fraction of the mean of “Da-GAL4”. n=44–60. (G) The PPM1/2 clusters of dopaminergic (DA) neurons visualized by anti-TH in adult brains 35 days after eclosion are shown. The number of DA neurons is quantified. n=11–20 brains. Comparisons with “Da-GAL4” unless otherwise indicated. Scale bars: (B) 10 μm; (G) 5 μm. See also Figures S5–S6, Table S2.
Figure 5
Figure 5. LRRK2G2019S Impairs Interaction with Miro on Damaged Mitochondria
(A, C, G) IPSC-derived neurons (A), fibroblasts (C) or HEK293T cells transfected with indicated constructs (G), were incubated with 100 μM Antimycin A or 40 μM CCCP prior to immunoprecipitation with anti-Miro1 or anti-HA. Co-immunoprecipitated LRRK2 or KHC represented in (A) is quantified by normalizing its band intensity to that of immunoprecipitated Miro1 from the same experiment, and expressed as a fraction of the mean of “Wildtype-I, 0 min”. n=3 independent experiments. For (C, G), representative results were repeated for at least three times. (B) Mito and Cyto fractions were purified from iPSC-derived neurons with 100 μM Antimycin A treatment and blotted with antibodies indicated. Loading ratio is 2:1:1 for “Mito:Cyto:Total”. The LRRK2 band intensity in Mito is quantified by normalizing it to that of the mitochondrial loading control VDAC, and expressed as a fraction of the mean of “Wildtype-I, 0 min”. n=3 independent experiments. (D) Mito and Cyto fractions were extracted from fibroblasts, loaded as 2:1, and blotted with antibodies indicated. Mitochondrial LRRK2 band intensity is normalized to that of VDAC, and expressed as a fraction of the mean of “Control, 0 hr”. n=3–5 independent experiments. (E) Wildtype isogenic control and LRRK2 knockout (KO) HAP cells were treated with CCCP, lysed, blotted as indicated, and quantified as in Figure 1. n=3 independent experiments. (F) Fibroblasts or iPSC-derived neurons were incubated with 40 μM CCCP or 100 μM Antimycin A prior to immunoprecipitation with anti-Miro1. The immunoprecipitates were run either in a regular SDS-PAGE, or in a phos-tag SDS-PAGE, and then blotted with anti-Miro1. For quantification, the intensity above 75Kd (shifted bands of phosphorylated Miro1) is divided by the total Miro1 intensity, expressed as a fraction of the mean of wildtype control without treatment. n=3 independent experiments. (H) Fibroblasts were treated with CCCP with or without LRRK2-IN-1, lysed, and blotted as indicated. n=3 independent experiments. Quantification is in Figure S7D. See also Figure S7.
Figure 6
Figure 6. The PINK1/Parkin Pathway and LRRK2 Function in Parallel
(A) Mito and Cyto fractions were purified from iPSC-derived neurons with 100 μM Antimycin A treatment and blotted with antibodies indicated. Loading ratio is 2:1:1 for “Mito:Cyto:Total”. The intensity of mitochondrial Parkin is normalized to that of VDAC, expressed as a fraction of the mean of “Wildtype-I, 0 min”. Comparisons with “Wildtype-I, 0 min”. n=3 independent experiments. (B, D) Mito and Cyto fractions (2:1 loading ratio) from fibroblasts were probed as indicated. The mitochondrial Parkin or LRRK2 band intensity normalized to that of VDAC, is quantified and expressed as a fraction of the mean of “Control, 0 hr” (in B or Figure 5D). n=3–5 independent experiments. (C) Fibroblasts from PD patients, or (E) HEK293T or Hela cells transfected with indicated constructs, were incubated with 40 μM CCCP prior to immunoprecipitation with anti-Miro1 or anti-Myc. Representative results were repeated for at least three times. (F) Fibroblasts were transfected with mCherry-Parkin, and immunostained with anti-Miro1. One mCherry-Parkin-transfected cell is labeled by a white-dashed circle, adjacent to a few untransfected cells in the same field. Note: at 6 hrs after CCCP treatment, mCherry-Parkin is cytosolic. Parkin recruitment to damaged mitochondria is an earlier step during mitophagy (Narendra et al., 2008), and it occurs at 1 hr after treatment in fibroblasts (B). Scale bar: 50 μm. (G) Quantification of the mean intensity of Miro1 in fibroblasts transfected with mCherry-Parkin or Control DNA (pcDNA3.1), expressed as a percentage of the mean of “Control, Control DNA, 0 hr”. Comparisons with “0 hr” within the same genotype. Overexpression of mCherry-Parkin mildly promoted Miro1 degradation at baseline without CCCP treatment (0 hr, P<0.001), probably because mCherry-Parkin had been expressed for 2 days before the cells were analyzed. n=143–151 cells from 3 independent transfections. See also Figure S7.
Figure 7
Figure 7. Mitochondrial Motility and Mitophagy Are Impaired in Sporadic Patients
(A) Mito and Cyto fractions (2:1 loading ratio) from fibroblasts were probed with antibodies indicated. The Mitochondrial Parkin or LRRK2 band intensity is normalized to that of VDAC, expressed as a fraction of the mean of “Control, 0 hr”. Comparisons with “Control, 0 hr”. n=3 independent experiments. (B–E) Mitochondrial motility (B–C), intensity (D), and LC3-GFP recruitment to mito-dsRed (E) are analyzed as in Figure 2–3. n=8 axons per line. For (E), the values of all axons are pooled (Wildtype: 24; Sporadic: 16). Comparisons with “Wildtype, 0 min/before treatment”. The same Wildtype values as in Figure 2–3 are used. (F) Schematic representation of the mechanism by which LRRK2G2019S slows Miro removal from damaged mitochondria. ROS: reactive oxygen species. Scale bars: 10 μm.

Comment in

Similar articles

Cited by

References

    1. Ashrafi G, Schlehe JS, LaVoie MJ, Schwarz TL. Mitophagy of damaged mitochondria occurs locally in distal neuronal axons and requires PINK1 and Parkin. The Journal of cell biology. 2014;206:655–670. - PMC - PubMed
    1. Ashrafi G, Schwarz TL. The pathways of mitophagy for quality control and clearance of mitochondria. Cell death and differentiation. 2013;20:31–42. - PMC - PubMed
    1. Berg D, Schweitzer KJ, Leitner P, Zimprich A, Lichtner P, Belcredi P, Brussel T, Schulte C, Maass S, Nagele T, et al. Type and frequency of mutations in the LRRK2 gene in familial and sporadic Parkinson’s disease*. Brain: a journal of neurology. 2005;128:3000–3011. - PubMed
    1. Bingol B, Tea JS, Phu L, Reichelt M, Bakalarski CE, Song Q, Foreman O, Kirkpatrick DS, Sheng M. The mitochondrial deubiquitinase USP30 opposes parkin-mediated mitophagy. Nature. 2014;510:370–375. - PubMed
    1. Bonifati V. Deciphering Parkinson’s disease--PARK8. The Lancet Neurology. 2002;1:83. - PubMed

MeSH terms