. 2016 Sep 8;166(6):1500-1511.e9.
doi: 10.1016/j.cell.2016.08.052.

A Distinct Gene Module for Dysfunction Uncoupled from Activation in Tumor-Infiltrating T Cells

Affiliations

A Distinct Gene Module for Dysfunction Uncoupled from Activation in Tumor-Infiltrating T Cells

Meromit Singer et al. Cell. .

Erratum in

Abstract

Reversing the dysfunctional T cell state that arises in cancer and chronic viral infections is the focus of therapeutic interventions; however, current therapies are effective in only some patients and some tumor types. To gain a deeper molecular understanding of the dysfunctional T cell state, we analyzed population and single-cell RNA profiles of CD8(+) tumor-infiltrating lymphocytes (TILs) and used genetic perturbations to identify a distinct gene module for T cell dysfunction that can be uncoupled from T cell activation. This distinct dysfunction module is downstream of intracellular metallothioneins that regulate zinc metabolism and can be identified at single-cell resolution. We further identify Gata-3, a zinc-finger transcription factor in the dysfunctional module, as a regulator of dysfunction, and we use CRISPR-Cas9 genome editing to show that it drives a dysfunctional phenotype in CD8(+) TILs. Our results open novel avenues for targeting dysfunctional T cell states while leaving activation programs intact.

Keywords: CD8; CRISPR/Cas9; Gata-3; T cell; TILs; cancer; dysfunction; exhaustion; metallothioneins; single-cell; tumor; zinc.


Figures

Figure 1
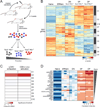
Figure 1. CD8+ T cell dysfunction and activation are transcriptionally intertwined
A) Outline of experimental strategy. CT26 colon carcinoma was used. B) Heatmap of the 3031 differentially expressed genes across the TILs subpopulations. Naïve: CD8+CD62LhiCD44low cells from non tumor-bearing Balb/c mice, EffMem: Effector memory CD8+CD62LlowCD44hi cells from non tumor-bearing Balb/c mice, DN: CD8+Tim3PD1, SP: CD8+Tim3PD1+, DP: CD8+Tim3+PD1+ TILs from CT26 colon carcinoma. C) Cluster 2 is significantly enriched with genes up-regulated in a CD8+ viral exhaustion signature (Doering et al., 2012) as well as an in vivo CD8+ activation signature (Sarkar et al., 2008). p-values determined by hypergeometric test. D) Heatmap of the top ranking genes from cluster 2. See also Suppl Fig 1 and Suppl tables 1 and 2.
Figure 2
Figure 2. Metallothionein deficiency improves anti-tumor immunity and reverses T cell dysfunction
(A–B). Mice deficient in both MT1 and MT2 (MT−/−) and wild type (WT) littermate controls were implanted subcutaneously with B16F10 melanoma. A) Mean tumor growth. Statistical analysis was performed using linear regression ***p-value < 0.001. B) Tumor draining Lymph node (dLN, upper panel) and tumor-infiltrating lymphocytes (TIL, lower panel) were isolated from WT and MT−/− mice 15 days post tumor inoculation and stimulated with tumor antigen gp100. On day 3, tumor antigen-specific proliferation was measured by 3H incorporation. C) Naïve OT-1 cells were sorted, activated, and infected with empty retrovirus (control OT1) or MT1 retrovirus (MT OT1) prior to transfer (1 ×10⁶ cells/mouse) into WT mice that were subsequently implanted with MC38-OVA tumor the next day. Mean tumor growth is shown. Statistical analysis was performed using linear regression **p-value < 0.01. D-E) MT−/− CD8+ TILs have increased functionality as compared to WT CD8+ TILs. TILs were isolated and stimulated with PMA/ionomyicin in the presence of brefeldin A for 4 hours prior to extracellular and intracellular staining and analysis by flow cytometry. *p-value < 0.05. F) Tim-3 and PD-1 expression in WT and MT−/− TILs. The DN, SP, and DP subpopulations are present in both the WT and MT−/− TILs. See also Suppl Fig 2.
Figure 3
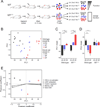
Figure 3. Transcriptional profiling of MT−/− enables uncoupling of activation and dysfunction in CD8+ TILs
A) Outline of experimental strategy. B16F10 melanoma was used. B) PCA analysis of WT and MT−/− DN, SP, and DP TILs populations. C and D) Bar plots for the means of the PC1 (C) and PC2 (D) values for the DN, SP, and DP subpopulations. Error bars are the standard error of the mean estimator. P-values for significance are computed using standard t-test. *p-value < 0.05, **p-value < 0.01. E) Correlations of PC1 and PC2 values with various signatures. PC1 shows strong positive correlation with an in vivo CD8+ activation signature (Sarkar et al., 2008), a CD8+ viral exhaustion signature (Doering et al., 2012) and our cluster 2 gene signature (Figure 1B), and strong negative correlation with a naïve CD8+ and a memory CD8+ signature (MSigDB (Subramanian et al., 2005), Methods and Resources). See also Suppl Fig 3 and Suppl table 3.
Figure 4
Figure 4. Identification of gene modules for T cell activation and dysfunction
A) Genes were projected onto both diagonal axes to determine a ranking of genes for their association with (1) Dysfunction (2) Activation (3) Both dysfunction and activation (4) Neither. B) The distribution of genes by their dysfunction and activation scores reveals genes associated to different extents with the dysfunction and/or activation gene modules. Co-inhibitory receptors reported to be associated with both activation and dysfunction transcriptional profiles (e.g. PD-1, CTLA4, Tim3, Lag3) are seen in the upper right corner. C) Enrichments of different signatures for the different modules of the activation/dysfunction plot. Dashed line marks p=0.05 significance threshold. D) Genes from an exhaustion and activation signature defined in a human melanoma study (Tirosh et al., 2016) separate on the Dysfunction <-> Activation axis we have defined (as shown in A). Shown is the distribution of genes on the Dysfunction / Activation plot (left) and the Kolmogorov-Smirnov plot of the values of the human signatures on the Dysfunction <-> Activation axis (Axis 1-2 in (A)) (KS p-value=0.027). See also Suppl table 4.
Figure 5
Figure 5. The dysfunction and activation transcriptional programs are negatively correlated at the single-cell level
A) Expression of the dysfunction module at the single-cell level is negatively correlated with expression of the activation module (left, r = −0.42) and of an in vivo CD8+ activation signature (Sarkar et al., 2008) (right, r= −0.47). B) Expression of an in vivo CD8+ activation signature at the single-cell level is positively correlated with expression of (left to right) the activation module (r=0.57), the activation/dysfunction module (r=0.79), a viral LCMV exhaustion signature (r=0.85) and the cluster 2 genes (Figure 1B) (r=0.68). C), D) and E) A tSNE visualization (van der Maaten, 2008) of the 1061 single-cells analyzed, colored by (C) the partitioning into 7 clusters (infomap), (D) gene signatures of the four gene modules defined (by quantile), and (E) mouse type (WT or MT−/−). F) Association of different gene signatures with the single-cell clusters (XL-mHG test, threshold at top 30% of list). Dashed line marks p=0.05 significance threshold. G) Counts of cells from WT / MT−/− in the different clusters. Clusters significantly enriched for presence of WT (blue) or MT−/− cells (red) are marked. *p-value < 0.05, **p-value < 0.01, *** p-value < 0.001 (hypergeometric test). See also Suppl Fig 4.
Figure 6
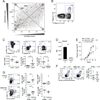
Figure 6. Gata3 drives the dysfunctional state in CD8+ T cells
A) Gata3, a zinc-binding TF, ranks first in the dysfunction module. B and C) WT mice were implanted subcutaneously with B16F10 melanoma cells. TILs were isolated on day 15 and analyzed for Gata3 expression and T cell function. B) Representative flow cytometry data showing Gata3 expression gated on CD8+ TILs. C) Cytokine expression of Gata3+ and Gata3CD8+ TILs. Statistical analysis was performed using paired student t test. *p-value < 0.05, *** p-value < 0.001. D) Targeted deletion of Gata3 using CRISPR/Cas9 genome editing. Naïve CD8+ T cells were sorted from pmel transgenic mice, infected with control or Gata3 lentivirus and activated with plate-bound anti-CD3 and anti-CD28 antibodies in the presence of IL-2 (Methods and Resources). Representative qPCR results showing Gata3 mRNA level in control versus Gata3 lentivirus targeted CD8+ T cells. E) 1 × 10⁶ CRISPR/Cas9-targeted cells were transferred to WT mice (n=5/group) bearing B16F10 melanoma tumors (day 5 post tumor grafting). Mean tumor growth is shown. Data are representative of 3 independent experiments. Statistical analysis was performed using linear regression. **p-value < 0.01. F and G) TILs were isolated on day 21 after tumor cell injection and analyzed for Tim-3 and PD-1 expression (F) and cytokine production (G) by flow cytometry.

Comment in

Similar articles

Cited by

References

    1. Anderson AC, Joller N, Kuchroo VK. Lag-3, Tim-3, and TIGIT: Co-inhibitory Receptors with Specialized Functions in Immune Regulation. Immunity. 2016;44:989–1004. - PMC - PubMed
    1. Baitsch L, Baumgaertner P, Devevre E, Raghav SK, Legat A, Barba L, Wieckowski S, Bouzourene H, Deplancke B, Romero P, et al. Exhaustion of tumor-specific CD8(+) T cells in metastases from melanoma patients. J Clin Invest. 2011;121:2350–2360. - PMC - PubMed
    1. Baitsch L, Fuertes-Marraco SA, Legat A, Meyer C, Speiser DE. The three main stumbling blocks for anticancer T cells. Trends Immunol. 2012;33:364–372. - PubMed
    1. Blackburn SD, Shin H, Haining WN, Zou T, Workman CJ, Polley A, Betts MR, Freeman GJ, Vignali DA, Wherry EJ. Coregulation of CD8+ T cell exhaustion by multiple inhibitory receptors during chronic viral infection. Nature immunology. 2009;10:29–37. - PMC - PubMed
    1. Bonaventura P, Benedetti G, Albarede F, Miossec P. Zinc and its role in immunity and inflammation. Autoimmun Rev. 2015;14:277–285. - PubMed

Publication types

MeSH terms