

The angiogenic switch leads to a metabolic shift in human glioblastoma
- PMID: 27591677
- PMCID: PMC5464376
- DOI: 10.1093/neuonc/now175
The angiogenic switch leads to a metabolic shift in human glioblastoma
Abstract
Background: Invasion and angiogenesis are major hallmarks of glioblastoma (GBM) growth. While invasive tumor cells grow adjacent to blood vessels in normal brain tissue, tumor cells within neovascularized regions exhibit hypoxic stress and promote angiogenesis. The distinct microenvironments likely differentially affect metabolic processes within the tumor cells.
Methods: In the present study, we analyzed gene expression and metabolic changes in a human GBM xenograft model that displayed invasive and angiogenic phenotypes. In addition, we used glioma patient biopsies to confirm the results from the xenograft model.
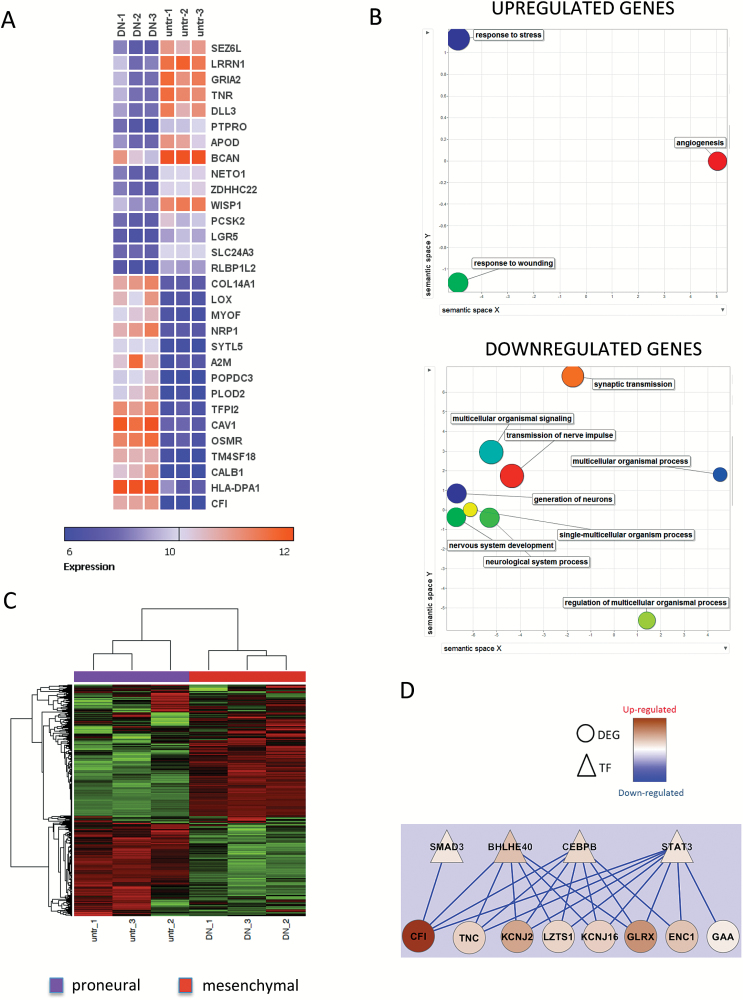
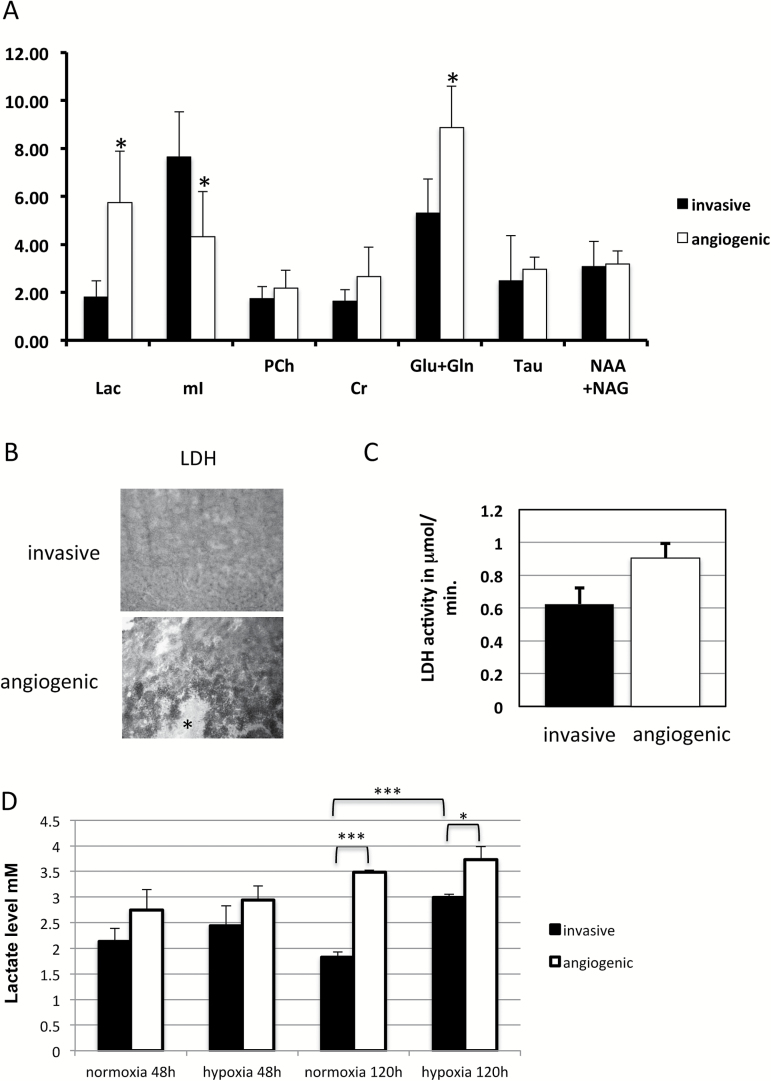
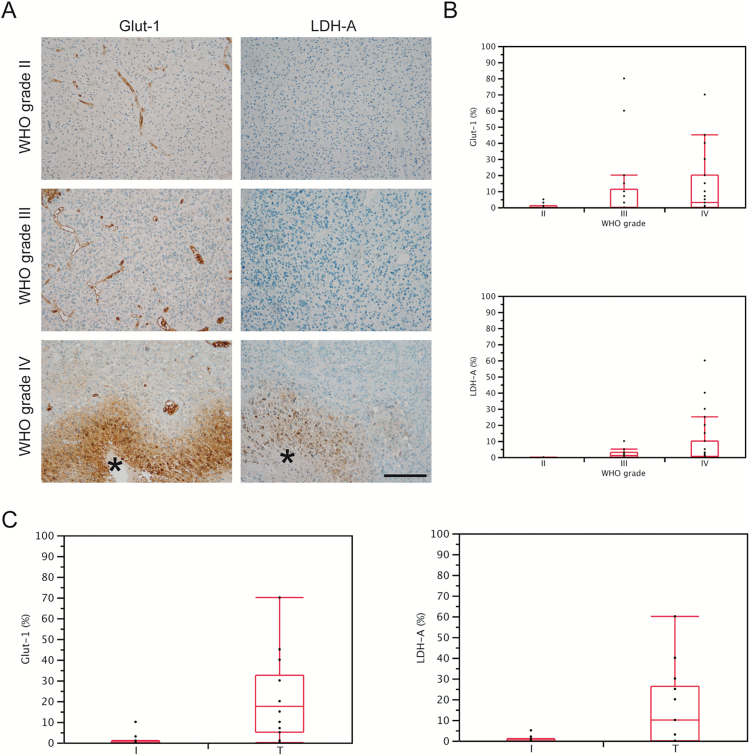
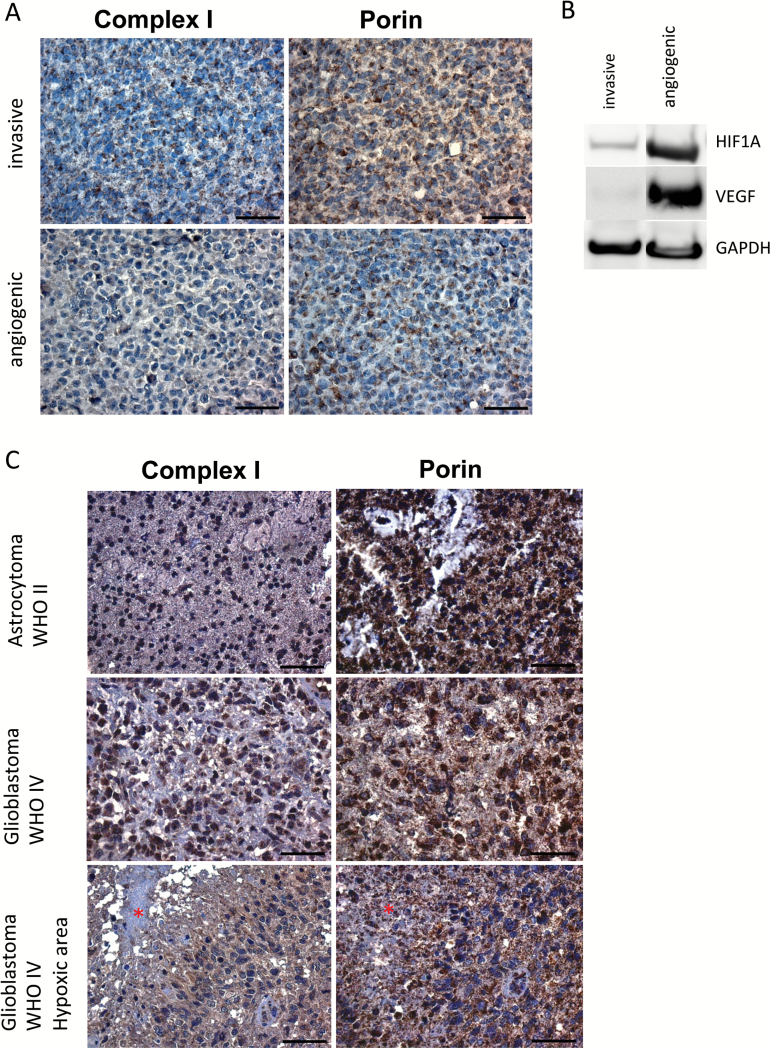
Results: We demonstrate that the angiogenic switch in our xenograft model is linked to a proneural-to-mesenchymal transition that is associated with upregulation of the transcription factors BHLHE40, CEBPB, and STAT3. Metabolic analyses revealed that angiogenic xenografts employed higher rates of glycolysis compared with invasive xenografts. Likewise, patient biopsies exhibited higher expression of the glycolytic enzyme lactate dehydrogenase A and glucose transporter 1 in hypoxic areas compared with the invasive edge and lower-grade tumors. Analysis of the mitochondrial respiratory chain showed reduction of complex I in angiogenic xenografts and hypoxic regions of GBM samples compared with invasive xenografts, nonhypoxic GBM regions, and lower-grade tumors. In vitro hypoxia experiments additionally revealed metabolic adaptation of invasive tumor cells, which increased lactate production under long-term hypoxia.
Conclusions: The use of glycolysis versus mitochondrial respiration for energy production within human GBM tumors is highly dependent on the specific microenvironment. The metabolic adaptability of GBM cells highlights the difficulty of targeting one specific metabolic pathway for effective therapeutic intervention.
Keywords: angiogenesis; glioblastoma; glycolysis; hypoxia; invasion.
© The Author(s) 2017. Published by Oxford University Press on behalf of the Society for Neuro-Oncology. All rights reserved. For permissions, please e-mail: journals.permissions@oup.com
Figures
Similar articles
-
Annexin A2-STAT3-Oncostatin M receptor axis drives phenotypic and mesenchymal changes in glioblastoma.Acta Neuropathol Commun. 2020 Apr 5;8(1):42. doi: 10.1186/s40478-020-00916-7. Acta Neuropathol Commun. 2020. PMID: 32248843 Free PMC article.
-
Molecular heterogeneity in a patient-derived glioblastoma xenoline is regulated by different cancer stem cell populations.PLoS One. 2015 May 8;10(5):e0125838. doi: 10.1371/journal.pone.0125838. eCollection 2015. PLoS One. 2015. PMID: 25955030 Free PMC article.
-
Clonal ZEB1-Driven Mesenchymal Transition Promotes Targetable Oncologic Antiangiogenic Therapy Resistance.Cancer Res. 2020 Apr 1;80(7):1498-1511. doi: 10.1158/0008-5472.CAN-19-1305. Epub 2020 Feb 10. Cancer Res. 2020. PMID: 32041837 Free PMC article.
-
Angiogenesis and hypoxia in glioblastoma: a focus on cancer stem cells.CNS Neurol Disord Drug Targets. 2012 Nov 1;11(7):878-83. doi: 10.2174/1871527311201070878. CNS Neurol Disord Drug Targets. 2012. PMID: 23131159 Review.
-
Overview of Transforming Growth Factor β Superfamily Involvement in Glioblastoma Initiation and Progression.Asian Pac J Cancer Prev. 2015;16(16):6813-23. doi: 10.7314/apjcp.2015.16.16.6813. Asian Pac J Cancer Prev. 2015. PMID: 26514451 Review.
Cited by
-
MACC: a visual interactive knowledgebase of metabolite-associated cell communications.Nucleic Acids Res. 2024 Jan 5;52(D1):D633-D639. doi: 10.1093/nar/gkad914. Nucleic Acids Res. 2024. PMID: 37897362 Free PMC article.
-
Fueling Cell Invasion through Extracellular Matrix.Trends Cell Biol. 2021 Jun;31(6):445-456. doi: 10.1016/j.tcb.2021.01.006. Epub 2021 Feb 3. Trends Cell Biol. 2021. PMID: 33549396 Free PMC article. Review.
-
Predicting intercellular communication based on metabolite-related ligand-receptor interactions with MRCLinkdb.BMC Biol. 2024 Jul 8;22(1):152. doi: 10.1186/s12915-024-01950-w. BMC Biol. 2024. PMID: 38978014 Free PMC article.
-
Tumor Microenvironment in Glioma Invasion.Brain Sci. 2022 Apr 15;12(4):505. doi: 10.3390/brainsci12040505. Brain Sci. 2022. PMID: 35448036 Free PMC article. Review.
-
Role of UBE2C in Brain Cancer Invasion and Dissemination.Int J Mol Sci. 2023 Oct 31;24(21):15792. doi: 10.3390/ijms242115792. Int J Mol Sci. 2023. PMID: 37958776 Free PMC article. Review.
References
-
- Zeng W, Liu P, Pan W, et al. Hypoxia and hypoxia inducible factors in tumor metabolism. Cancer Lett. 2015;356(2 Pt A):263–267. - PubMed
-
- Warburg O. On the origin of cancer cells. Science. 1956; 123(3191):309–314. - PubMed
-
- Koppenol WH, Bounds PL, Dang CV. Otto Warburg’s contributions to current concepts of cancer metabolism. Nat Rev Cancer. 2011;11(5):325–337. - PubMed
MeSH terms
Substances
LinkOut - more resources
Full Text Sources
Other Literature Sources
Medical
Miscellaneous
