. 2016 Oct 21;291(43):22414-22426.
doi: 10.1074/jbc.M116.732511. Epub 2016 Sep 1.

Amino Acids Regulate mTORC1 by an Obligate Two-step Mechanism

Affiliations

Amino Acids Regulate mTORC1 by an Obligate Two-step Mechanism

Julia Dyachok et al. J Biol Chem. .

Erratum in

Abstract

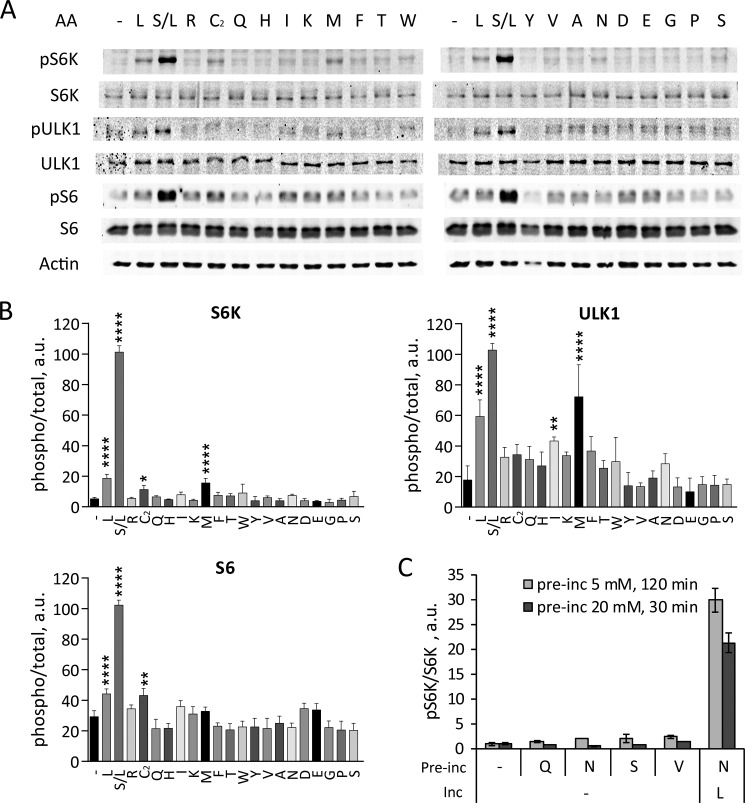
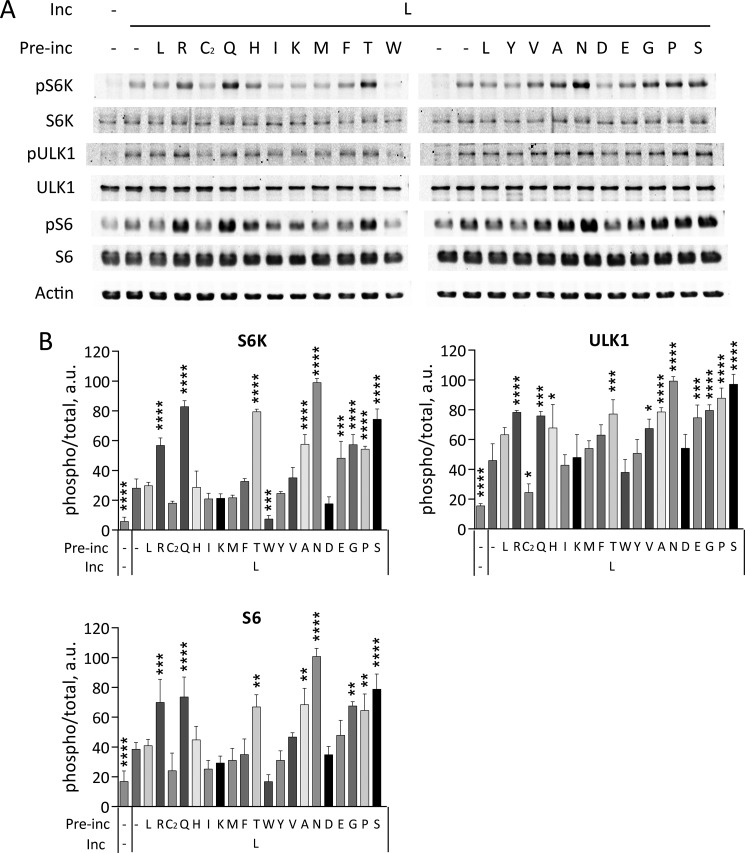
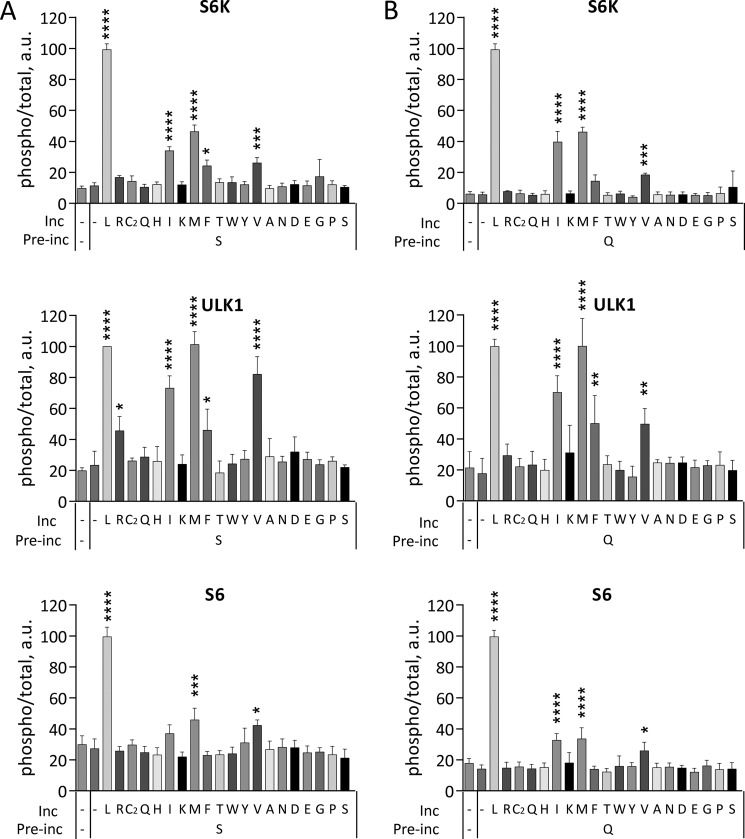
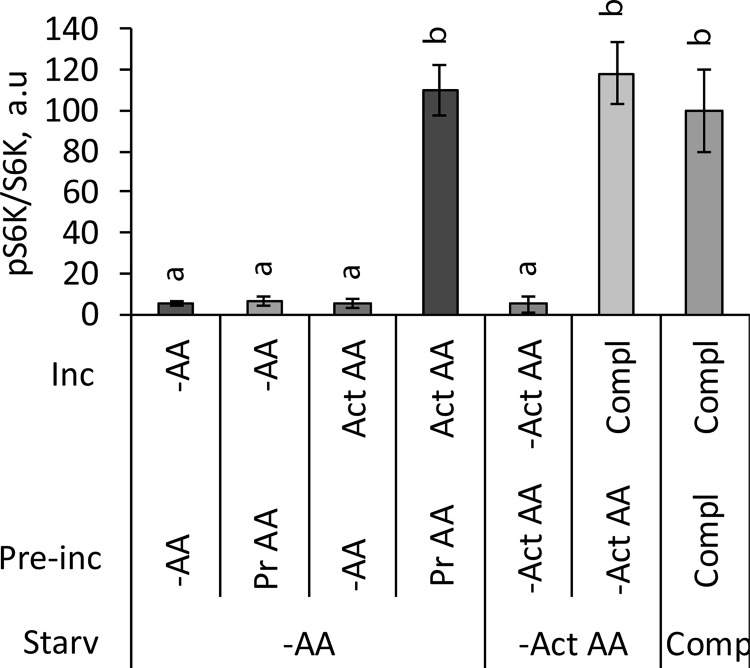
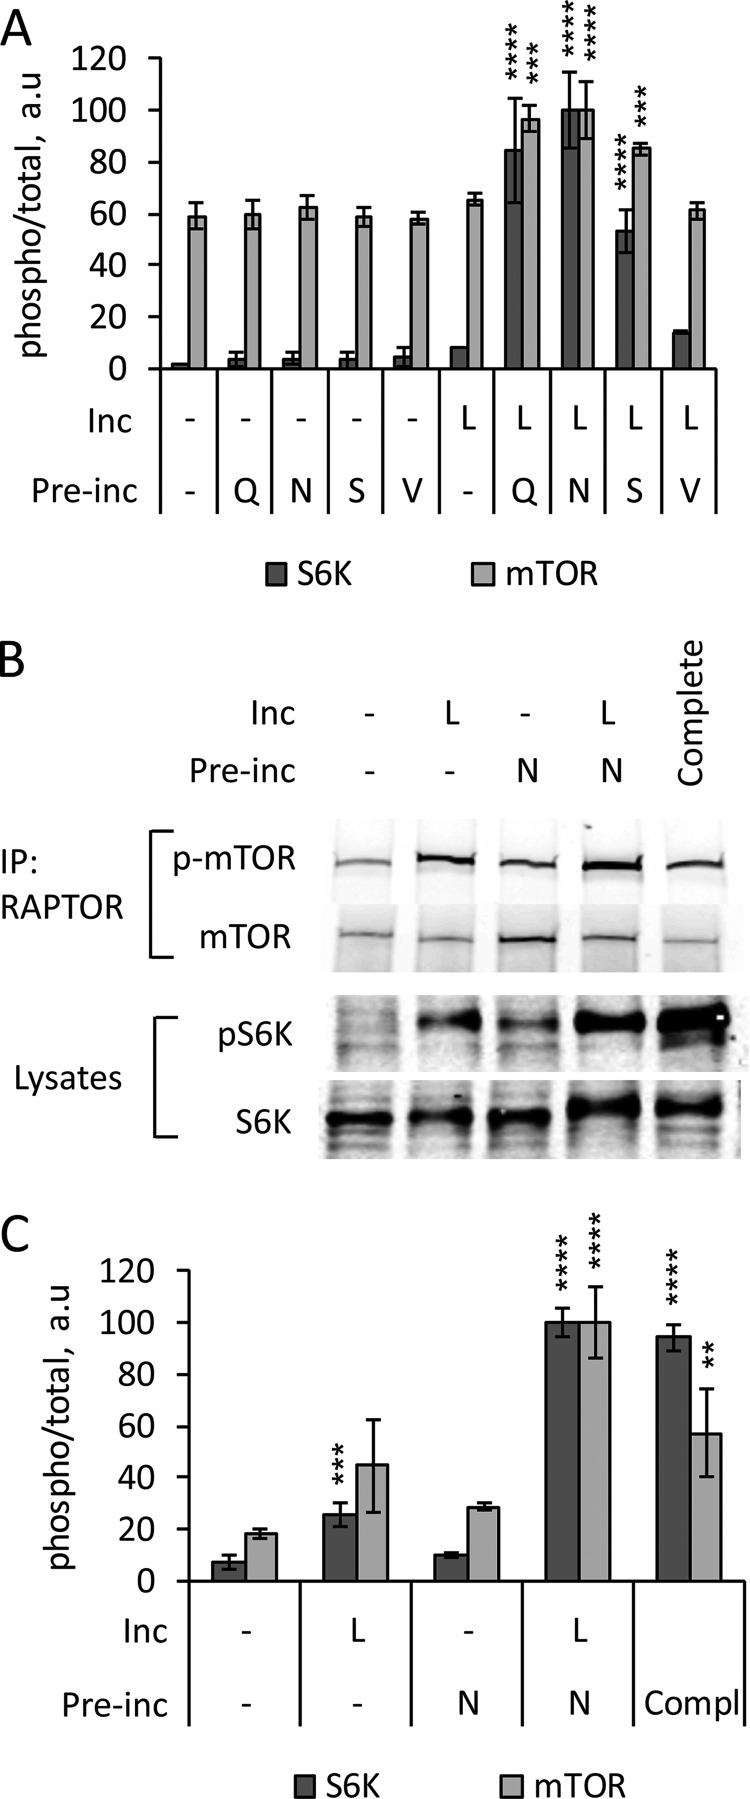
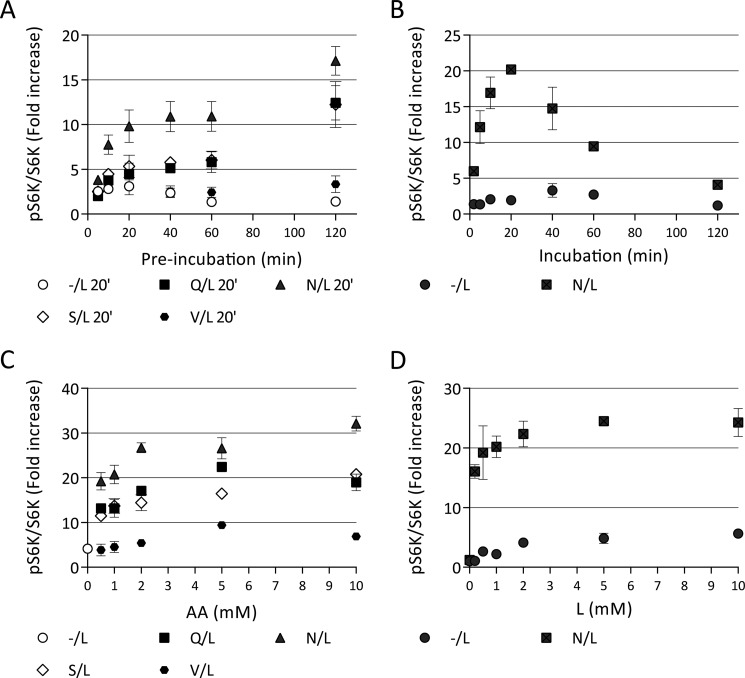
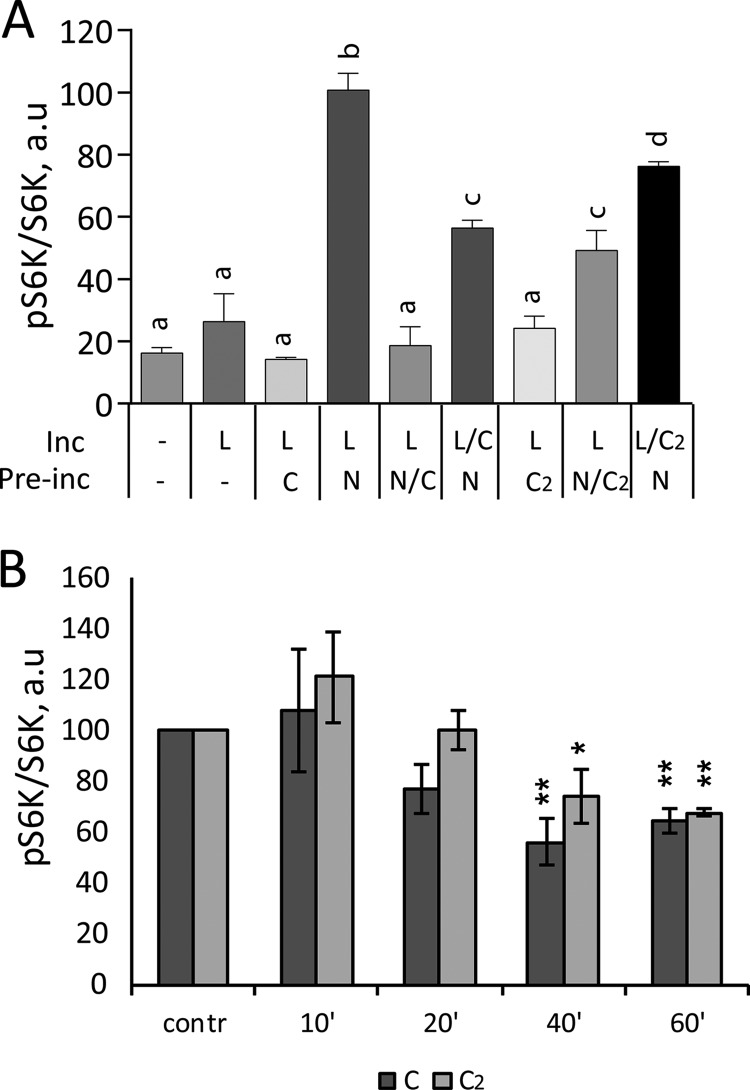
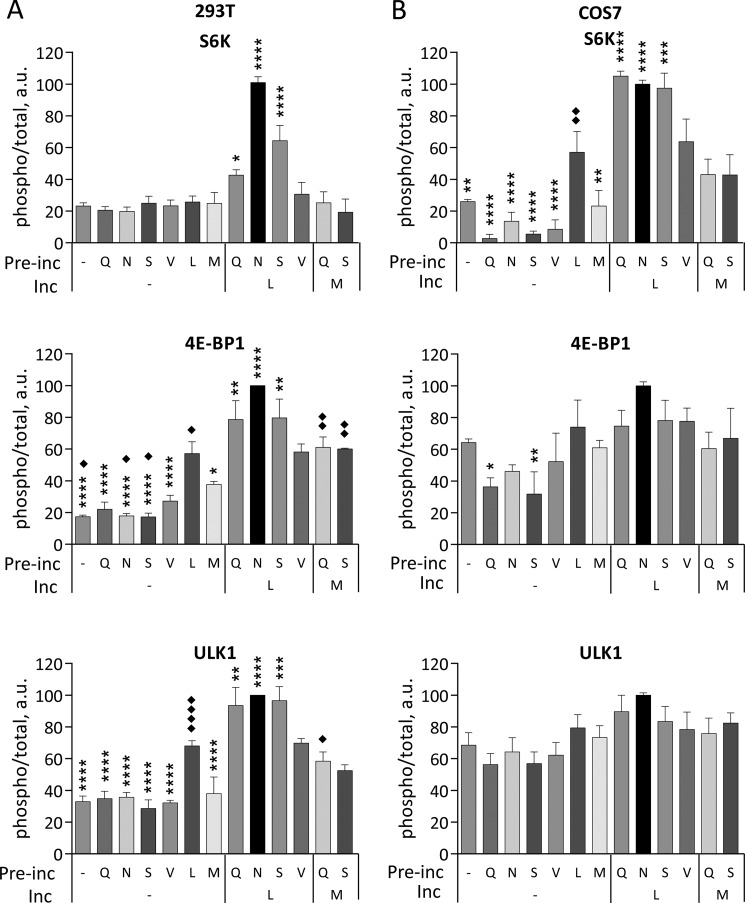
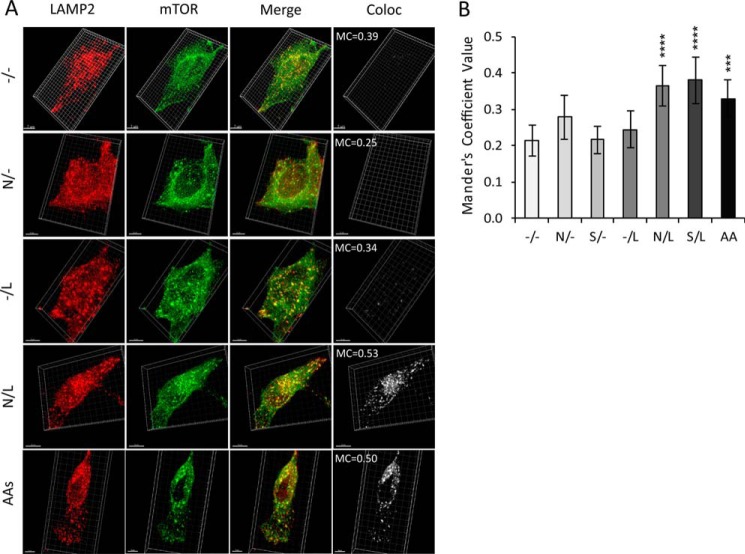
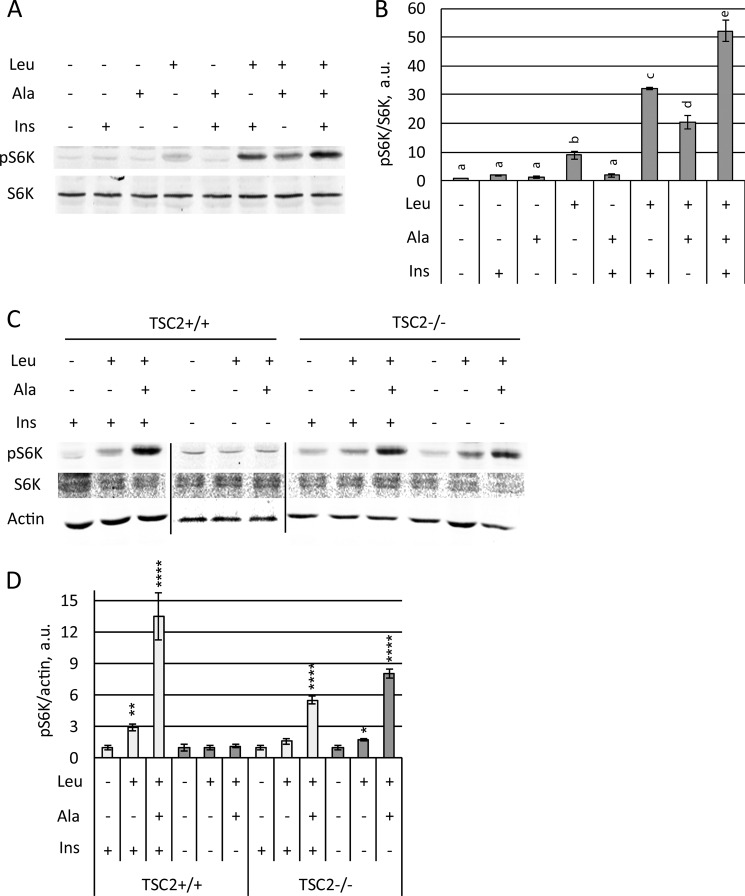
The mechanistic target of rapamycin complex 1 (mTORC1) coordinates cell growth with its nutritional, hormonal, energy, and stress status. Amino acids are critical regulators of mTORC1 that permit other inputs to mTORC1 activity. However, the roles of individual amino acids and their interactions in mTORC1 activation are not well understood. Here we demonstrate that activation of mTORC1 by amino acids includes two discrete and separable steps: priming and activation. Sensitizing mTORC1 activation by priming amino acids is a prerequisite for subsequent stimulation of mTORC1 by activating amino acids. Priming is achieved by a group of amino acids that includes l-asparagine, l-glutamine, l-threonine, l-arginine, l-glycine, l-proline, l-serine, l-alanine, and l-glutamic acid. The group of activating amino acids is dominated by l-leucine but also includes l-methionine, l-isoleucine, and l-valine. l-Cysteine predominantly inhibits priming but not the activating step. Priming and activating steps differ in their requirements for amino acid concentration and duration of treatment. Priming and activating amino acids use mechanisms that are distinct both from each other and from growth factor signaling. Neither step requires intact tuberous sclerosis complex of proteins to activate mTORC1. Concerted action of priming and activating amino acids is required to localize mTORC1 to lysosomes and achieve its activation.

Keywords: S6 kinase; amino acid; cell signaling; lysosome; mTOR complex (mTORC); mammalian target of rapamycin (mTOR); protein kinase.


Figures

FIGURE 1.
FIGURE 1.
Individual amino acids have little effect on mTORC1 activity. A and B, HeLa cells starved in KRBH for 1 h were incubated in the absence (−) or in the presence of indicated amino acids for 40 min. Alternatively, starved cells were preincubated in the presence of Ser for 20 min followed by Leu for 20 min (S/L). A, the phosphorylation of S6K (Thr389), ULK1 (Ser757), S6 (Ser240/244), and total S6K, ULK1, S6, and actin was analyzed by immunoblotting. B, the means of pS6K/S6K, pULK1/ULK1, and pS6/S6 are expressed as percentages compared with S/L-treated cells. The data shown are averages of two independent experiments (n = 4) ± S.D. Asterisks denote values significantly different from cells treated in the absence of amino acids. *, p < 0.05; **, p < 0.01; ***, p < 0.001; ****, p < 0.0001 (Tukey's test). C, starved cells were preincubated in the absence (−) or in the presence of Gln, Asn, Ser, or Val at 5 mm for 120 min (light bars) or at 20 mm for 30 min (dark bars) followed by incubation in the absence or in the presence of 5 mm Leu for another 20 min. The means of pS6K/S6K values from immunoblots are expressed as fold increase compared with starved cells. The data shown are averages of two independent experiments performed in duplicate (n = 4) ± S.D.
FIGURE 2.
FIGURE 2.
Individual amino acids differentially affect Leu-stimulated mTORC1 activity. HeLa cells starved in KRBH for 1 h were preincubated in the absence (−) or in the presence of indicated amino acids for 20 min followed by the incubation in the absence (−) or in the presence of Leu (L) for another 20 min. A, the phosphorylation of S6K (Thr389), ULK1 (Ser757), S6 (Ser240/244), and total S6K, ULK1, S6, and actin were analyzed by immunoblotting. B, the means of pS6K/S6K, pULK1/ULK1, and pS6/S6 are expressed as percentage compared with cells preincubated with Asn (N) followed by Leu. The data shown are averages of two independent experiments (n = 4) ± S.D. Asterisks denote values significantly different from cells treated with Leu alone. *, p < 0.05; **, p < 0.01; ***, p < 0.001; ****, p < 0.0001 (Tukey's test).
FIGURE 3.
FIGURE 3.
Activation of mTORC1 by individual amino acids in cells preincubated with Ser or Gln. HeLa cells starved in KRBH for 1 h were preincubated in the absence (−) or in the presence of Ser (A) or Gln (B) for 20 min followed by the incubation in the absence (−) or in the presence of indicated amino acids for another 20 min. The phosphorylation of S6K (Thr389), ULK1 (Ser757), S6 (Ser240/244), and total S6K, ULK1, and S6 were analyzed by immunoblotting. The means of pS6K/S6K, pULK1/ULK1, and pS6/S6 are expressed as percentages compared with cells preincubated with Ser followed by Leu. The data shown are averages of two independent experiments (n = 4) ± S.D. Asterisks denote values significantly different from cells treated with Ser alone (A) or Gln alone (B). *, p < 0.05; **, p < 0.01; ***, p < 0.001; ****, p < 0.0001 (Tukey's test).
FIGURE 4.
FIGURE 4.
Priming and activating amino acids sustain mTORC1 activity in growth medium. HeLa cells were starved for 1 h in amino acid-free DMEM (−AA) or in DMEM that lacks the activating amino acids Leu, Met, Ile, and Val (−Act AA). The cells were then preincubated in −AA DMEM, −Act AA DMEM, or in the presence of the priming amino acids Gly, Arg, Gln, Ser, and Thr (Pr AA) for 20 min. The cells were washed to remove amino acids and incubated for 20 min in −AA DMEM; in DMEM containing only activating amino acids Leu, Met, Ile, and Val (Act AA); or in complete medium (Compl). Control cells were kept continuously in complete DMEM. The phosphorylation of S6K (Thr389) and total S6K were analyzed by immunoblotting. The means of pS6K/S6K are expressed as percentages compared with the control cells in complete medium. The data shown are averages of two independent experiments (n = 6) ± S.D. Means with different letters are significantly different (p < 0.05; Tukey's test).
FIGURE 5.
FIGURE 5.
Phosphorylation of mTOR during priming and activation of mTORC1 by amino acids. A, starved HeLa cells were preincubated in the absence (−) or presence of the indicated amino acids (Gln, Asn, Ser, or Val) for 20 min, washed to remove amino acids, and incubated for 20 min more in the presence (L) or absence (−) of Leu. The phosphorylation of S6K (Thr389) and mTOR (Ser2448) and total S6K and mTOR were analyzed by immunoblotting. The means of pS6K/S6K and p-mTOR/mTOR are expressed as percentages compared with cells preincubated with Asn followed by Leu. The data shown are averages of two independent experiments (n = 3) ± S.D. B and C, starved HeLa cells were preincubated in the absence (−) or presence (N) of Asn for 40 min, washed, and incubated for 20 min in the absence (−) or presence (L) of Leu. Alternatively, the cells were maintained in complete medium. mTORC1 was immunoprecipitated from whole cell lysates with anti-RAPTOR antibodies. B, the phosphorylation of mTOR (Ser2448) and total mTOR was analyzed by immunoblotting of the immunoprecipitates. The phosphorylation of S6K (Thr389) and total S6K was analyzed by immunoblotting of the cell lysates. C, the means of pS6K/S6K and p-mTOR/mTOR are expressed as percentages compared with cells preincubated with Asn followed by Leu. The data shown are averages of two independent experiments (n = 4) ± S.D. Asterisks denote values significantly different from cells treated in the absence of amino acids. *, p < 0.05; **, p < 0.01; ***, p < 0.001; ****, p < 0.0001 (Tukey's test).
FIGURE 6.
FIGURE 6.
Concentration ranges and time courses of the two phases of mTORC1 activation by amino acids. HeLa cells were starved before treatments in KRBH for 1 h. A, cells were preincubated in the absence (−) or in the presence of 5 mm priming amino acids (Gln, Asn, Ser, or Val) for times indicated. The cells were washed to remove amino acids and incubated with 5 mm Leu (L) for 20 min. B, cells were preincubated in the absence of amino acids (−) or in the presence of 5 mm Asn for 30 min. The cells were washed to remove amino acids and incubated with 5 mm Leu for indicated lengths of time. C, cells were preincubated in the absence (−) or in the presence of indicated concentrations of Gln, Asn, Ser, or Val for 20 min. The cells were washed to remove amino acids and incubated with 5 mm Leu for another 20 min. D, cells were preincubated in the absence of amino acids (−) or in the presence of 5 mm Asn for 30 min. The cells were washed to remove amino acids and incubated with indicated concentrations of L for another 20 min. The phosphorylation of S6K (Thr389) and total S6K were analyzed by immunoblotting. The means of pS6K/S6K are expressed as fold increase compared with starved cells. The data shown are representative of two independent experiments performed in duplicate (B) or triplicate (A, C, and D). The data with error bars represent means ± S.D.
FIGURE 7.
FIGURE 7.
Cysteine and cystine inhibit priming step of mTORC1 activation by amino acids. A, HeLa cells were starved in KRBH for 1 h and then incubated in the absence (−) or in the presence of 1 mm Asn (N), Cys (C), l-cystine (C2), or combinations of N and C or of N and C2 for 15 min. The cells were washed with KRBH twice followed by incubation in the absence (−) or in the presence of 1 mm Leu (L), or combinations of L and C or of L and C2 for another 15 min. The phosphorylation of S6K (Thr389) and total S6K were analyzed by immunoblotting. The means of pS6K/S6K are expressed as percentages compared with cells preincubated with Asn followed by incubation with Leu. The data shown are averages of two independent experiments performed in duplicate (n = 4) ± S.D. Means with different letters are significantly different (p < 0.05; Tukey's test). B, HeLa cells in complete growth medium (DMEM supplemented with 10% FBS) were supplemented with 5 mm C or C2 for indicated lengths of time. The phosphorylation of S6K (Thr389) and total S6K were analyzed by immunoblotting. The means of pS6K/S6K are expressed as percentages compared with their respective no supplement controls. The data shown are averages of two independent experiments (n = 4) ± S.D. Asterisks denote values significantly different from no treatment controls. *, p < 0.05; **, p < 0.01; ***, p < 0.001; ****, p < 0.0001 (Tukey's test).
FIGURE 8.
FIGURE 8.
Amino acids Gln, Asn, and Ser but not Val prime 293T and COS7 cells for mTORC1 activation by Leu or Met. Starved 293T (A) or COS7 (B) cells were incubated in the absence (−) or in the presence of indicated amino acids (Gln, Asn, Ser, or Val) for 20 min followed by incubation in the absence (−) or in the presence of Leu or Met for another 20 min. The phosphorylation of S6K (Thr389), 4E-BP1 (Thr37/46), ULK1 (Ser757), and total S6K, 4E-BP1, and ULK1 were analyzed by immunoblotting. The means of pS6K/S6K, p4E-BP1/4E-BP1, and pULK1/ULK1 are expressed as percentages compared with cells preincubated with Asn followed by Leu. The data shown are averages of two independent experiments (n = 3) ± S.D. Asterisks denote values significantly different from cells treated with Leu alone. *, p < 0.05; **, p < 0.01; ***, p < 0.001; ****, p < 0.0001 (Tukey's test). Diamonds denote values significantly different from cells treated with Mets alone. ♦, p < 0.05; ♦♦, p < 0.01; ♦♦♦, p < 0.001; ♦♦♦♦, p < 0.0001 (Tukey's test).
FIGURE 9.
FIGURE 9.
Priming amino acids and Leu are required to localize mTOR to lysosomes. Starved HeLa cells were preincubated in the absence (−) or in the presence (+) of 5 mm Asn or Ser for 30 min followed by incubation for 20 min in the absence or in the presence of 5 mm Leu. Alternatively, the cells were supplemented for 30 min with complete amino acids at concentrations present in growth media (AAs). A, representative images of cells treated in the absence of amino acids or in the presence of Asn, Leu, or Asn followed by Leu or AAs. The cells were fixed, stained for LAMP2 and mTOR, and imaged as described under “Experimental Procedures.” The images are maximum intensity projections of 16 z slices. Shown are LAMP2 (red), mTOR (green), merge (LAMP2 and mTOR), and the co-localization (Coloc) channel showing voxels where LAMP2 and mTOR co-localization was indicated by Mander's coefficient (MC). Not shown are images of cells treated with Ser (similar to cells treated with Asn) and Ser followed by Leu (similar to Asn followed by Leu). B, quantification of mTOR and LAMP2 co-localization using thresholded Mander's coefficients, i.e. the number of voxels with above-threshold fluorescence in both channels (mTOR and LAMP2) divided by the number of voxels with above-threshold fluorescence for mTOR. The data shown are averages of two independent experiments (24–30 cells each) ± S.D.
FIGURE 10.
FIGURE 10.
Insulin and Ala independently promote mTORC1 activation by Leu. A and B, Hela cells were serum-starved overnight before 2 h of incubation in KRBH followed by incubation with (+) or without (−) 5 mm Leu, 5 mm Ala, or 5 μg/ml insulin (Ins) for 30 min. A, the phosphorylation of S6K (Thr389) and total S6K were analyzed by immunoblotting. B, mean pS6K/S6K ratios are shown as fold increases compared with untreated controls. The data are averages of two independent experiments performed in duplicate (n = 4) ± S.D. Letters indicate groups of conditions that differ significantly from the others (p < 0.05; Tukey's test). C and D, TSC2+/+ (p53−/−) and TSC2−/− (p53−/−) MEFs were serum-starved overnight. The cells were then incubated in KRBH in the absence (−) or in the presence (+) of 5 μg/ml insulin for 2 h followed by treatment in the absence (−) or in the presence (+) of 5 mm Ala for 30 min followed by final treatment in the absence (−) or in the presence (+) of 5 mm Leu for 20 min. C, phosphorylation of S6K (Thr389) and total S6K and actin were analyzed by immunoblotting. D, pS6K/actin ratios are shown as fold increases compared with their respective no-treatment controls. The data shown are averages of two independent experiments performed in duplicate (n = 4) ± S.D. Asterisks denote values significantly different from the respective no amino acid controls. *, p < 0.05; **, p < 0.01; ***, p < 0.001; ****, p < 0.0001 (Tukey's test).

Similar articles

Cited by

References

    1. Ma X. M., Yoon S.-O., Richardson C. J., Jülich K., and Blenis J. (2008) SKAR links pre-mRNA splicing to mTOR/S6K1-mediated enhanced translation efficiency of spliced mRNAs. Cell 133, 303–313 - PubMed
    1. Gingras A. C., Raught B., and Sonenberg N. (2004) mTOR signaling to translation. Curr. Top. Microbiol. Immunol. 279, 169–197 - PubMed
    1. Kim J., Kundu M., Viollet B., and Guan K.-L. (2011) AMPK and mTOR regulate autophagy through direct phosphorylation of Ulk1. Nat. Cell Biol. 13, 132–141 - PMC - PubMed
    1. Guertin D. A., and Sabatini D. M. (2007) Defining the role of mTOR in cancer. Cancer Cell 12, 9–22 - PubMed
    1. Duan S., Skaar J. R., Kuchay S., Toschi A., Kanarek N., Ben-Neriah Y., and Pagano M. (2011) mTOR generates an auto-amplification loop by triggering the βTrCP- and CK1α-dependent degradation of DEPTOR. Mol. Cell 44, 317–324 - PMC - PubMed

Substances

LinkOut - more resources