. 2016 Sep 19;213(10):2019-37.
doi: 10.1084/jem.20160157. Epub 2016 Aug 29.

Notch activation drives adipocyte dedifferentiation and tumorigenic transformation in mice

Affiliations

Notch activation drives adipocyte dedifferentiation and tumorigenic transformation in mice

Pengpeng Bi et al. J Exp Med. .

Abstract

Liposarcomas (LPSs) are the most common soft-tissue cancer. Because of the lack of animal models, the cellular origin and molecular regulation of LPS remain unclear. Here, we report that mice with adipocyte-specific activation of Notch signaling (Ad/N1ICD) develop LPS with complete penetrance. Lineage tracing confirms the adipocyte origin of Ad/N1ICD LPS. The Ad/N1ICD LPS resembles human dedifferentiated LPS in histological appearance, anatomical localization, and gene expression signature. Before transformation, Ad/N1ICD adipocytes undergo dedifferentiation that leads to lipodystrophy and metabolic dysfunction. Although concomitant Pten deletion normalizes the glucose metabolism of Ad/N1ICD mice, it dramatically accelerates the LPS prognosis and malignancy. Transcriptomes and lipidomics analyses indicate that Notch activation suppresses lipid metabolism pathways that supply ligands to Pparγ, the master regulator of adipocyte homeostasis. Accordingly, synthetic Pparγ ligand supplementation induces redifferentiation of Ad/N1ICD adipocytes and tumor cells, and prevents LPS development in Ad/N1ICD mice. Importantly, the Notch target HES1 is abundantly expressed in human LPS, and Notch inhibition suppresses the growth of human dedifferentiated LPS xenografts. Collectively, ectopic Notch activation is sufficient to induce dedifferentiation and tumorigenic transformation of mature adipocytes in mouse.


Figures

Figure 1.
Figure 1.
Ad/N1ICD mice develop LPSs at various anatomical locations. (A) Illustration of Notch activation by Cre in Ad/N1ICD mice. (B) Frequency of tumors at various anatomical locations. (C) Percentages of tumor-free mice at different ages. P = 0 for log-rank test between WT and Ad/N1ICD mice. WT, n = 37; Ad/N1ICD, n = 25. (D) Image of one Ad/N1ICD sarcoma in retroperitoneum (arrow). SV, seminal vesicle. (E and F) H&E staining results of Ad/N1ICD sarcomas; arrows point to whorls (E) and adipocytes (F). (G) IHC staining of LPS-specific markers (Mdm2, Cdk4, and p16) and Pparγ on Ad/N1ICD sarcoma sections. (H) Western blot of WT and Ad/N1ICD adipose tissues and LPS; arrow points to the correct band of Cdk4. Protein marker size is shown on right. (I) Relative Mdm2 genomic DNA copy number quantification, number on bar is the fold change. n = 4 for WT and Ad/N1ICD WAT; n = 10 for Ad/N1ICD LPS. Bars, 50 µm. *, P < 0.05. Bar graphs indicate mean ± SEM.
Figure 2.
Figure 2.
Lineage and biomarker analysis of Ad/N1ICD LPS. (A) Genomic DNA assay demonstrating Notch activation in Ad/N1ICD LPS. loxP band indicates intact DNA; Recom band indicates Cre-induced DNA recombination that activates N1ICD. (B) Relative expression of Notch pathway genes in N1ICD-activated LPS (n = 12). Values are normalized to WT inguinal adipose tissues (set to 1, n = 10). P = 0.06 for Hey1. (C–F) mTmG dual reporter assay demonstrating Adipoq+ lineage origin (labeled by mG, GFP) of adipocytes shown in whole mount WAT (C), a sarcoma shown in whole mount (D), and cross sections (E and F). F is a confocal microscope image. Note that vessels in adipose tissue and sarcomas are labeled by mT (RFP), therefore are of Adipoq origin. Four Ad/N1ICD/mTmG mice were observed. (G–I) Relative expression of preadipocyte marker Dlk1 (G), LPS markers (H), and mature adipocyte markers (I) in Ad/N1ICD WAT and LPS (LPS, n = 8; WAT, n = 4), values are data labels. Bars: (C–E) 50 µm; (F) 10 µm. *, P < 0.05; **, P < 0.01; ***, P < 0.001. Bar graphs indicate mean ± SEM.
Figure 3.
Figure 3.
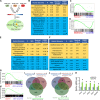
Ad/N1ICD adipocytes and LPS showed significant enrichment of human LPS gene signature. (A) Cartoon illustration of experiment design for B–H. (B) GSEA analysis of the human sarcoma gene expression database (GEO accession no. GSE2553), interrogated with Ad/N1ICD microarray gene set. NES, normalized enrichment score. FWER, familywise-error rate. #, number of patients. (C and D) Gene enrichment plots for analysis in B. (E and F) GSEA analysis of the human sarcoma gene expression database (GEO accession no. GSE6481) interrogated with Ad/N1ICD microarray gene set (E) and Ad/N1ICD LPS RNA-seq gene set (F). (G and H) Gene enrichment plots for analysis in E (G) and F (H). (I and J) Venn diagrams to show intersections among the three gene datasets. (K) Relative expression of Notch ligands (JAG2 and DLL4) and Notch target genes in human DDLPS cell lines, compared with WDLPS cell lines. Data were extracted and analyzed from GEO under accession no. GSE57754. (DDLPS, n = 6; WDLPS, n = 6). *, P < 0.05. Bar graphs indicate mean ± SEM.
Figure 4.
Figure 4.
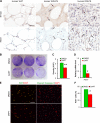
Notch inhibitor DAPT inhibits cell proliferation of human DDLPS cells. (A) Representative IHC staining results of N1ICD and HES1 in human adipose tissue and LPS sections (n = 4/group). Arrows point to positive cells. (B) Crystal violet staining result of DMSO or Notch inhibitor DAPT-treated human DDLPS cell line LPS246. (C) Quantification of densitometry in B. n = 3. (D) Relative expression levels of Notch target genes in LPS246 cells. n = 8. (E) Immunofluorescent images of DMSO or DAPT-treated LPS246 cells. n = 3. (F) Quantification of Ki67+ percentages of cells as in E. n = 3. Bars, 50 µm. *, P < 0.05. Bar graphs indicate mean ± SEM.
Figure 5.
Figure 5.
Activation of N1ICD leads to lipodystrophy and metabolic syndromes. (A) Adipose tissue composition ratios of 3-wk-old mice (n = 6). (B) Western blot results of inguinal adipose tissues from of 3-wk-old mice. Protein marker size was labeled on right. (C) RFP fluorescence image of freshly isolated 3-wk-old Ad/N1ICD/td-Tomato inguinal adipocytes to report activation of Cre. (D and E) Ad/N1ICD mice are resistant to HFD induced body weight gain (D) due to lipodystrophy, evident from tissue composition after 16 wk on HFD (E; n = 3). (F) Ad/N1ICD prevents body weight gain in chow diet–fed Leptinob mice (n = 8). (G) H&E images showing hepatic steatosis in Ad/N1ICD mice (n = 5). (H) Relative expression of genes in liver (n = 4). (I) Blood glucose levels of 5-mo-old mice at different times of the day (light on, 6 am; light off, 6 pm; n = 5). (J) Ad libitum blood glucose levels (n = 9). (K) Fasted and re-fed blood insulin levels of mice (n = 5). (L and M) Blood glucose levels during insulin tolerance test performed on chow diet–fed (L; n = 5) and HFD-fed mice (M; n = 4). (N) RT-PCR analysis of IngWAT showing normal expression levels of mature adipocyte markers in juvenile mice but reduced expression in adult mice. (O) GFP immunostaining of 10-mo-old Ad/N1ICD/mTmG inguinal WAT to show GFP+ lipid-laden adipocytes (arrows) and GFP+ dedifferentiated adipocytes (asterisks). Bars: (C and G) 50 µm; (O) 10 µm. # and *, P < 0.05; ## and **, P < 0.01; ### and ***, P < 0.001. *, comparison between genotypes; #, comparison between 0 and other time points. Bar graphs indicate mean ± SEM.
Figure 6.
Figure 6.
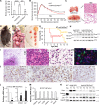
Pten deletion accelerates tumorigenesis and increases the malignancy of Ad/N1ICD LPS. (A) Mice blood glucose measurement. #, comparison between WT and Ad/N1ICD/PtenF/F mice (WT, n = 12; Ad/N1ICD, n = 5; Ad/N1ICD/PtenF/F, n = 5). (B) GTT of 8-wk-old mice. NS, not significant (n = 5 WT, 3 Ad/N1ICD, 3 Ad/N1ICD/PtenF/F). (C) Image of BAT and H&E staining result. (D–F) Representative necropsy images of Ad/N1ICD/PtenF/F tumors in ventral subcutaneous region (D), thoracic cavity (E), and dorsal subcutaneous region after dissection (F). * indicates heart, # indicates lung. (G) Percentages of tumor-free mice at different ages. P = 3.53 × 10⁻⁸ for log-rank test between WT and Ad/N1ICD/PtenF/F mice, P = 1.05 × 10⁻¹¹ for log-rank test between Ad/N1ICD and Ad/N1ICD/PtenF/F mice. WT, n = 15; Ad/PtenF/F, n = 6; Ad/N1ICD/PtenF/F, n = 16. (H) Genomic DNA assay demonstrating recombination in RosaN1ICD and PtenF/F loci of tumors (T) and liver sample. PTC, positive control of genomic DNA template. (I) H&E staining results of Ad/N1ICD/PtenF/F tumor sections. Arrows point to the immune cells in region 1. (J and K) IHC and immunofluorescence staining of Ad/N1ICD/PtenF/F tumor sections. (L) Relative expression of Pten and mature adipocyte marker genes in Ad/N1ICD and Ad/N1ICD/PtenF/F tumors. (M) Relative expression of mature adipocytes markers in WT inguinal WAT and Ad/N1ICD/PtenF/F tumors. (N) Western blot analysis of WT inguinal WAT (Ing), Ad/N1ICD, and Ad/N1ICD/PtenF/F tumors (T). Protein marker size was labeled on right. Bars, 20 µm. * and #, P < 0.05; **, P < 0.01; ***, P < 0.001. Bar graphs indicate mean ± SEM.
Figure 7.
Figure 7.
Inhibition of lipid metabolism pathways in Ad/N1ICD adipocytes and LPSs. (A) Microarray volcano plot of genes with significant fold-change in Ad/N1ICD (n = 4) versus WT inguinal WAT (n = 4). Colored dots are genes on the indicated pathways. (B and D) IPA pathway analysis for differentially expressed genes in Ad/N1ICD fat versus WT fat (B) and genes in Ad/N1ICD LPS versus Ad/N1ICD fat (D). (C) Heat map of the representative genes from pathways listed in B. (E) Ingenuity upstream regulator analysis of differentially expressed genes in Ad/N1ICD fat versus WT fat. (F) Heat map of metabolites in mass spectrometry full scan in the negative ion mode of lipids extracted from 3-wk-old WT and Ad/N1ICD inguinal adipose tissues (n = 4). (G) Western blot results of adipose tissues and Ad/N1ICD LPSs. Protein marker size is shown on the right. *, P < 0.05. Bar graphs indicate mean ± SEM.
Figure 8.
Figure 8.
Dedifferentiation of Ad/N1ICD adipocytes and LPS cancer cells is rescued by the Pparγ ligand rosiglitazone. (A) Oil-red O staining of primary adipocytes of WT and Ad/N1ICD mice with or without rosiglitazone (Rosi; 0.2 µM; n = 5). (B) Relative expression of mature adipocyte markers in primary adipocytes cultured as shown in A (n = 5). Veh, vehicle; NS, not significant. (C and D) Macroscopic images (C) and relative weights (normalized to gastrocnemius muscle; D; n = 3 pairs) of adipose tissues from Ad/N1ICD/Leptinob mice fed on control (Ctrl) diet or Rosi diet (0.005%) for 4 wk starting at 4–5 mo of age. (E and F) Relative mRNA (E) and protein (F) levels of mature adipocyte markers and lipodystrophy gene Cidec in inguinal WAT of Ad/N1ICD/Leptinob mice (n = 4). Protein marker size was labeled on right. (G) Blood glucose levels of 3-mo-old mice fed with control or Rosi diet for 1 wk (n = 5). (H) Phase and fluorescent images of cultured Ad/N1ICD or Ad/N1ICD/mTmG LPS-derived cancer cells stimulated with adipogenic cocktails. (I) Relative expression of mature adipocyte markers in Ad/N1ICD LPS-derived cancer cells as in H (n = 3). (J and K) Percentages of tumor-free mice at different ages. Ad/N1ICD and Ad/NICD/PtenF/F mice were switched to rosiglitazone diet at ∼7 mo and 21 d of age, respectively. P = 0.014 for log-rank test between Ctrl diet–fed Ad/N1ICD and Rosi-diet fed Ad/N1ICD mice; P = 0.008 for log-rank test between control-diet fed Ad/N1ICD/PtenF/F and Rosi-diet fed Ad/N1ICD/PtenF/F mice. Ad/N1ICD mice: n = 3 for control diet; n = 4 for Rosi diet. Ad/N1ICD/PtenF/F mice: n = 4 for both control diet and Rosi diet. Bar, 30 µm. *, P < 0.05; **, P < 0.01; ***, P < 0.001. Bar graphs indicate mean ± SEM.
Figure 9.
Figure 9.
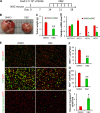
Notch inhibitor DBZ inhibits human DDLPS xenograft growth. (A) Experiment design, 10 µmol DBZ/kg body weight was administrated by i.p. injection every 2 d. (B) Image of human LPS246 xenograft tumors isolated from DMSO- or DBZ-treated NSG mice. (C) Tumor weight measurements: n = 5 for DMSO; n = 6 for DBZ. (D) Relative expression levels of NOTCH1 and its target genes in LPS246 xenograft. n = 6. (E–H) Immunofluorescent staining results of LPS246 xenograft cross sections. Bar, 40 µm. *, P < 0.05; **, P < 0.01. Bar graphs indicate mean ± SEM.

Similar articles

Cited by

References

    1. Abraham J., Nuñez-Álvarez Y., Hettmer S., Carrió E., Chen H.I., Nishijo K., Huang E.T., Prajapati S.I., Walker R.L., Davis S., et al. . 2014. Lineage of origin in rhabdomyosarcoma informs pharmacological response. Genes Dev. 28:1578–1591. 10.1101/gad.238733.114 - DOI - PMC - PubMed
    1. Ahmadian M., Suh J.M., Hah N., Liddle C., Atkins A.R., Downes M., and Evans R.M.. 2013. PPARγ signaling and metabolism: the good, the bad and the future. Nat. Med. 19:557–566. 10.1038/nm.3159 - DOI - PMC - PubMed
    1. Andersson E.R., Sandberg R., and Lendahl U.. 2011. Notch signaling: simplicity in design, versatility in function. Development. 138:3593–3612. 10.1242/dev.063610 - DOI - PubMed
    1. Aster J.C., Pear W.S., and Blacklow S.C.. 2008. Notch signaling in leukemia. Annu. Rev. Pathol. 3:587–613. 10.1146/annurev.pathmechdis.3.121806.154300 - DOI - PMC - PubMed
    1. Baird K., Davis S., Antonescu C.R., Harper U.L., Walker R.L., Chen Y., Glatfelter A.A., Duray P.H., and Meltzer P.S.. 2005. Gene expression profiling of human sarcomas: insights into sarcoma biology. Cancer Res. 65:9226–9235. 10.1158/0008-5472.CAN-05-1699 - DOI - PubMed

MeSH terms

Associated data