. 2016 Sep 12;38(5):453-62.
doi: 10.1016/j.devcel.2016.07.014. Epub 2016 Aug 25.

Oxidant Sensing by TRPM2 Inhibits Neutrophil Migration and Mitigates Inflammation

Affiliations

Oxidant Sensing by TRPM2 Inhibits Neutrophil Migration and Mitigates Inflammation

Gang Wang et al. Dev Cell. .

Abstract

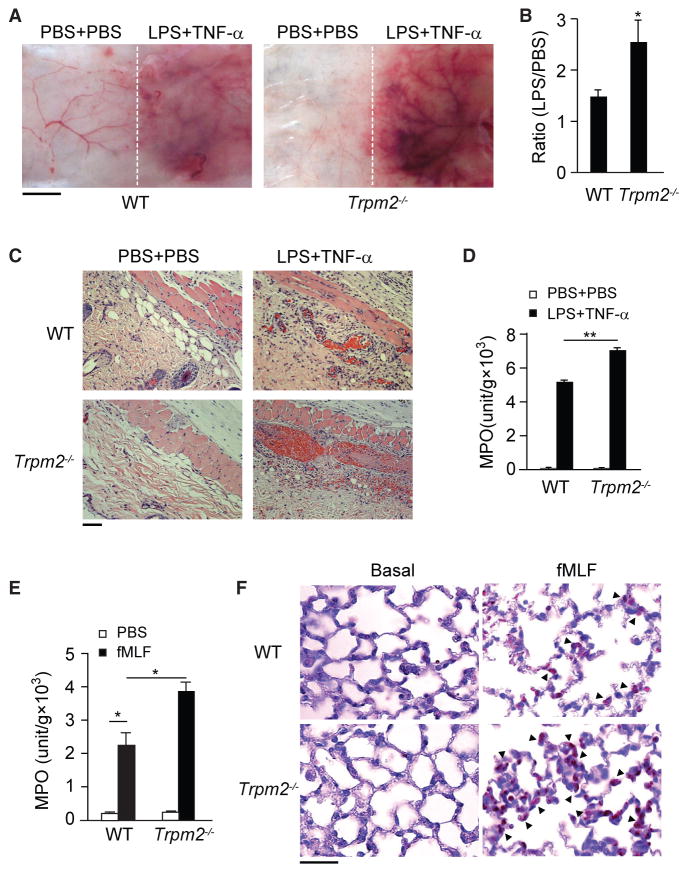
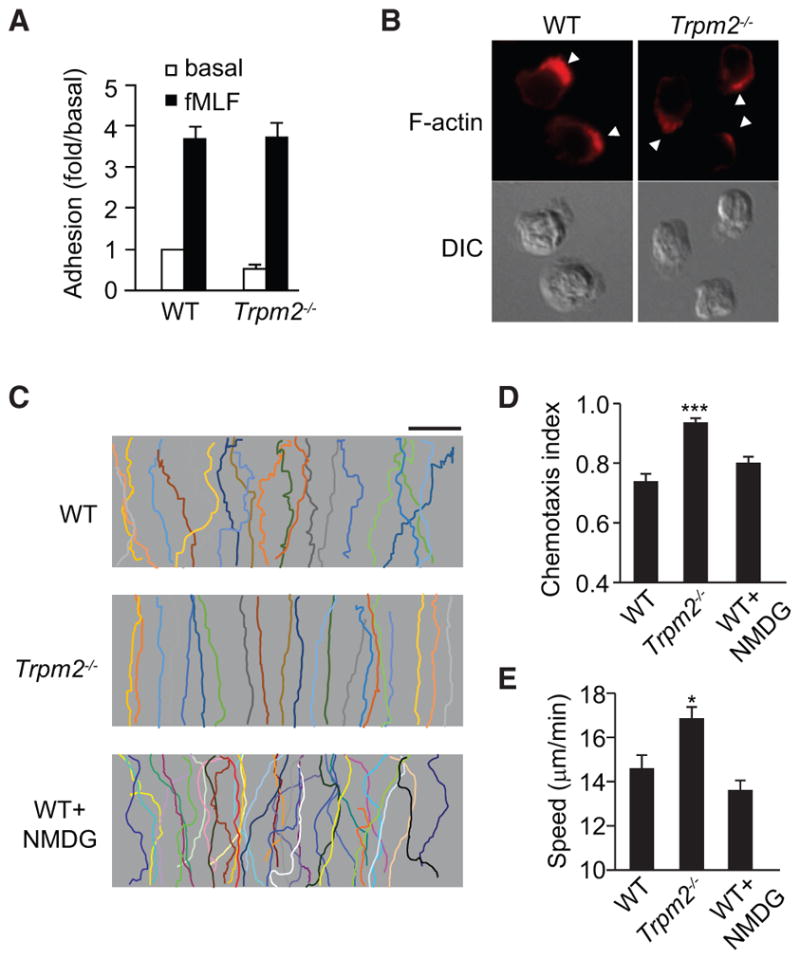
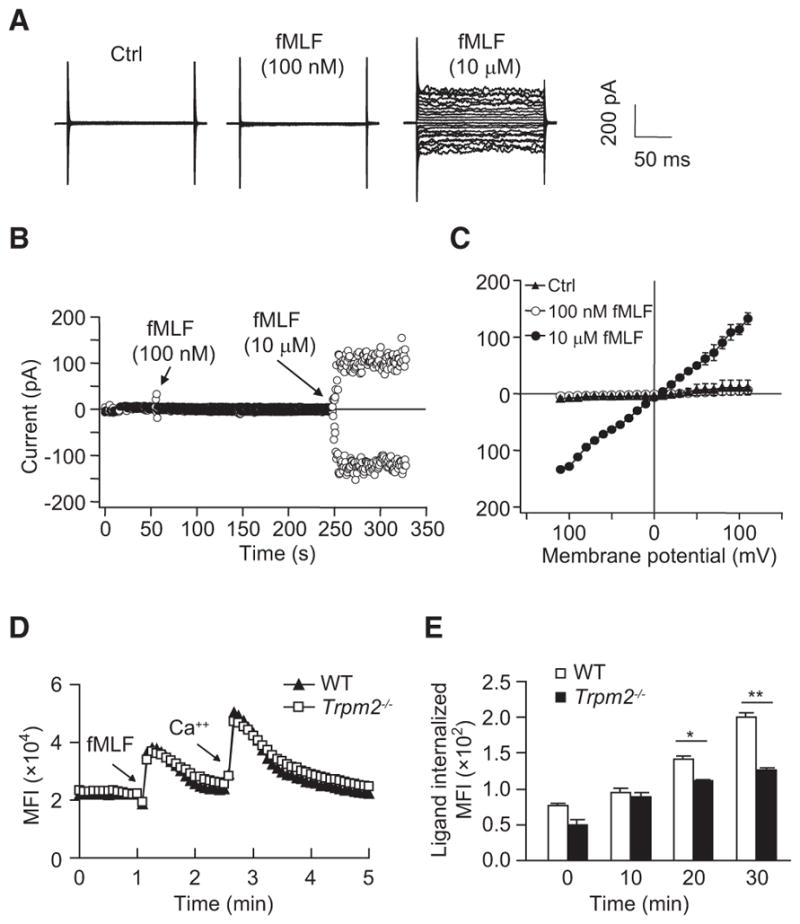
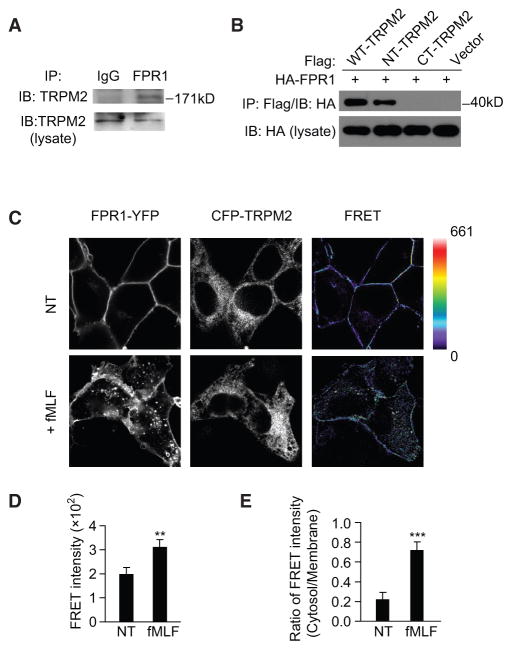
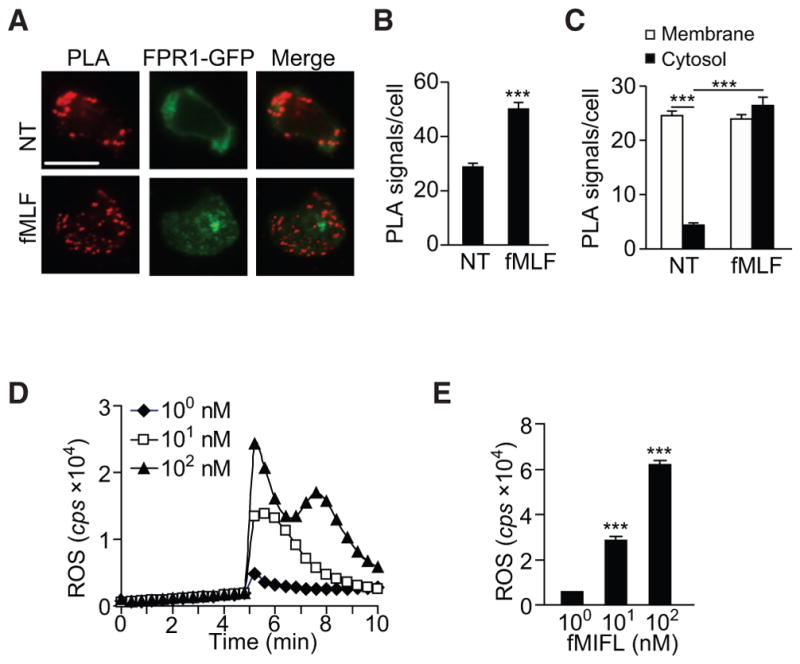
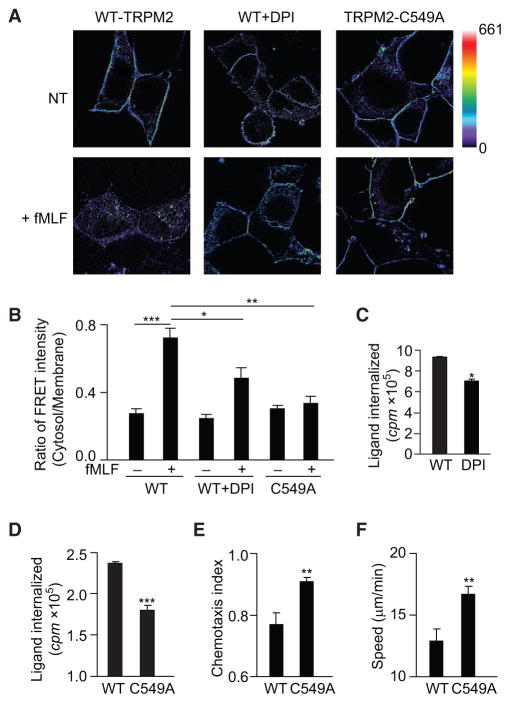
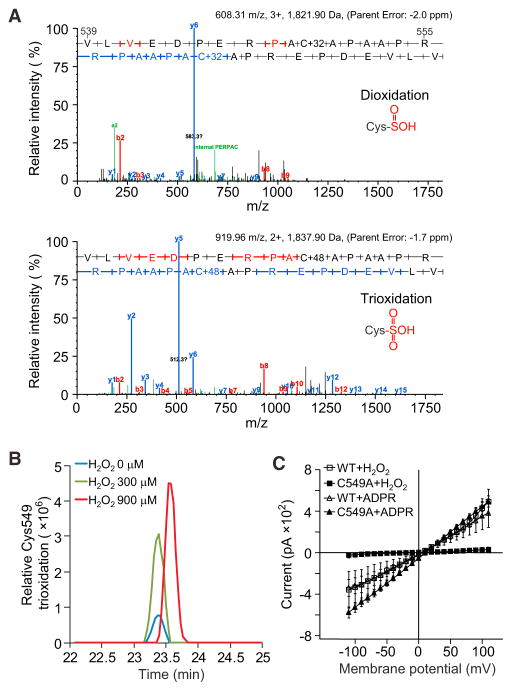
Blood neutrophils perform an essential host-defense function by directly migrating to bacterial invasion sites to kill bacteria. The mechanisms mediating the transition from the migratory to bactericidal phenotype remain elusive. Here, we demonstrate that TRPM2, a trp superfamily member, senses neutrophil-generated reactive oxygen species and restrains neutrophil migration. The inhibitory function of oxidant sensing by TRPM2 requires the oxidation of Cys549, which then induces TRMP2 binding to formyl peptide receptor 1 (FPR1) and subsequent FPR1 internalization and signaling inhibition. The oxidant sensing-induced termination of neutrophil migration at the site of infection permits a smooth transition to the subsequent microbial killing phase.


Figures

Figure 1
Figure 1. Deletion of TRPM2 Enhances Neutrophil-Mediated Vascular Injury
(A) LPS-induced microvascular injury in the classical local Shwartzman reaction (LSR) induced by consecutive injections of LPS followed by TNF-α. n = 3–4 mice per condition. Scale bar, 5 mm. (B) The extent of hemorrhage was determined in WT and Trpm2−/− mice through densitometric analysis of skin samples receiving either LPS or PBS injections. Mean ± SEM. *p < 0.05. (C) H&E-stained skin sections from WT (upper panels) and Trpm2−/− (lower panels) mice treated with LPS or PBS, as indicated, are shown. Erythrocyte extravasation, thrombus formation, and neutrophil accumulation are evident in the images from LPS-treated Trpm2−/− mice. Scale bar, 100 μm. (D) Tissue MPO activity in the skin of mice from the WT and Trpm2−/− groups. Mean ± SEM. **p < 0.01. (E) Tissue MPO activity in the lungs of WT and Trpm2−/− mice 4 hr after fMLF stimulation. Mean ± SEM. *p < 0.05 (Student’s t test). n = 3–4 mice per condition. (F) Naphthol AS-D chloroacetate staining of lung sections from WT and Trpm2−/− mice obtained after fMLF challenge. No neutrophils were observed in untreated mice (left panels). fMLF-treated Trpm2−/− mice (right panels) showed greater neutrophil infiltration in the lungs. Arrowheads indicate infiltrating neutrophils. Scale bar, 50 μm. Data are representative of (A), (C), and (F) or are from (B), (D), and (E) three independent experiments.
Figure 2
Figure 2. TRPM2 Inhibits Neutrophil Chemotaxis
(A) Adhesion of WT and Trpm2−/− neutrophils to MLVECs after fMLF stimulation. (B) Fluorescence microscopy (top row) and differential interference contrast (DIC) images (bottom row) of WT and Trpm2−/− neutrophils (n > 30 per group) stimulated with 100 nM fMLF for 2 min. Arrowheads indicate leading edges. (C) Trajectories of WT and Trpm2−/− neutrophils or WT neutrophils treated with NMDG (145 mM) in an fMIFL gradient of 100 nM (>30 cells per condition). Each trace represents the trajectory of one cell. Scale bar, 100 μm. (D and E) CI (D) and migration speed (E) of cells treated as described in (C). *p < 0.05, ***p < 0.01 compared with WT cells (Student’s t test). Data are representative of (B) and (C) or are from (A), (D), and (E) three independent experiments mean and SEM in (A), (D), and (E).
Figure 3
Figure 3. Channel-Independent Function of TRPM2 in Regulating Neutrophil Migration
(A) High fMLF concentration-induced nonselective cation current in HL60 cells. The raw whole-cell current induced with fMLF (100 nM or 10 μM) is shown. (B) Time course of the fMLF (100 nM or 10 μM)-induced current under a clamped membrane potential (+100 mV for outward current and −100 mV for inward current). The low fMLF (100 nM) concentration did not induce a cation current under these experimental conditions. (C) Summary of the results obtained in (A) and (B). The summary is presented as the current amplitudes for different testing voltages (I–V plot). Mean ± SEM. (D) Effects of fMLF on [Ca2+]i in WT and Trpm2−/− neutrophils. The extracellularCa2+ concentration was 1.26 mM. Arrows indicate when fMLF (100 nM) or Ca2+ (2 mM) was added. (E) Receptor internalization in WT and Trpm2−/− neutrophils stimulated with 100 nM fMLF at various time points, presented as the mean fluorescence intensity (MFI) of the internalized ligand. Mean ± SEM. *p < 0.05, **p < 0.01 (Student’s t test). Data are representative of (A), (B), and (D) or are from (C) and (E) three independent experiments.
Figure 4
Figure 4. TRPM2 Induces FPR1 Internalization
(A) Immunoblot (IB) analysis of the endogenous FPR1 and TRPM2 interaction in HL60 cells. (B) IB analysis of the interaction between HA-FPR1 and the FLAG-tagged full-length, N-terminal, or C-terminal fragment of TRPM2 in HEK293 cells. (C) Fluorescence images of HEK293 cells expressing FPR1-YFP and CFP-TRPM2 show acceptor (YFP), donor (CFP), and net FRET signals before and after treatment with 100 nM fMLF. The scale for the net FRET images was color coded to represent a pixel intensity unit range of 0–661. Images were collected and analyzed as described in Experimental Procedures. The images shown are 90 μm2. (D and E) Mean FRET intensity (D) and ratio of the mean FRET intensity (E) in the cytosol versus the plasma membrane before and after fMLF, as shown in (C). Mean ± SEM. **p < 0.01, ***p < 0.001 (Student’s t test). Data are representative of three independent experiments (A–C) or three experiments (D and E).
Figure 5
Figure 5. Proximity Ligation Assay Assessment of the Interaction between TRPM2 and FPR1
(A) Proximity ligation assay (PLA) detection of the TRPM2 and FPR1 interaction in stable FPR1-GFP-expressing HL60 cells before and after fMLF stimulation. Each red dot represents one FPR1 and TRPM2 interaction in HL60 cells. Scale bar, 10 μm. (B and C) Mean PLA signal/cell (B) and the ratio of the mean PLA signal in the cytosol versus the plasma membrane (C) before and after fMLF, as shown in (A). Mean ± SEM. ***p < 0.001 (Student’s t test). (D and E) Superoxide generation in WT mouse neutrophils after stimulation with different concentrations of fMIFL (1, 10, or 100 nM), determined in real time (D) or in total (E) based on luminol-ECL. cps, counts per second of light emitted. ROS, reactive oxygen species. Mean ± SEM. ***p < 0.001. Data are representative of three independent experiments (A and D) or three experiments (B, C, and E).
Figure 6
Figure 6. TRPM2 Senses ROS through Oxidation of Cys549
(A) FRET images of HEK293 cells expressing FPR1-YFP and CFP-TRPM2 in the presence and absence of DPI (10 mM, 30 min) or expressing FPR1-YFP and CFP-TRPM2-C549A before and after treatment with 100 nM fMLF. The scale in the net FRET images was color coded to represent a pixel intensity unit range of 0–661. The images shown are 90 μm2. (B) The ratio of the mean FRET intensity in the cytosol versus the plasma membrane before and after fMLF, as shown in (A). Mean ± SEM. *p < 0.05, **p < 0.01, ***p < 0.001 (Student’s t test). (C) Receptor internalization in neutrophils treated with DPI (10 μM, 30 min) and stimulated with 100 nM fMLF is presented as the counts per minute (cpm) of internalized ligand. Mean ± SEM. *p < 0.05 (Student’s t test). (D) Receptor internalization in WT-TRPM2- or TRPM2-C549A-expressing HL60 cells stimulated with 100 nM fMLF for 20 min is presented as the counts per minute (cpm) of internalized ligand. Mean ± SEM. ***p < 0.001 (Student’s t test). (E and F) CI (E) and migration speed (F) of WT-TRPM2- or TRPM2-C549A-expressing HL60 cells migrating in an fMLF gradient of 100 nM. Mean ± SEM. **p < 0.01 compared with WT cells (Student’s t test). Data are representative of three independent experiments (A) or from three experiments (B–F).
Figure 7
Figure 7. H2O2 Induces Oxidation of TRPM2 Cys549
(A) Tandem MS (MS/MS) spectra of peptides with Cys549 oxidation. The upper panel is an example of Cys549 di-oxidation, and the lower panel an example of Cys549 tri-oxidation. The peptide sequence is shown (V539–R555). Red and blue bars represent the peptide’s N-terminal (b series) and C-terminal (y series) fragment ions, respectively, within the MS/MS spectrum. (B) Relative abundance of Cys549 tri-oxidations in samples treated with 0, 300, and 900 μM H2O2. The area of each peak denotes the peptide intensity in the MS. (C) Whole-cell currents induced by H2O2 or ADPR were recorded in HL60 cells transfected with WT-TRPM2 or TRPM2-C594A using the patch-clamp technique. H2O2 was added to the bath solution (300 μM) and ADPR was added to the pipette solution (500 μM). Mean ± SEM. Data are representative of (A) and (B) or are from three independent experiments (C).

Comment in

Similar articles

Cited by

References

    1. Bender JG, McPhail LC, Van Epps DE. Exposure of human neutrophils to chemotactic factors potentiates activation of the respiratory burst enzyme. J Immunol. 1983;130:2316–2323. - PubMed
    1. Brozna JP. Shwartzman reaction. Semin Thromb Hemost. 1990;16:326–332. - PubMed
    1. Buelow B, Song Y, Scharenberg AM. The Poly(ADP-ribose) polymerase PARP-1 is required for oxidative stress-induced TRPM2 activation in lymphocytes. J Biol Chem. 2008;283:24571–24583. - PMC - PubMed
    1. Butcher EC. Leukocyte-endothelial cell recognition: three (or more) steps to specificity and diversity. Cell. 1991;67:1033–1036. - PubMed
    1. Chaubey S, Jones GE, Shah AM, Cave AC, Wells CM. Nox2 is required for macrophage chemotaxis towards CSF-1. PLoS One. 2013;8:e54869. - PMC - PubMed

LinkOut - more resources