. 2016 Aug 25;166(5):1308-1323.e30.
doi: 10.1016/j.cell.2016.07.054.

Comprehensive Classification of Retinal Bipolar Neurons by Single-Cell Transcriptomics

Affiliations

Comprehensive Classification of Retinal Bipolar Neurons by Single-Cell Transcriptomics

Karthik Shekhar et al. Cell. .

Abstract

Patterns of gene expression can be used to characterize and classify neuronal types. It is challenging, however, to generate taxonomies that fulfill the essential criteria of being comprehensive, harmonizing with conventional classification schemes, and lacking superfluous subdivisions of genuine types. To address these challenges, we used massively parallel single-cell RNA profiling and optimized computational methods on a heterogeneous class of neurons, mouse retinal bipolar cells (BCs). From a population of ∼25,000 BCs, we derived a molecular classification that identified 15 types, including all types observed previously and two novel types, one of which has a non-canonical morphology and position. We validated the classification scheme and identified dozens of novel markers using methods that match molecular expression to cell morphology. This work provides a systematic methodology for achieving comprehensive molecular classification of neurons, identifies novel neuronal types, and uncovers transcriptional differences that distinguish types within a class.


Figures

None
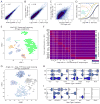
Histogram of the fraction of ‘T’ bases in the last UMI position for each cell barcode. Data from replicate 1 of Batch 1 of Drop-seq was used. For most cell barcodes (green), the fraction of ‘T’ at position 8 of the UMI barcode is drawn from a normal distribution centered around 0.25, consistent with a uniform distribution for all 4 bases. For a small number of the cell barcodes (~5%), a fixation of ‘T’ at the last UMI position is observed (blue).
Figure 1
Figure 1. Clustering of bipolar cells by Drop-seq
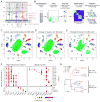
(A) Sketch of retinal cross-section depicting major resident cell classes. Rod and cone photoreceptors detect and transduce light stimuli into chemical signals, relaying this information to rod and cone bipolar cells (BCs), respectively (turquoise and purple/orange). BCs synapse on retinal ganglion cells (whose axons form the optic nerve) in the inner plexiform layer (IPL) at varying depths that depend on the BC type. (B) Overview of experimental strategy. Retinas from Vsx2-GFP mice were dissociated, followed by FAC sorting for GFP+ cells. Single cell libraries were prepared using Drop-seq and sequenced. Raw reads were processed to obtain a digital expression matrix (genes x cells). PCA, followed by graph clustering was used to partition cells into clusters, and identify cluster-specific markers, which were validated in vivo using methods that detect gene expression and cellular morphology in combination. (C)–(E) 2D visualization of single cell clusters using tSNE. Individual points correspond to single cells colored according to clusters identified by the (C) Louvain-Jaccard, and (D) Infomap algorithms, and numbered in decreasing order of size. Arrows in panels (C), (D) indicate a Louvain-Jaccard BC cluster that was partitioned by Infomap (examined in Figure 5). Panel (E) shows the clustering output of Infomap when applied on cells from a single Drop-seq experiment (50% of the dataset). The tSNE representation was only used for visualization, and not for defining clusters. (F) Gene expression patterns (columns) of major retinal class markers (left panels) and known BC type markers (right panels) in BC (upper panels) and non-BC clusters (lower panels) based on the clusters in panel C. Clusters with cell-doublet signatures, and that contained < 50 cells are not shown. Putative cell type assignments, based on the expression of known genes, are indicated on the right (see Table S2). Nomenclature for BC types 1 and 5 is based on results in Figures 3 and 4. The size of each circle depicts the percentage of cells in the cluster in which the marker was detected (≥1 UMI), and its color depicts the average transcript count in expressing cells (nTrans). MG = Müller glia, AC = amacrine cells, PR = photoreceptors). (G) Hierarchical clustering of average gene signatures of BC clusters based (euclidean distance metric, average linkage). The confidence level of each split was assessed using bootstrap (Methods and Resources). Relatedness between clusters was used in prospective cluster assignment to BC type in panel F. See also Figures S1–S3 and Tables S1–S2
Figure 2
Figure 2. Validation of markers for six BC types
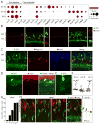
(A) Representative markers (columns) enriched in BC clusters (rows) predicted and validated in this study. Representation as in Figure 1F. (B–D) Validation of RBC-specific genes Vstm2b, Casp7, and Rpa1 by FISH combined with PKCα immunostaining, which marks RBCs. (E–I) Validation of new markers of BC3A, BC3B, BC4, BC6, and BC7 against cell morphology. Leftmost panels show representative drawings of these types based on EM reconstructions (Helmstaedter et al., 2013), middle panels show lentiviral labeling of single BCs combined with FISH for the indicated gene in retinal cross sections. Dashed lines are drawn from calretinin antibody labeling within sublaminae (S) 2, 3, and 4. Insets show localization of FISH signal within virus-labeled cell bodies. Rightmost panels show FISH labeling of cell bodies on retinal whole mounts. To reduce background puncta in the GFP+ lentivirus labeled cells, an outlier removal noise filter was applied (Methods and Resources). Scale bars indicate 20 μm for main panels and 10 μm for insets. See also Figures S4–S5 and Tables S3–S4.
Figure 3
Figure 3. BC1B is a non-canonical bipolar type
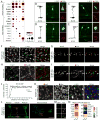
(A) Expression patterns of known BC and amacrine cell genes across BC1A, BC1B, and BC2 clusters, plus new BC1A and BC1B markers. Representation as in Figure 1F. (B) Pcdh17 (BC1A marker) and Wls (BC1B marker) label distinct populations of CFP-positive cells in the MitoP line. Pcdh17 labels cells with a bipolar morphology positioned in the bipolar cell layer (BCL), whereas Wls labels cells that lack an upward process and are positioned in the amacrine cell layer (ACL) (dashed grey line denotes the division between these two layers). Insets show example cells with or without an upward process. (C) BC1B cells (Vsx2+ Ppp1r17−) are distinct from nGnG amacrine cells (Vsx2− Ppp1r17+) (D–E) Lentiviral labeling and Vsx2 immunostaining shows that BC1B cells lack an upward process and laminate in S1 (D), in contrast to other bipolar types that laminate at a similar depth in the IPL (E). (F) Representative drawings based on EM reconstructions of BC1A, BC2, and BC1B (the latter identified post-hoc from (Helmstaedter et al., 2013)) (G–I) BC1B cells lose their apical process, and translocate to the ACL. G. BC1B cells (CFP+ Lhx3+) predominatly have a bipolar morphology at P6, by P17 most have become unipolar. See representative images in H and diagram of developmental events in I. Scale bars indicate 20 μm for main panels and 10 μm for insets. See also Figure S6.
Figure 4
Figure 4. Four BC5 types with distinct morphology and gene expression
(A) Expression patterns of known and novel BC5 genes across BC5A-BC5D clusters. Representation as in Figure 1F. (B–E) FISH+lentiviral labeling for BC5A-BC5D markers from A. Insets show localization of FISH within GFP+ cell body. Noise reduction was applied to GFP+ lentivirus labeled cells as in Figure 2. (F–K) BC5 types labeled in transgenic lines that report on genes highlighted in A. F. Kcng4-cre;stop-YFP retina whole-mounts labeled with GFP and Sox6 show co-localization in BC5A cells G. Kcng4-cre;Cdh9-lacZ retinal cross section labeled for lacZ and cre show near complete co-localization. H. BC5D cells are GFP+ and PkarIIβ− in Kirrel3-GFP retinas. GFP-low and PkarIIβ+ cells correspond to BC3B J. A density recovery profile (DRP) shows that BC5D cells are uniformly spaced compared to a density matched random population I. Kcng4-cre;Htr3a-GFP retinal cross section labeled for GFP and cre show near complete co-localization. J. Kcng4-cre;stop-YFP;Cntn5-lacZ retinas labeled for YFP, lacZ, and Nfia combinatorially mark BC5A-5C. (L,M) Kcng4-cre;Cntn5-lacZ retinas infected with AAV-stop-GFP marks the morphology BC5A (green and orange cells) and BC5D (cyan cell). L. Terminals are shown from the side (left) and en face (right). M. GFP and lacZ labeling of axon stalks distinguishes BC5A (lacZ+) from BC5D (lacZ−). Dashed lines drawn from choline acetyltransferase (ChAT) labeling of S2 and S4. Scale bars indicate 20 μm for main panels and 10 μm for insets. (N) Bulk RNA-seq of FAC sorted Htr3a-GFP cells shows BC5A and BC5D markers robustly expressed, but BC5B and BC5C markers are absent.
Figure 5
Figure 5. BC8 and BC9 are closely related but separable by unsupervised methods
(A) A magnified view of cluster 15 on the tSNE map in Figure 1C shows two subpopulations. Individual cells are colored by expression levels of ON cone BC genes (Grm6, Isl1, Scgn) and Cluster 15 enriched genes (Cpne9, Spock3, Seripini1). (B) BC9 cells labeled by the Clm-1 transgenic line are Cpne9+ (C) Single cells labeled by lentivirus combined with FISH. Cpne9 is expressed in some but not all BCs with wide axonal arbors laminating at low IPL depth, consistent with the presence of two populations, BC9 (Cpne9+) and BC8 (Cpne9). Insets show FISH and GFP labeling of the cell body. Noise reduction applied to GFP+ lentivirus labeled cells as in Figure 2. (D–E) Soma spacing in Cpne9 labeled retinal whole-mounts is indicative of Cpne9 marking a single type. E shows a density recovery profile derived from whole-mount (D), revealing uniform spacing with an exclusion zone of 14.3 μm, which is absent in density matched simulations of randomly distributed, non-overlapping cells of similar size. (F) Retinal whole-mounts with double FISH labeling for Cpne9 and Seripini1, reveals two populations, Cpne9+ Seripini1+ (BC9, indicated by solid outlines) and Cpne9 Seripini+ (BC8, indicated by dashed outlines). Scale bars indicate 20 μm for main panels and 10 μm for insets.
Figure 6
Figure 6. Drop-seq transcriptomes provides insights into BC function
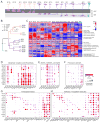
(A) Representative drawings of BC types validated in this study, drawn from EM reconstructions (Helmstadter et al., 2013). (B) Hierarchical clustering of BC clusters, similar to Figure 1G, now with identities of the BC1s, BC5s, and BC8 and 9 resolved based on results from Figures 3, 4, and 5, respectively. (C) Enrichment patterns of Gene Ontology (GO) categories in BC clusters based on the GO-PCA algorithm. Rows correspond to significantly enriched GO terms, while columns correspond to random averages of single-cell gene expression signatures arranged by cluster (200 per cluster, averaging was performed to mitigate single-cell noise). (D–H) Dotplots of functionally and developmentally relevant genes expressed by BC types. Representation as in Figure 1F. D. Glutamate receptors and ON pathway components. E Acetylcholine, GABA, and glycine receptors. F. Potassium channel subunits G. Transcription factors. H. Adhesion/recognition molecules. In panels D–H, only genes expressed in > 20% of cells in at least one BC cluster are shown.
Figure 7
Figure 7. Comparison of Drop-seq with Smart-seq2
(A) Bulk RNA-seq expression levels of 15,063 genes tightly correlate across two biological replicates (~10,000 cells each) processed using the Smart-seq2 method. (B) Gene expression levels averaged across 229 single cells (3 biological replicates) tightly correlate with the expression levels in the bulk libraries. (C) Single-cell averaged expression levels of Vsx2-GFP cells (log(Transcripts-per-million+ 1) units) correlate between Smart-seq2 and Drop-seq datasets (D) Sensitivity of transcript detection in single cell libraries as a function of Smart-seq2 bulk expression levels. Curves show results for Smart-seq2 (3 replicates), Drop-seq (6 replicates) and deep-sequenced Drop-seq and downsampled Smart-seq2 data. (E) Clustering and tSNE visualization of Smart-seq2 single-cell data. Each cell is labeled on the tSNE map by its random forest (RF) assigned cell type. The RF model assigned one of 18 possible types including 14 BC types (1A-8/9), RBC, Müller glia (MG), Amacrine cells (A), rod photoreceptors (R), cone photoreceptors (C) or unknown (N). (F) Top 30 differentially expressed (DE) genes in each BC type computed using a post hoc test on the Smart-seq2 data based on the RF-assigned labels. BC types with fewer than 3 cells in the data were excluded. Black bars on the right mark genes that were common among the top 30 DE genes for the corresponding Drop-seq clusters (Table S3). (G) tSNE visualization of Kcng4-GFP Smart-seq2 data (309 single cells). Each cell is represented on the tSNE map by its RF-assigned class label. (H–I) Violin plots showing expression of known and novel BC5A-D markers (identified in Drop-seq) in the BC5A, BC5D and BC7 clusters. See also Figure S7 and Table S5.

Similar articles

Cited by

References

    1. Baas D, Bumsted KM, Martinez JA, Vaccarino FM, Wikler KC, Barnstable CJ. The subcellular localization of Otx2 is cell-type specific and developmentally regulated in the mouse retina. Brain Res Mol Brain Res. 2000;78:26–37. - PubMed
    1. Berglund K, Schleich W, Krieger P, Loo LS, Wang D, Cant NB, Feng G, Augustine GJ, Kuner T. Imaging synaptic inhibition in transgenic mice expressing the chloride indicator, Clomeleon. Brain Cell Biol. 2006;35:207–228. - PMC - PubMed
    1. Blondel VD, Guillaume JL, Lambiotte R, Lefebvre E. Fast unfolding of communities in large networks. J Stat Mech-Theory E 2008
    1. Borghuis BG, Looger LL, Tomita S, Demb JB. Kainate receptors mediate signaling in both transient and sustained OFF bipolar cell pathways in mouse retina. J Neurosci. 2014;34:6128–6139. - PMC - PubMed
    1. Breiman L. Random forests. Mach Learn. 2001;45:5–32.

Publication types

Substances