. 2016 Aug 25;166(5):1117-1131.e14.
doi: 10.1016/j.cell.2016.07.032.

Oxygen Sensing by T Cells Establishes an Immunologically Tolerant Metastatic Niche

Affiliations

Oxygen Sensing by T Cells Establishes an Immunologically Tolerant Metastatic Niche

David Clever et al. Cell. .

Abstract

Cancer cells must evade immune responses at distant sites to establish metastases. The lung is a frequent site for metastasis. We hypothesized that lung-specific immunoregulatory mechanisms create an immunologically permissive environment for tumor colonization. We found that T-cell-intrinsic expression of the oxygen-sensing prolyl-hydroxylase (PHD) proteins is required to maintain local tolerance against innocuous antigens in the lung but powerfully licenses colonization by circulating tumor cells. PHD proteins limit pulmonary type helper (Th)-1 responses, promote CD4(+)-regulatory T (Treg) cell induction, and restrain CD8(+) T cell effector function. Tumor colonization is accompanied by PHD-protein-dependent induction of pulmonary Treg cells and suppression of IFN-γ-dependent tumor clearance. T-cell-intrinsic deletion or pharmacological inhibition of PHD proteins limits tumor colonization of the lung and improves the efficacy of adoptive cell transfer immunotherapy. Collectively, PHD proteins function in T cells to coordinate distinct immunoregulatory programs within the lung that are permissive to cancer metastasis. PAPERCLIP.


Figures

Figure 1
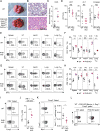
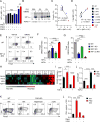
Figure 1. PHD proteins function within T cells to suppress spontaneous pulmonary inflammation
(A) Gross morphology of lungs from Egln1fl/fl Egln2fl/fl Egln3fl/fl CD4Cre+/− triple knockout (PHD-tKO) and Cre-negative wild-type (WT) littermate mice. (B) Hematoxylin and eosin (H&E) stains of WT and PHD-tKO lungs demonstrating diffuse alveolar hemorrhage (n=7 mice per group). (C) Histopathology scoring of lung tissue from WT and PHD-tKO mice (n = 7 mice per group). (D) Titers of hepatic AST and ALT and pancreatic amylase in the sera of WT and PHD-tKO mice (E–F) IFN-γ production by CD4+ T cells from spleen, small intestine lamina propria (LP), mediastinal lymph node (meLN), lung, and pulmonary tissue resident memory (TRM) cells in WT and PHD-tKO mice. Representative flow cytometry (E) and replicate values (F) are shown. Fold increase in frequency of CD4+ IFN-γ+ T cells in PHD-tKO mice normalized to WT is provided for each organ. (G–H) IFN-γ production by CD8+ T cells in the indicated organs in WT and PHD-tKO mice. Representative flow cytometry (G) and replicate values (H) are shown. Fold increase in frequency of CD8+ IFN-γ+ T cells in PHD-tKO mice normalized to WT is provided for each organ. (I) Frequency of pulmonary Foxp3+ Treg cells in WT and PHD-tKO mice. (J) Ratio of total numbers of CD4+ and CD8+ IFN-γ+ Teff cells to Foxp3+ Treg cells in the lungs of WT and PHD-tKO mice. (K) Distribution of Nrp-1 -Hi and -Lo populations amongst pulmonary Foxp3+ Treg cells in WT and PHD-tKO mice. Representative flow cytometry and absolute numbers of Nrp-1Lo Treg cells are shown. (L) Representative flow cytometry of Nrp-1 expression by WT and PHD-tKO pulmonary Foxp3+ Treg cells from WT and PHD-tKO mixed bone marrow chimeric mice. Data are representative of ≥ 2 independent experiments with ≥ 3 mice per genotype. Mice were analyzed at 3 months of age unless otherwise specified. Bars and error represent mean ±SEM of replicate measurements. *P<0.05, **P<0.01, ***P<0.001, ****P<0.0001 (Student’s t-test). See also Figure S1.
Figure 2
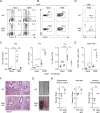
Figure 2. T cell-intrinsic PHD proteins restrain Th1 inflammation against innocuous antigens
(A–B) Flow cytometry analysis of Th1 and Th2 cytokine production (A) and Foxp3 expression (B) by pulmonary CD4+ T cells from naïve and house dust mite (HDM) challenged WT and PHD-tKO mice. (C) Total numbers of pulmonary Th2, Th1, and Treg cells in naïve and HDM challenged WT and PHD-tKO mice. (D–E) IFN-γ production by pulmonary CD8+ T cells from HDM challenged WT and PHD-tKO mice. Representative flow cytometry (D) and total numbers of CD8+ IFN-γ+ T cells (E) are shown. (F) Representative hematoxylin and eosin (H&E) stains of WT and PHD-tKO lungs following airway sensitization and challenge with house dust mite extract. a, arteriole; b, bronchiole. (G) Representative bronchoalveolar lavage fluid appearance from WT and PHD-tKO mice. (H) Histopathology scoring of lung tissue from HDM challenged WT and PHD-tKO mice Data are representative of ≥ 2 independent experiments with ≥ 3 mice per group. Bars and error represent mean ±SEM of replicate measurements. *P<0.05, **P<0.01, ***P<0.001, ****P<0.0001 (Student’s t-test). See also Figure S2.
Figure 3
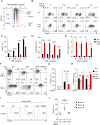
Figure 3. PHD proteins regulate reciprocal iTreg and Th1 differentiation programs
(A) Volcano plot of expressed transcripts (RPKM≥1) in PHD-tKO compared with WT CD4+ T cells stimulated in vitro. Transcripts significantly (p<0.01) over-expressed (FC≥2, red) and under-expressed (FC≤0.5, blue) in PHD-tKO cells are indicated. (B–D) Foxp3 and T-bet expression in WT and PHD-tKO CD4+ T cells stimulated in vitro in the presence of indicated amounts of TGF-β. Representative flow cytometry (B) and replicate values for Foxp3 (C) and T-bet (D) are shown. (E) ELISA quantification of IFN-γ in culture supernatants from WT and PHD-tKO CD4+ T cells stimulated as described in (B). (F–H) Foxp3 and T-bet expression in WT CD4+ T cells stimulated in vitro under the indicated environmental oxygen concentrations ± DMOG. Representative flow cytometry (F) and replicate values (G–H) shown. (I–J) Foxp3+ iTreg fate specification of human CD4+ T cells stimulated in vitro under the indicated environmental oxygen concentrations ± DMOG. Representative flow cytometry histograms (I) and replicate values are shown (J). Data are representative of ≥ 2 independent experiments. Bars and error represent mean ±SEM of replicate measurements. *P<0.05, **P<0.01, ***P<0.001, ****P<0.0001 (Student’s t-test). See also Figure S3.
Figure 4
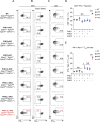
Figure 4. PHD proteins are functionally redundant in T lymphocytes
(A–B) Phenotype of pulmonary CD4+ T cells in mice with indicated PHD protein deficiency. Representative flow cytometry of IFN-γ expression (A) and Nrp-1 expression by Foxp3+ Treg cells (B). (C–D) IFN-γ expression by pulmonary CD8+ T cells in mice with indicated PHD protein deficiency. Representative flow cytometry (C) and replicate values (E) are shown. (E) Ratio of CD4+ IFN-γ+ Teff cells to Nrp-1Lo Foxp3+ Treg cells of total pulmonary CD4+ T cells in mice with the indicated PHD protein deficiency. Data are representative of ≥ 2 independent experiments with ≥ 3 mice per genotype. Bars and error represent mean ±SEM of replicate measurements. *P<0.05, ***P<0.001 (Student’s t-test). See also Figure S4.
Figure 5
Figure 5. PHD proteins control T cell differentiation through repression of HIF-driven glycolytic metabolism
(A) Flow cytometry detection of HIF1α expression in CD4+ T cells isolated from mice with the indicated PHD KO genotype and stimulated in vitro. Average HIF1α MFI is shown. (B) Immunoblot of HIF1α and HDAC1 from nuclear lysate of WT CD4+ T cells stimulated in vitro in the indicated environmental oxygen concentrations ± DMOG. Numbers indicate densitometry quantification of HIF1α band intensity relative to HDAC1 loading control. All values are normalized to HIF1α/HDAC1 density in cells stimulated in 20% oxygen in the absence of DMOG (Lane 1). (C–D) Correlation between HIF1α and Foxp3 (C) and T-bet (D) expression in CD4+ T cells isolated from the indicated PHD KO genotype and stimulated as described in (A). (E) Representative flow cytometry of Foxp3 and T-bet expression in WT and HIF1,2α double knockout (HIF1,2 dKO) CD4+ T cells stimulated in vitro in the presence of TGF-β ± DMOG. (F–G) Foxp3 (F) and T-bet (G) expression in CD4+ T cells isolated from HIF1α sKO, HIF2α sKO, HIF1,2α dKO, or WT mice and stimulated in vitro in the presence of TGF-β ± DMOG. Protein expression levels in DMOG treated cells are normalized to vehicle. Black dots represent biologic replicates. (H) mRNA expression of glycolytic genes in CD4+ T cells isolated from the indicated PHD KO genotype and stimulated in vitro. Heatmap normalized to row minimum and maximum for each gene. (I–J) ECAR (I) and OCR:ECAR ratio (J) as determined by Seahorse bioassay in CD4+ T cells isolated from WT and PHD-tKO mice and stimulated in vitro. (K) Foxp3 and T-bet expression in WT and PHD-tKO CD4+ T cells stimulated in vitro in the presence of TGF-β with or without the addition of compounds which inhibit glycolysis directly (2-DG) or indirectly (Rapamycin). (L) IFN-γ ELISA from supernatants of WT and PHD-tKO CD4+ T cells stimulated in vitro as described in (K). Data are representative of ≥ 2 independent experiments. Bars and error represent mean ±SEM of replicate measurements. *P<0.05, **P<0.01, ***P<0.001, ****P<0.0001 (Student’s t-test). See also Figure S5.
Figure 6
Figure 6. T cell-intrinsic expression of PHD proteins licenses tumor colonization of the lung
(A) Experimental schema of primary subcutaneous and secondary pulmonary tumor colonization in WT and PHD-tKO mice. (B) Growth kinetics of subcutaneous B16 melanoma in PHD-tKO or WT mice. (C) Gross morphology and H&E analysis of lungs from PHD-tKO or WT mice following intravenous injection of B16 melanoma. Micrometastatic lesions are outlined in red. (D–E) Quantification of total metastatic nodules (D) and total area of tumor burden (E) in lung H&E sections from mice described in (C). (F–H) Foxp3 and IFN-γ expression in CD4+ T lymphocytes isolated from the spleen and lungs of PHD-tKO and WT mice following IV B16 melanoma injection. Representative flow cytometry (D) and replicate values for Foxp3 (F) and IFN-γ (G) are shown. (I) Quantification of pulmonary tumor nodules in PHD-tKO or WT mice injected intravenously with B16 melanoma and administered IFN-γ neutralizing or IgG control antibodies. Data are representative of ≥ 2 independent experiments with > 5 mice per group. Bars and error represent mean ±SEM of replicate measurements. *P<0.05, **P<0.01, ***P<0.001, ****P<0.0001 (Student’s t-test).
Figure 7
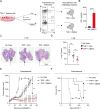
Figure 7. Inhibition of PHD proteins improves adoptive cell transfer immunotherapy
(A) Experimental schema of adoptive cell transfer immunotherapy (ACT). Pre-transfer levels of T-bet and Foxp3 expression is shown. (B) IFN-γ ELISA from culture supernatants of TRP-1 splenocytes stimulated in vitro ± DMOG. (C–D) Pulmonary tumor burden in mice receiving ACT of indicated cells. Representative H&E (C) and total lung tumor metastatic nodules (D) are shown. Black arrows indicate representative area of tumor burden. (E–F) Subcutaneous tumor growth in mice receiving ACT of indicated cells. Tumor area (E) and overall survival (F) are shown. Survival significance was assessed by a Log-rank Mantel-Cox test. Data are representative of ≥ 2 independent experiments with > 5 mice per group. Bars and error represent mean ±SEM of replicate measurements. **P<0.01, ****P<0.0001 (Student’s t-test). See also Figure S6.

Similar articles

Cited by

References

    1. Arpaia N, Campbell C, Fan X, Dikiy S, van der Veeken J, deRoos P, Liu H, Cross JR, Pfeffer K, Coffer PJ, et al. Metabolites produced by commensal bacteria promote peripheral regulatory T-cell generation. Nature. 2013;504:451–455. - PMC - PubMed
    1. Atarashi K, Tanoue T, Shima T, Imaoka A, Kuwahara T, Momose Y, Cheng G, Yamasaki S, Saito T, Ohba Y, et al. Induction of colonic regulatory T cells by indigenous Clostridium species. Science. 2011;331:337–341. - PMC - PubMed
    1. Bluestone JA, Abbas AK. Natural versus adaptive regulatory T cells. Nature reviews Immunology. 2003;3:253–257. - PubMed
    1. Bruick RK, McKnight SL. A conserved family of prolyl-4-hydroxylases that modify HIF. Science. 2001;294:1337–1340. - PubMed
    1. Chang CH, Curtis JD, Maggi LB, Jr, Faubert B, Villarino AV, O’Sullivan D, Huang SC, van der Windt GJ, Blagih J, Qiu J, et al. Posttranscriptional control of T cell effector function by aerobic glycolysis. Cell. 2013;153:1239–1251. - PMC - PubMed

Publication types

MeSH terms