. 2016 Aug 26:7:12646.
doi: 10.1038/ncomms12646.

VCP recruitment to mitochondria causes mitophagy impairment and neurodegeneration in models of Huntington's disease

Affiliations

VCP recruitment to mitochondria causes mitophagy impairment and neurodegeneration in models of Huntington's disease

Xing Guo et al. Nat Commun. .

Abstract

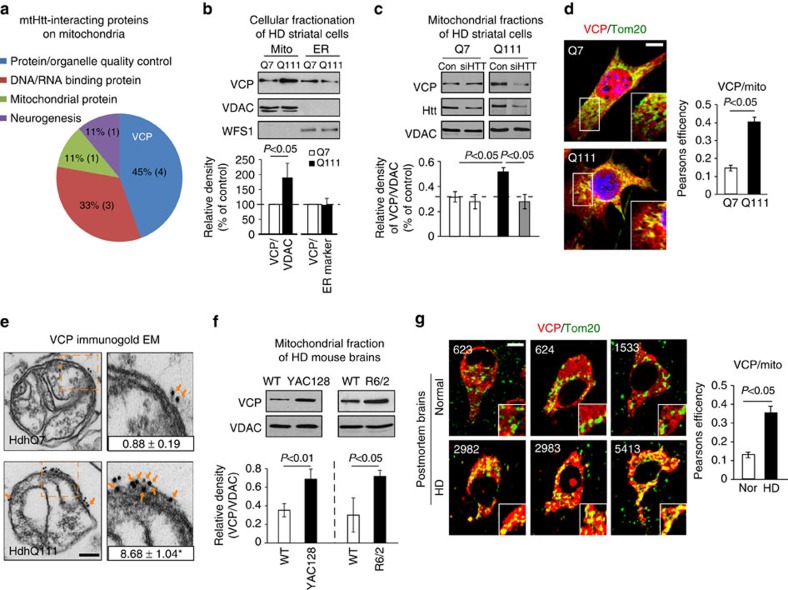
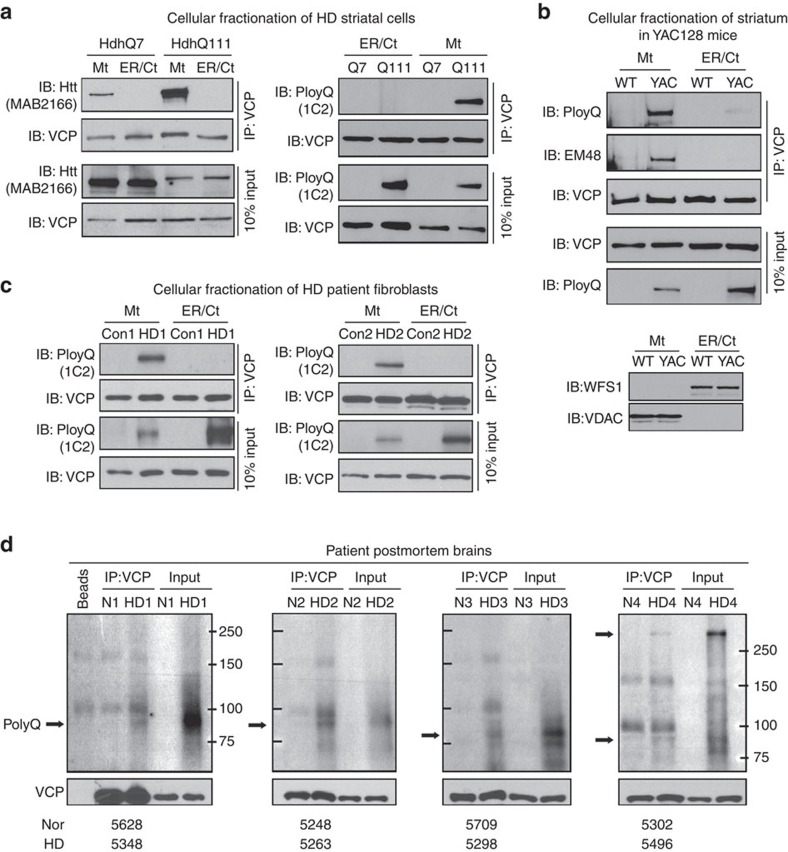
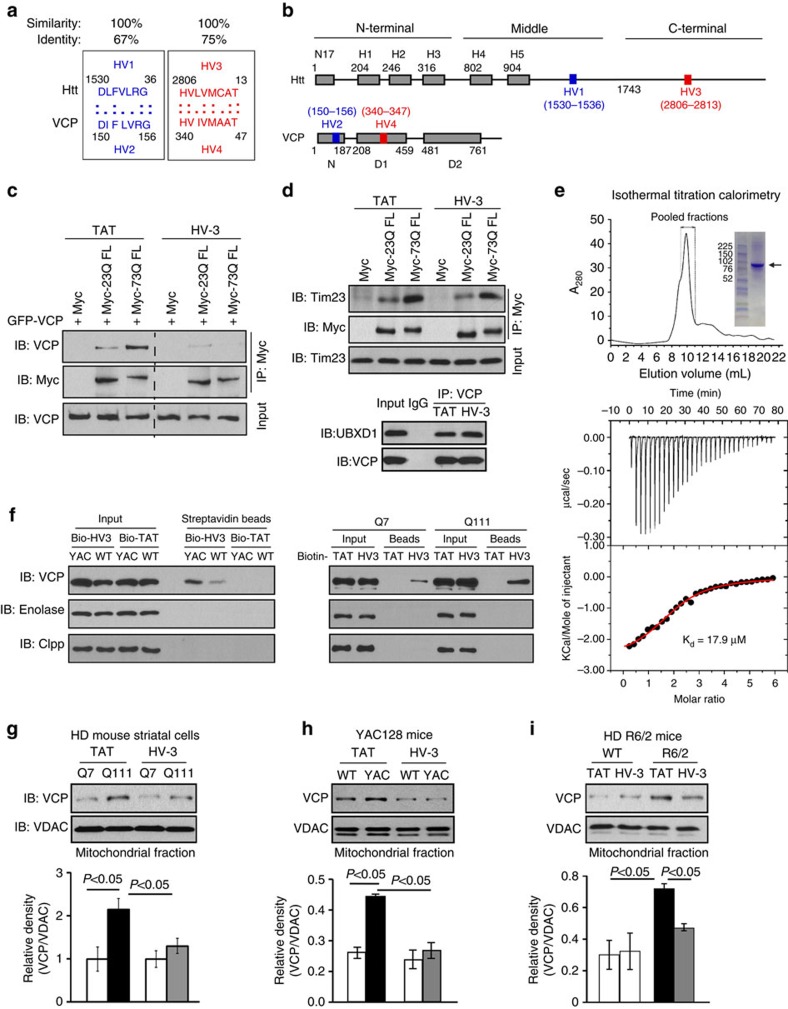
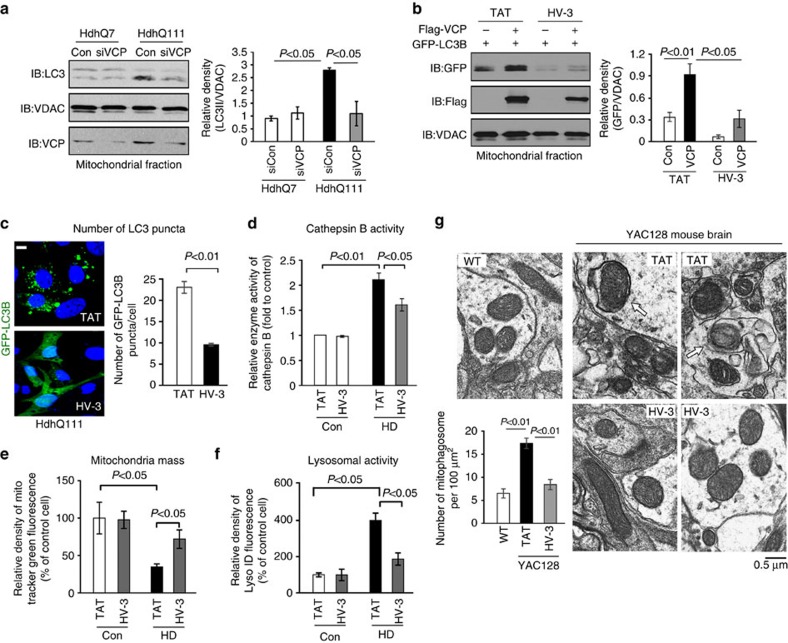
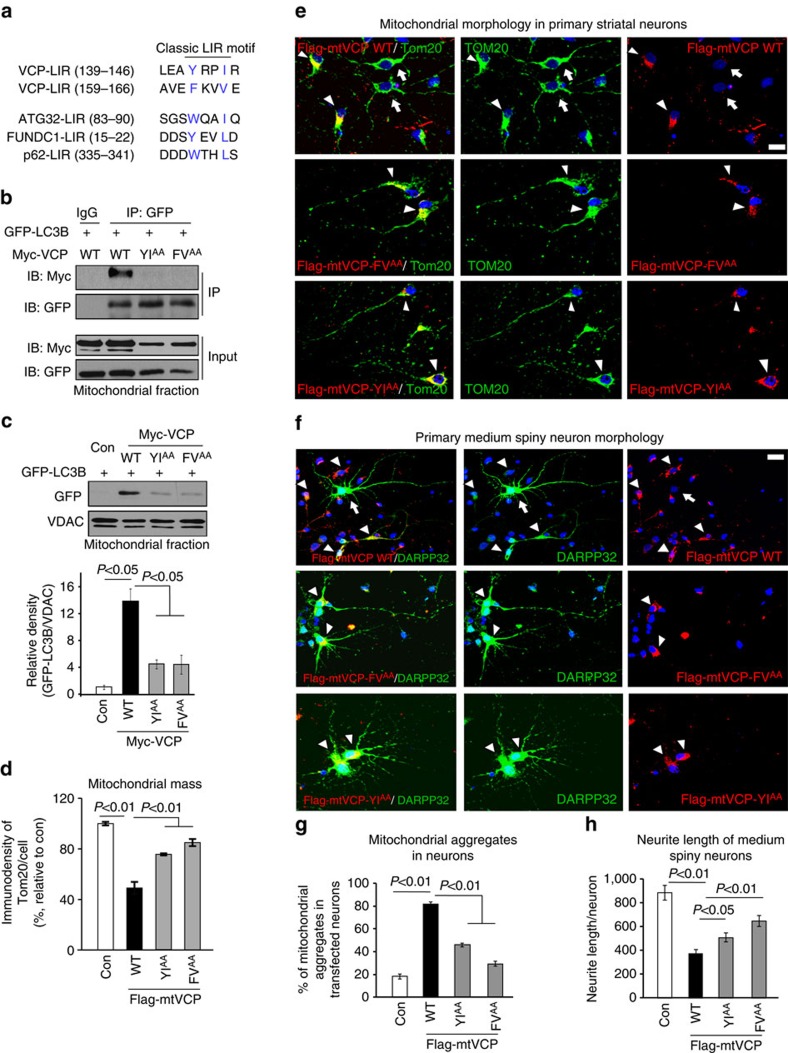
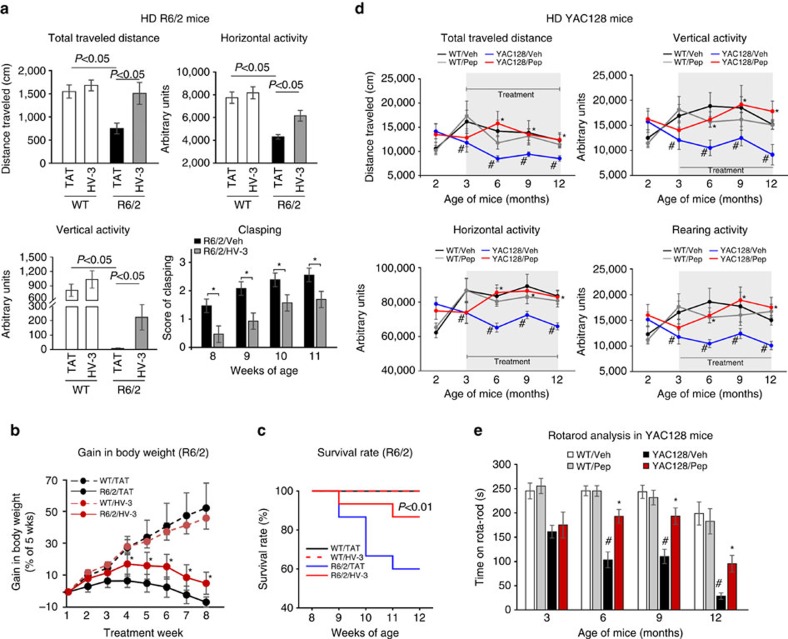
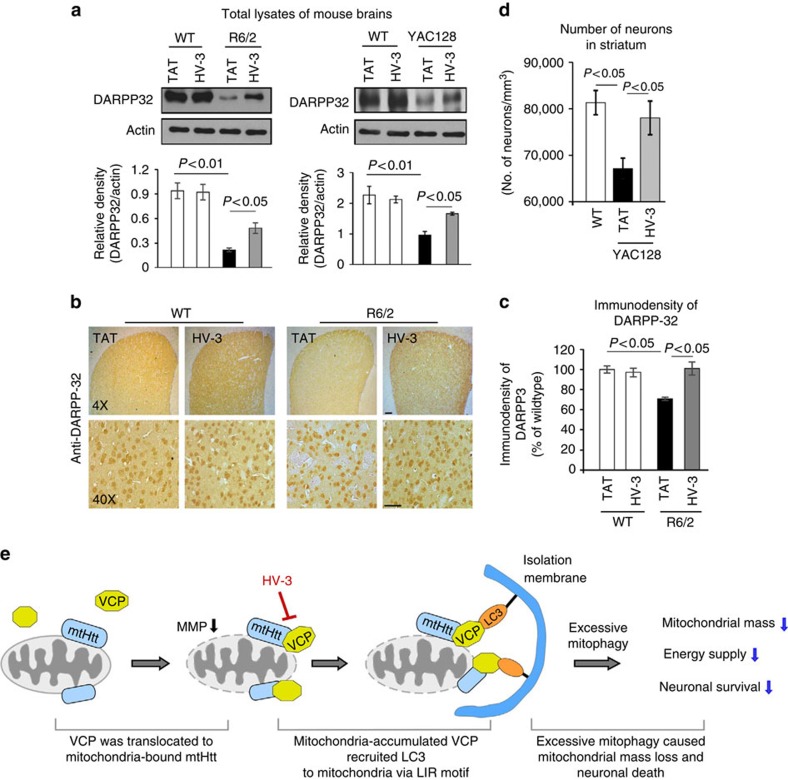
Mutant Huntingtin (mtHtt) causes neurodegeneration in Huntington's disease (HD) by evoking defects in the mitochondria, but the underlying mechanisms remains elusive. Our proteomic analysis identifies valosin-containing protein (VCP) as an mtHtt-binding protein on the mitochondria. Here we show that VCP is selectively translocated to the mitochondria, where it is bound to mtHtt in various HD models. Mitochondria-accumulated VCP elicits excessive mitophagy, causing neuronal cell death. Blocking mtHtt/VCP mitochondrial interaction with a peptide, HV-3, abolishes VCP translocation to the mitochondria, corrects excessive mitophagy and reduces cell death in HD mouse- and patient-derived cells and HD transgenic mouse brains. Treatment with HV-3 reduces behavioural and neuropathological phenotypes of HD in both fragment- and full-length mtHtt transgenic mice. Our findings demonstrate a causal role of mtHtt-induced VCP mitochondrial accumulation in HD pathogenesis and suggest that the peptide HV-3 might be a useful tool for developing new therapeutics to treat HD.


Conflict of interest statement

A patent on the design and applications of the HV-3 peptide inhibitor has been filed. The authors declare no conflict of interest.

Figures

Figure 1
Figure 1. VCP is recruited to mitochondria in HD models.
(a) Affinity purification followed by tandem mass spectrometry analysis was conducted to identify mtHtt-binding proteins on mitochondria in HdhQ7 and HdhQ111 striatal cells. The molecular and cellular function of the exclusive mtHtt interactors on mitochondria of HdhQ111 cells are shown. VCP was the leading candidate for an mtHtt-binding protein (Supplementary Fig. 1). (b) Mitochondrial and ER fractions were isolated from HdhQ7 and HdhQ111 cells. Protein levels of VCP were analysed by western blotting (WB). VDAC and WFS1 were used as loading controls for mitochondria and ER. Data are mean±s.e.m. of at least three independent experiments. (c) Control siRNA (Con) and Htt siRNA (siHTT) were transfected in HdhQ7 and HdhQ111 cells for 3 days, respectively. VCP levels were determined in mitochondrial fractions by WB analysis. VDAC was a loading control. Data are mean±s.e.m. of at least three independent experiments (One-way ANOVA with Holm-Sidak post hoc test). (d) HdhQ7 and HdhQ111 cells were stained with anti-Tom20 (green, a mitochondrial marker) and anti-VCP (red) antibodies. VCP/Tom20 co-localization was examined using confocal microscopy. Scale bar: 10 μm. Pearson's co-efficiency was calculated. At least 100 cells per group were counted. Data are mean±s.e.m. of three independent experiments. (e) Immunogold electron microscopy analysis of VCP on mitochondria was conducted. Scale bar: 100 nm. The number of gold particles labelling VCP was quantitated and shown as mean±s.e.m. A total of 30 mitochondria from each group were counted. *P<0.01 versus HdhQ7 cells. (f) Mitochondria were isolated from the striata of either HD transgenic mice R6/2 (9-week-old) or YAC128 (6-month-old). n=6 mice/group. VCP levels were determined by WB (loading control: VDAC). (g) Paraffin-embedded sections (5 μm thick) of the caudate nucleus from three HD patients (ID: 2982, 2983 and 5413) and three normal subjects (ID: 623, 624 and 1533) were immunostained with anti-VCP (red) and anti-Tom20 (green) antibodies. Localization of VCP on mitochondria was examined using confocal microscopy. Pearson's co-efficiency was calculated. Scale bar: 10 μm. Data are mean±s.e.m. (b,dg) Paired Student's t-test.
Figure 2
Figure 2. VCP binds to mtHtt on mitochondria in vitro and in vivo.
(a) Mitochondrial, ER, and cytosolic fractions (Ct) of HdhQ7 and HdhQ111 mouse striatal cells were subjected to immunoprecipitation (IP) with anti-VCP antibody, and immunoprecipitates were analysed by WB with anti-VCP and anti-MAB2166 antibody (recognizes both wt and mtHtt, left panel) or anti-1C2 antibody (recognizes mtHtt, right panel). Note that polyQ protein above 250 kDa is shown in the right panel. Representative blots from three independent experiments are shown. (b) Mitochondrial, ER, and cytosolic fractions were isolated from striata of YAC128 and wild-type mice at the age of 6 months. IP with anti-VCP antibody followed by anti-1C2 antibody or anti-EM48 antibody was performed. The right panel indicates the purity of ER and mitochondrial fractions isolated from YAC128 mouse striata. WFS1 and VDAC were used to label ER and mitochondria, respectively. n=4 mice/group. (c) Mitochondrial, ER and cytosolic fractions were isolated from fibroblasts of HD patients (HD1 carries 70 CAG repeats and HD2 carries 60 CAG repeats, respectively) and normal subjects. IP with anti-VCP antibody followed by WB with anti-1C2 antibody was conducted. Representative blots from two independent experiments are shown. (d) Total cortical protein lysates from postmortem brain tissues of 4 normal subjects and 4 HD patients were subjected to IP with anti-VCP antibody followed by WB with anti-1C2 antibody. Arrows indicate mtHtt recognized by 1C2 antibody which does not detect wt Htt. Note: mtHtt protein around 82 kDa recognized by 1C2 antibody has been shown to be abundant in cortical tissues of HD mice and HD patients. The identity numbers of the HD patients (HD) and normal subjects (Nor) were listed on the bottom. HD patients (5348 and 5263) exhibited extensive neuronal loss and severe brain atrophy, and HD patients (5298 and 5496) showed moderate neuronal loss and brain atrophy. The information of normal subjects and HD patients was summarized in Supplementary Fig. 2c. Normal subjects had no history of HD or other neurological diseases.
Figure 3
Figure 3. HV-3 peptide blocks Htt/VCP binding.
(a) Sequence of homology between VCP (human, AAI21795) and Htt (human, NP_002102). Amino acids are represented by the one-letter code; stars (*) indicate identical amino acids; Columns (:) indicate high similarity between amino acids. (b) Stick drawings of VCP and Htt main domains. Highlighted in the same colours are the two regions of homology between the two proteins, regions HV-1 and HV-3 in Htt and the corresponding regions HV-2 and HV-4 in VCP. (c) HEK293 cells were transfected with Myc-full-length Htt with 23 Q or 73Q (Myc-23Q FL or Myc-73Q FL) for 48 h following treatment with HV-3 or TAT (3 μM per day, each). The total lysates of cells were subjected to IP followed by WB with the indicated antibodies. (d) The total cell lysates were subjected to IP followed by WB in the indicated groups. (e) Gel filtration chromatogram and SDS-PAGE gel of recombinantly expressed and purified full-length mouse VCP/p97 (upper). Equilibrium binding isotherm for VCP titrated against HV-3 peptide at 15 °C (lower). Each downward spike is from a single injection of HV-3 into the sample cell. The heat exchanged during each injection is calculated from the area under the spike and fit to a binding isotherm. The Kd and n for HV-3 binding are 17.9±7 μM and 2.02±0.23, respectively. The values of ΔH and ΔS are −2.145±0.65 Kcal mol−1 and 13.97±3.4 cal mol−1 deg−1, respectively. (f) Biotin-conjugated HV-3 or TAT (10 μM, each) was incubated with total lysates of HD cells or YAC128 mouse brains. Immunoprecipitates were analysed by WB with the indicated antibodies. All Blots shown above are representative of three independent experiments. (g) HD cells were treated with TAT or HV-3 (3 μM per day for 3 days), n=3. (h) YAC128 or wild-type mice from 3–6 months of age and (i) R6/2 or wild-type mice from 5 to 9 weeks of age were received either TAT or HV-3 (3 mg kg−1 per day), n=6 mice/group. VCP mitochondrial levels were determined by WB. Loading control: VDAC. Data are mean±s.e.m. (gi) ANOVA with Holm-Sidak post hoc test.
Figure 4
Figure 4. HV-3 treatment reduces mitochondrial damage and cell death in HD cell cultures.
Mouse HdhQ7 and HdhQ111 striatal cells were treated with control peptide TAT or peptide HV-3 (3 uM/day for 3 days). (a) Left panel: Mitochondrial membrane potential (MMP) was determined by TMRM fluorescent dye. Right panel: HdhQ111 cells were transfected with control siRNA (siCon) and VCP siRNA (siVCP) for three days. The MMP was determined by TMRM in HdhQ111 cells treated with TAT or HV-3. (b) Mitochondrial morphology was determined by staining cells with anti-Tom20 antibody. Scale bar: 10 μm. The percentage of cells with fragmented mitochondria relative to the total number of cells was quantitated. At least 100 cells per group were counted. (c) Mitochondrial morphology was determined by EM. The length of mitochondria and the number of mitophagosomes were quantitated. At least 90 mitochondria per group were counted. (d) HD striatal cells were subjected to serum starvation for 24 h. HMGB1 release into culture medium was determined by IB analysis with anti-HMGB1 antibody. (e) HD striatal cells were subjected to serum starvation for 24 h. Cell death was determined by the release of LDH. Control and HD patient-iPS cell derived neurons were treated with HV-3 or TAT at 1 μM per day for 5 days starting 30 days after initiation of neuronal differentiation. (f) Left: Neurons were stained with anti-DARPP-32 and anti-Tuj-1 antibodies to indicate medium spiny neurons. Upper: a cluster of neurons; lower: individual neurons. Scale bar: 10 μm. (g) Quantitation of neurite length of medium spiny neurons. At least 50 neurons per group were counted by an observer blind to experimental conditions. (h) Left: the MMP was determined by TMRM fluorescent dye. Right: Mitochondria were stained by anti-Tom20 antibody. Mitochondrial length along neurites of DARPP32/Tuj1-positive neurons was quantitated. (i) Neuronal cell death induced by the withdrawal of the growth factor BDNF for 24 h was determined by the release of LDH. All data are mean±s.e.m. from at least three independent studies. ANOVA with Holm-Sidak post hoc test.
Figure 5
Figure 5. Treatment of HV-3 reduces excessive mitophagy in HD cell cultures and HD mouse brains.
(a) HdhQ7 and HdhQ111 cells were treated with control siRNA (con) or VCP siRNA (siVCP) for 48 h. Mitochondria were isolated and LC3 mitochondrial levels were determined by WB. Representative blots are from three independent experiments. The quantitation of LC3 II levels on mitochondria is provided on the right. VADC was used as a loading control. (b) Flag-VCP and GFP-LC3B were co-transfected into wild-type striatal cells. Mitochondria were isolated after 36 h of transfection. The GFP-LC3B levels on mitochondria were examined by WB. VDAC was used as a loading control. Representative blots are from three independent experiments. Histogram: quantitation of GFP-LC3B mitochondrial protein level. HdhQ7 and HdhQ111 cells were treated with control peptide TAT or peptide HV-3 (3 uM/day for 3 days). (c) HdhQ111 cells were transfected with GFP-LC3B for 24 h. The number of GFP-LC3B puncta was quantitated and shown in the histogram. Scale bars: 10 μm. (d) Enzyme activity of lysosomal Cathepsin B was measured using a Cathepsin B assay kit. Control and HD patient-iPS cell derived-neurons were treated with HV-3 or TAT at 1 μM per day for 5 days starting 30 days after neuronal differentiation. (e) Mitochondrial mass was measured by the fluorescent density of Mitotracker green. (f) Lysosomal activity was examined by staining neurons with Lyso-ID Red dye. (g) YAC128 mice and wild-type mice were treated with TAT or HV-3 (3 mg kg−1 per day) from the age of 3–9 months. EM analysis of striata from 9-month-old wild-type and YAC128 mice was performed. Arrows indicate mitophagosomes. Histogram: the number of mitophagosomes per 100 μm2 was counted and quantitated. Fifteen random areas in the striatum of each animal were analyzed. All the data are mean±s.e.m. of three independent experiments. ANOVA with Holm-Sidak post hoc test.
Figure 6
Figure 6. VCP causes excessive mitophagy by binding to LC3 via LIRs.
(a) Putative LIR sequences in VCP were aligned manually for comparison with the classical LIR motifs of ATG32, FUNDC1 and p62. The amino acids in blue indicate the conserved core residues of LIR. (b) GFP-LC3B was co-expressed with the indicated plasmids in HeLa cells. Mitochondrial lysates were subjected to IP with anti-GFP antibody, and immunoprecipitates were analysed by WB with anti-Myc and anti-GFP antibodies. Representative blots are from three independent experiments. (c) GFP-LC3B was co-transfected with the indicated plasmids in HeLa cells. Mitochondria were isolated and GFP-LC3B mitochondrial protein levels were determined by WB. Data are mean±s.e.m. from four independent studies. (d) HeLa cells were transfected with the indicated plasmids. Mitochondria were stained with anti-Tom20 antibody. Mitochondrial mass was determined by quantitating fluorescent density of Tom20 immunostaining. At least 100 cells per group were counted. Data are mean±s.e.m. from three independent studies. Primary rat striatal neurons (DIV 7) were transfected with either Flag-mtVCP-WT, or Flag-mtVCP-FVAA or Flag-mtVCP-YIAA plasmids for 3 days. (e) Neurons were stained with anti-Tom20 (green) and anti-Flag (red) antibodies. Mitochondrial morphology was examined by microscopy. (f) Medium spiny neurons were labelled with anti-DARPP-32 (green). Arrows indicate the cells that were not transfected with Flag-VCP. Arrowheads show the cells with transfected Flag-VCP. (g) Mitochondrial aggregates in neurons expressing Flag-mtVCP or Flag-mtVCP-FVAA or Flag-mtVCP-YIAA were quantitated. (h) Neuronal morphology was imaged and the neurite length of medium spiny neurons expressing Flag-mtVCP or Flag-mtVCP-FVAA or Flag-mtVCP-YIAA was quantitated. At least 50 neurons per group were counted by an observer blind to experimental conditions. Scale bars: 10 μm. All the data are mean±s.e.m. from three independent experiments. ANOVA with Holm-Sidak post hoc test.
Figure 7
Figure 7. HV-3 treatment reduces motor deficits in both R6/2 and YAC128 HD mice.
HD R6/2 mice and wild-type littermates were treated with either the control peptide or peptide HV-3 (at 3 mg kg−1 per day, subcutaneous administration with an Alzet osmotic pump) from 5 to 13 weeks of age (see treatment timeline in Supplementary Fig. 5a). (a) One hour of overall movement activity in R6/2 mice and wild-type littermates (total travelled distance, horizontal and vertical activities) was determined by locomotion activity chamber at the age of 13 weeks (n=15 mice per group). ANOVA with Holm-Sidak post hoc test. Hindlimb clasping was assessed with the tail suspension test once a week from the ages of 8 to 11 weeks (n=15 mice per group). *P<0.05 (Paired Student's t-test). Body weight (b) and survival (c) were recorded from the age of 5–13 weeks (n=15 mice per group). *P<0.05 versus HD mice treated with control peptide TAT. YAC128 mice and wild-type littermates were treated with the TAT or HV-3 peptides from the age of 3 to 12 months. Mouse behavioural and HD-associated pathology were determined every three months after beginning treatment (See treatment timeline in Supplementary Fig. 5a) (d) 24 h of general motility of YAC128 mice and wild-type littermates was monitored by a locomotion activity chamber at the indicated age (n=15–20 mice per group). #P<0.05 versus wild-type mice treated with TAT; *P<0.05 versus HD mice treated with TAT. (e) Rotarod performance of YAC128 and wild-type mice was evaluated at the indicated age (n=15–20 mice per group). #P<0.05 versus wild-type mice treated with TAT; *P<0.05 versus HD mice treated with TAT. (be) Repeated-measures two-way ANOVA with Bonferroni's post-hoc test. All data are expressed as mean±s.e.m.
Figure 8
Figure 8. HV-3 treatment reduces mitochondrial defects and neuropathology in HD mice.
(a) DARPP-32 protein levels were determined by WB of R6/2 (left) and YAC128 (right) mouse striatal extracts. Upper: representative IB; Lower: histogram of quantification of DARPP-32 levels. Actin was used as a loading control. Data are mean±s.e.m. n=6 mice/group. (b) Photomicrographs of DARPP-32 immunostaining were obtained from the dorsolateral striatum of TAT- or HV-3-treated R6/2 mice. Scale bar: 100 μm. (c) Quantitation of DARPP-32 immunodensity. Data are mean±s.e.m. n=6 mice/group. (d) Quantitation of NeuN-immunopositive cells in the dorsolateral striatum. Data are mean±s.e.m. n=6 mice/group. (a,c,d) ANOVA with Holm-Sidak post hoc test. (e) A summary scheme. VCP is selectively recruited to the mitochondria by interacting with mitochondria-bound mtHtt. Mitochondria-accumulated VCP acts as a mitophagic adaptor to bind to the autophagosome component LC3 via an LC3-interacting region (LIR motif). As a result, mtHtt-induced VCP association with mitochondria causes excessive mitophagy which results in mitochondrial mass loss, mitochondrial dysfunction and neuronal cell death. Blocking mtHtt to VCP binding on mitochondria by a selective peptide HV-3 inhibits VCP mitochondrial accumulation, which reduces excessive mitophagy and subsequent neuronal degeneration. Consequently, treatment with HV-3 both in HD cultures and in HD animals reduces HD-associated neuropathology.

Similar articles

Cited by

References

    1. The Huntington's Disease Collaborative Research Group. A novel gene containing a trinucleotide repeat that is expanded and unstable on Huntington's disease chromosomes. Cell 72, 971–983 (1993). - PubMed
    1. Graveland G. A., Williams R. S. & DiFiglia M. Evidence for degenerative and regenerative changes in neostriatal spiny neurons in Huntington's disease. Science 227, 770–773 (1985). - PubMed
    1. Costa V. & Scorrano L. Shaping the role of mitochondria in the pathogenesis of Huntington's disease. EMBO J. 31, 1853–1864 (2012). - PMC - PubMed
    1. Bossy-Wetzel E., Petrilli A. & Knott A. B. Mutant huntingtin and mitochondrial dysfunction. Trends Neurosci. 31, 609–616 (2008). - PMC - PubMed
    1. Guo X. et al.. Inhibition of mitochondrial fragmentation diminishes Huntington's disease-associated neurodegeneration. J. Clin. Invest. 123, 5371–5388 (2013). - PMC - PubMed

Publication types

MeSH terms