. 2016 Sep;18(9):941-53.
doi: 10.1038/ncb3402. Epub 2016 Aug 22.

Kank2 activates talin, reduces force transduction across integrins and induces central adhesion formation

Affiliations

Kank2 activates talin, reduces force transduction across integrins and induces central adhesion formation

Zhiqi Sun et al. Nat Cell Biol. 2016 Sep.

Abstract

Integrin-based adhesions play critical roles in cell migration. Talin activates integrins and flexibly connects integrins to the actomyosin cytoskeleton, thereby serving as a 'molecular clutch' that transmits forces to the extracellular matrix to drive cell migration. Here we identify the evolutionarily conserved Kank protein family as novel components of focal adhesions (FAs). Kank proteins accumulate at the lateral border of FAs, which we term the FA belt, and in central sliding adhesions, where they directly bind the talin rod domain through the Kank amino-terminal (KN) motif and induce talin and integrin activation. In addition, Kank proteins diminish the talin-actomyosin linkage, which curbs force transmission across integrins, leading to reduced integrin-ligand bond strength, slippage between integrin and ligand, central adhesion formation and sliding, and reduced cell migration speed. Our data identify Kank proteins as talin activators that decrease the grip between the integrin-talin complex and actomyosin to regulate cell migration velocity.


Conflict of interest statement

COMPETING FINANCIAL INTERESTS

The authors declare no competing financial interests.

Figures

Figure 1
Figure 1
Kank2 is a novel FA protein. (a) Western blot showing kindlin-2, talin-1, Dab-2, Src and Kank2 binding to biotinylated β1 and β3 integrin tail peptides. Peptides with scrambled amino-acid sequences (β1 scr tail; β3 scr tail) were used as negative controls. WT, wild type. Wcl, whole cell lysate. (b) Mouse fibroblasts seeded on FN for 3 h in the presence or absence of blebbistatin and immunostained for Kank2 (green) and kindlin-2 (red). Full arrowheads indicate Kank2-positive puncta along the FA border; open arrowheads indicate NAs. Scale bar, 10 µm. (c) Line profile analysis of cells immunostained for Kank2 and talin or vinculin along depicted line scans. Scale bar, 1 µm. (d) Definition of the FA belt at the lateral FA border and the distance from the FA border to proteins in proximity to the FA (outside of FAs) along the depicted line scan. (e) Kank2-positive puncta localize to the FA border defined by ILK, kindlin-2, vinculin, talin and paxillin (mean ± s.d.; n = 8 FAs for each marker, data pooled from eight cells). Unprocessed original scans of blots are shown in Supplementary Fig. 9.
Figure 2
Figure 2
Kank2 is targeted to FAs through the KN motif. (a) Domain organization of the Kank2 protein and illustration of GFP-tagged Kank2 truncation/deletion mutants. (b) Staining of paxillin (Pxn), F-actin (phalloidin), GFP-tagged Kank2 and DAPI (grey). Scale bar, 10 µm. (c) Line profile analysis of GFP-tagged FL-Kank2, Kank2ΔKN, Kank2Δcoil and Kank2(1–670) together with Pxn. Scale bar, 1 µm. (d) Line profile quantification of the distance between FL-Kank2, Kank2ΔKN, Kank2Δcoil and Kank2(1–670) to the FA border (mean ± s.d.; n = 8 FAs for each Kank2 construct, pooled from eight cells; P value calculated using Student’s t test). (e) Ratios between fluorescence intensities within the FA centre and on the FA belt for FL-Kank2, Kank2Δcoil and Kank2(1–670) (mean ± s.d.; n = 20 FAs for each Kank2 construct pooled from 10 cells; P value calculated using one-way ANOVA Tukey test).
Figure 3
Figure 3
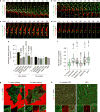
Kank2 curbs cell migration by inducing adhesion sliding. (a) Time-lapse images of peripheral FAs in Kank2-depleted fibroblasts stably expressing FL-Kank2-GFP and paxillin-TagRFP (Pxn-TagRFP) 45 min after plating on FN. Arrowheads highlight recruitment of Kank2 to proximal borders of FAs (full arrowheads) and the developing sliding adhesions (open arrowheads). (b) Time-lapse images of cells during the migration phase 4 h after plating on FN. Full arrows highlight the recruitment of Kank2-GFP to proximal borders of mature FAs behind the lamella, and open arrowheads highlight the dynamic formation of the Kank2-positive FA belt followed by conversion into thin, elongated sliding adhesions. Dashed lines indicate the cell leading edge. (c, d) Time-lapse images of peripheral FAs in Kank2-depleted cells stably expressing Kank2ΔKN-GFP and Pxn-TagRFP 45 min after plating on FN. Arrowheads highlight the proximal border of a stable FA (c) and disassembling FA (d) behind the lamella. Scale bars in ad, 5 µm. (e) Sliding velocities of central adhesions and FAs from indicated cells (mean ± s.d.; n = 5 cells pooled from three independent experiments, >400 central adhesions and >100 peripheral adhesions analysed for each condition). (f) 2D random migration velocities on FN (dot plot and box plot with median, 95% confidence interval (CI) notch, first–third quantile box and 5th–95th percentile whiskers; n between 60 and 90 cells for each cell line; data aggregated over four independent experiments). P values calculated using one-way ANOVA Tukey test in e and Kruskal–Wallis test in f. (g) Kank2-depleted cells re-expressing FL-Kank2-GFP were plated on FN-coated (10 µg ml−1) coverslips for 1 h or 5 h and immunostained for FN and DAPI. Scale bar, 10 µm. (h) Kank2-depleted cells re-expressing FL-Kank2-GFP or GFP control were seeded on FN-coated (10 µg ml−1) coverslips for 12 h at confluence and immunostained for FN and DAPI. Maximal intensity projection of z-stack image series. Scale bar, 50 µm.
Figure 4
Figure 4
Adhesion sliding occurs at the interface between integrin and ligand. (a) Still images from representative time-lapse FRAP experiments with Itga5-GFP in Cherry-tagged FL-Kank2 or empty-vector-expressing fibroblasts. A pre-bleach image shows that Kank2-mCherry and Itga5-GFP co-localized in the region of interest (ROI, white circle). Scale bar, 2 µm (b) Fluorescence recovery curves of indicated FRAP experiments. FRAP of Itga5-GFP in central adhesions of Kank2-depleted fibroblasts transduced with either mCherry-tagged FL-Kank2 or empty plasmid. Mean optical intensities in the ROI are normalized to cytosolic background and plotted as percentage of initial intensity before bleaching (mean ± s.d.; n = 8 independent FRAPs in eight cells for each cell line). Fluorescence recovery curves are fitted to a one-phase association model. (c) Mobile Itga5-GFP fractions in bleached adhesions (mean ± s.d.; n=8 independent FRAPs in eight cells for each cell line; P value calculated using Students t test). (d) Adhesion treadmilling (left) and integrin slippage models predict different experimental results in time-lapse images and kymographs on photobleaching of middle segments in sliding adhesions. (eg) Time-lapse images (upper panel) and kymograph (lower panel) of Itga5-GFP (e, f) or Kank2-GFP (g) after photobleaching of the GFP signal in the middle segments of adhesion sites in Kank2-depleted fibroblasts expressing Kank2-mCherry and a low level of Itga5-GFP (e), empty plasmid (f) or Kank2-GFP (g).
Figure 5
Figure 5
Kank2 impairs force transmission across integrins. (ae) GFP and inverted FRET signals in Kank2-depleted cells expressing GFP-tagged FL-Kank2, Kank2ΔKN, Kank2-KN, Kank2Δcoil and Kank2(1–670) seeded on FRET-based RGD tension sensors for 5 h. Split channels of boxed regions are shown on the right-hand side and line profiles of indicated adhesions in the boxed region below. Scale bar, 10 µm. (f) 2D correlation coefficient between GFP and inverted FRET signals (dot plot and box plot; FL-Kank2, n = 35 cells; Kank2ΔKN, n = 14 cells; Kank2-KN, n = 29 cells; Kank2Δcoil, n = 45 cells; Kank2(1–670), n = 42 cells; data aggregated from three independent experiments for each condition; P values were calculated using the Wilcoxon rank sum test; crosses represent outliers). (g) Force exerted by adhesions at the cell periphery in cells expressing indicated constructs. (h) Ratios between adhesion areas with high tension (≥250 pN µm−2) and adhesion areas with low tension (<250 pN µm−2) were calculated in cells expressing indicated constructs. (i) Force exerted by adhesions at the cell periphery in Kank2-depleted cells expressing FL-Kank2 or Kank2Δcoil, or FL-Kank2 together with a scramble (scr) shRNA or two independent shRNAs against liprin-β1 (for gi, dot plot and Tukey box plot; FL-Kank2, n = 24 cells; Kank2-KN, n = 24 cells; Kank2Δcoil, n = 45 cells; Kank2(1–670), n = 43 cells; FL-Kank2 scr shRNA, n = 30 cells; FL-Kank2 liprin-β1 shRNA no. 1, n = 31 cells; FL-Kank2 liprin-β1 shRNA no. 2, n = 33 cells; data aggregated from three independent experiments for each condition; P values were calculated using the Wilcoxon rank sum test; crosses represent outliers). (j) Average traction-force fields of indicated cells on FN-coated micropatterns with 35 kPa rigidity. Arrows indicate force orientation, and colour and length represent local stress magnitude in pascals. (k) Contractile energy of individual cells (dot plot and box plot with median, 95% CI notch, first–third quantile box and 5th–95th percentile whiskers; FL-Kank2, n = 125; Kank2ΔKN, n = 168; Kank2Δcoil, n = 124; Kank2(1–670), n = 98; Kank2-KN, n = 98; GFP only, n = 62 cells; data aggregated over three to six independent experiments for each cell line; P values calculated using Kruskal–Wallis test).
Figure 6
Figure 6
Kank2 directly binds the talin rod. (a) Western blot (upper panel) and densitometric analysis (lower panel) of Kank2, kindlin-2 and talin binding to biotinylated wild-type (WT) β1, β2, β5 integrin tails, Y783A-substituted β1 integrin tail (β1 Y783A) and scrambled peptides (β1 scr). Data is illustrated as the mean ± s.d. Wcl, whole cell lysate. (b) Scatter plot of label-free quantification (LFQ)-intensity ratios of Kank2-GFP and GFP immunoprecipitates. Specific interactions displaying high Kank2-GFP to GFP and low GFP to Kank2-GFP ratios in two independent replicates are highlighted in red. eGFP, enhanced green fluorescent protein. (c) Western blot (upper panel) and densitometric analysis (lower panel) of Kank2, kindlin-2 and talin binding to β1 wild-type and β1 Y783A tails using either talin-1/2 flox/flox or talin-1/2-deficient cells (talin-1/2 double knockout (DKO); mean ± s.d.; n = 4 independent pulldown experiments; P values were calculated using Student’s t test). NS, not significant. (d) Representative GST pulldown of recombinant GST-KN or GST pre-incubated with recombinant talin-1 or THD from two independent experiments. (e) Representative epifluorescence images of Venus-His-Sumo-tagged talin R4–R8 domain recruited by GST-KN but not GST control to GSH Sepharose beads from two independent experiments. Scale bar, 5 µm. Source data for c can be found in Supplementary Table 2. Unprocessed original scans of blots are shown in Supplementary Fig. 9.
Figure 7
Figure 7
Kank2 induces talin and integrin activation. (a) Western blot (left) and densitometric analysis (right) of Kank2, talin and kindlin-2 binding to β1 integrin tail in control (scr shRNA) cells or Kank2-depleted (Kank2 shRNA) cells (mean ± s.d.; n = 3 independent pulldown experiments; P values were calculated using Student’s t test). (b) Western blot (left) and densitometric analysis (right) of Kank2, talin, kindlin-2 and Dab-2 binding to β1 integrin tails or scrambled peptide (β1 scr) after addition of recombinant GST-KN or GST (mean ± s.d.; n = 3 independent pulldown experiments; P values calculated using Student’s t test). (c, d) Western blot (left) and densitometric analysis (right) of recombinant talin-1 binding to β1 integrin tail after addition of recombinant GST-KN (c) or FL-Kank2 (d) (mean ± s.d.; n = 3 independent pulldown experiments; P values calculated using Student’s t test). (e) Talin-GFP co-expressed with Cherry-tagged FL-Kank2, Kank2ΔKN, Kank2-KN in Kank2-depleted cells and stained for kindlin-2. (f) Quantification of talin-1-GFP mean optical intensity (MOI) ratio between kindlin-2-positive adhesion area and kindlin-2-negative cytosolic region in (e) (dot plot, mean ± 95% CI; n = 10 cells per cell line; P values calculated using one-way ANOVA Tukey test). (g) Binding of PAC1 antibody reporting active αIIbβ3 integrins normalized to binding of anti-total αIIbβ3 on CHO cells co-expressing talin-1-tagRFP with either Kank2-GFP, Kank2ΔKN-GFP or GFP, or expressing THD only (mean ± s.d.; n = 4 independent experiments; P values calculated using one-way ANOVA Tukey test). (h) Kank2-depleted fibroblasts stably transfected with GFP-tagged FL-Kank2, Kank2ΔKN, Kank2-KN or GFP only (green), seeded on FN and immune-stained with the 9EG7 antibody reporting the exposure of a β1 integrin-specific activation epitope (using orange look-up table (LUT)). (i) Signal intensities of 9EG7 staining quantified from (h) (dot plot, mean ± 95% CI; n = 30 cells per cell line; data aggregated from three independent experiments; P values calculated using Kruskal–Wallis test). Scale bars in e,h, 10 µm. Source data for ad,g can be found in Supplementary Table 2. Unprocessed original scans of blots are shown in Supplementary Fig. 9.
Figure 8
Figure 8
Kank2 decreases F-actin binding to talin-ABS2. (a, b) Western blot (a) and densitometric analysis (b) of Kank2 binding to the talin R4–R8 domain in the presence of increasing concentrations of actin (0 µM, 1 µM, 2 µM and 5 µM, mean ± s.d.; n = 3 independent pulldown experiments) under polymerization-permissive conditions. (c) Representative images of atto565-labelled actin recruited to Ni2+NTA beads coated with bovine serum albumin (BSA) (control) or Venus-His-Sumo-tagged talin R4–R8 domain in the presence of the recombinant GST-KN motif or FL-Kank2 under polymerization-permissive conditions. Scale bar, 100 µm. (d) Fluorescence intensity ratios between atto565 and Venus on bead surfaces quantified on the basis of experiments in c (dot plot, mean ± 95% CI; n > 25 beads per condition; data aggregated from three independent experiments; P value calculated using one-way ANOVA Tukey test). (e) Fluorescence recovery curves of indicated FRAP experiments. FRAP of talin-1-GFP in central adhesions of Kank2-depleted fibroblasts co-expressing talin-1-GFP and either mCherry-tagged FL-Kank2 or mCherry-tagged Kank2ΔKN. Mean optical intensities in the ROI are normalized to cytosolic background and plotted as percentages of the initial intensity before bleaching (mean ± s.d.). Fluorescence recovery curves are fitted to a one-phase association model. (f) Mobile fractions of talin-1-GFP in the bleached adhesions (mean ± s.d.; n = 10 independent FRAPs from 10 cells for each condition; P value calculated using one-way ANOVA Tukey test). (g) Model depicting Kank function in FAs. In migrating cells, Kank2 is absent from adhesion sites of the protrusion front. Behind the lamella, Kank2 is first recruited to the proximal tips of mature FAs, from where it gradually spreads over the entire FA belt. The recruitment of Kank2 to the FA belt is mediated by a direct interaction between the KN motif of Kank2 and the R7 domain in the talin rod. Kank2 displaces F-actin from the talin-ABS2 while simultaneously promoting and/or maintaining talin activation. This dual function of Kank2 permits a partial decoupling of talin-bound, activated integrins from the actomyosin cytoskeleton, leading to diminished force transmission across FAs, reduced traction force, formation of slip bonds between integrins and ligands and the conversion of FA belts into sliding central adhesions. Unprocessed original scans of blots are shown in Supplementary Fig. 9.

Similar articles

Cited by

References

    1. Vicente-Manzanares M, Horwitz AR. Adhesion dynamics at a glance. J. Cell Sci. 2011;124:3923–3927. - PMC - PubMed
    1. Parsons JT, Horwitz AR, Schwartz MA. Cell adhesion: integrating cytoskeletal dynamics and cellular tension. Nat. Rev. Mol. Cell Biol. 2010;11:633–643. - PMC - PubMed
    1. Kong F, Garcia AJ, Mould AP, Humphries MJ, Zhu C. Demonstration of catch bonds between an integrin and its ligand. J. Cell Biol. 2009;185:1275–1284. - PMC - PubMed
    1. Hoffman BD, Grashoff C, Schwartz MA. Dynamic molecular processes mediate cellular mechanotransduction. Nature. 2011;475:316–323. - PMC - PubMed
    1. Giannone G, Mege RM, Thoumine O. Multi-level molecular clutches in motile cell processes. Trends Cell Biol. 2009;19:475–486. - PubMed