

The macrophage contribution to stress erythropoiesis: when less is enough
- PMID: 27543439
- PMCID: PMC5043129
- DOI: 10.1182/blood-2016-05-714527
The macrophage contribution to stress erythropoiesis: when less is enough
Abstract
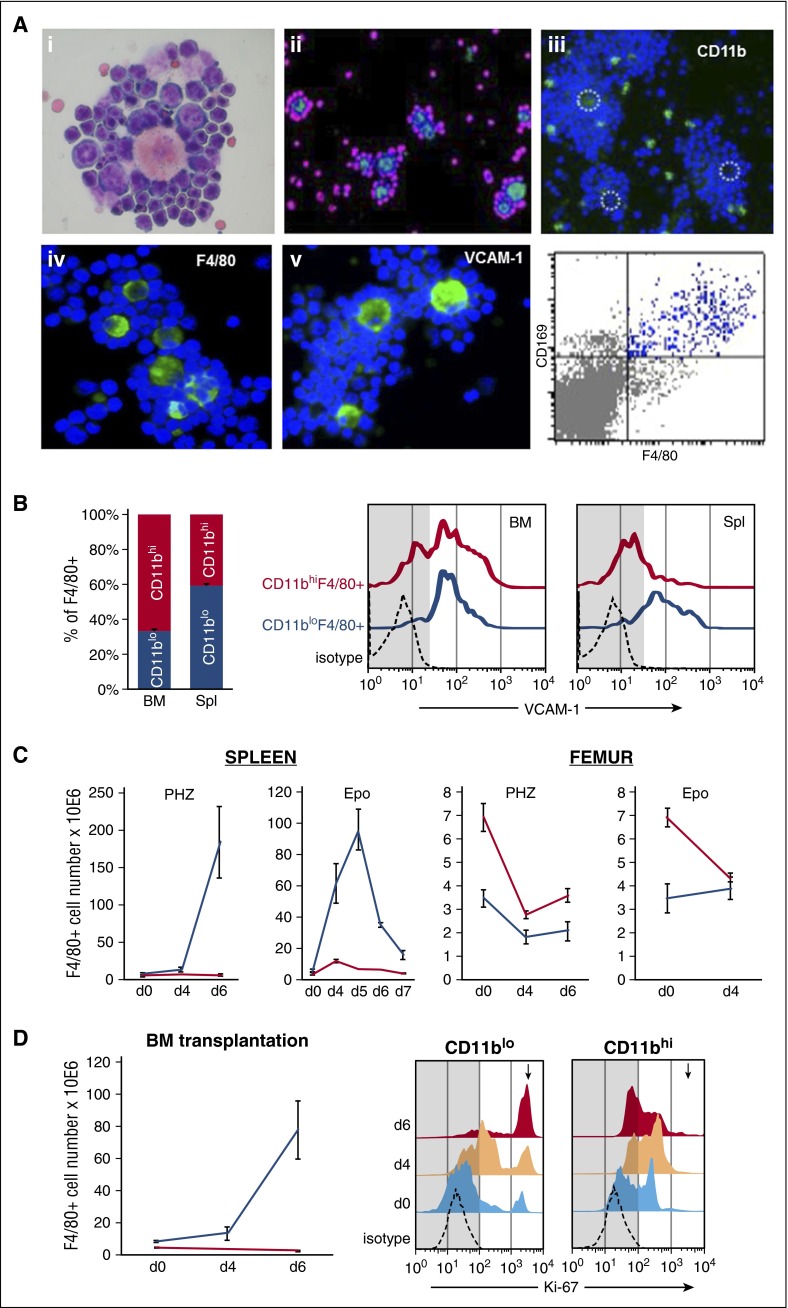
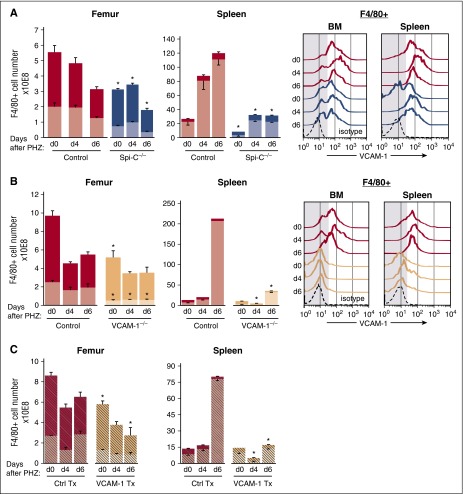
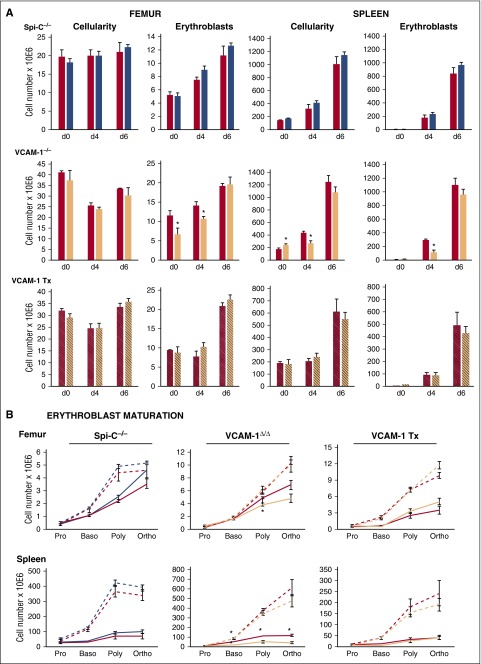
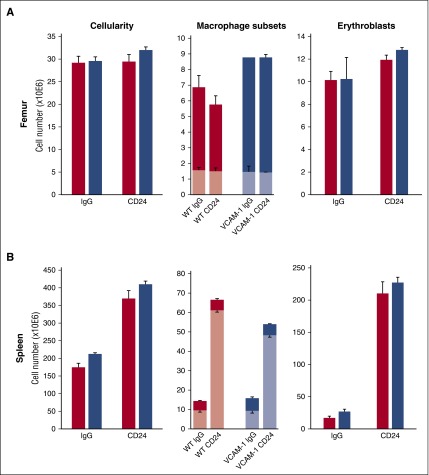
Although the importance of native bone marrow and spleen macrophages in enhancing baseline and stress erythropoiesis has been emphasized over several decades, their kinetic and phenotypic changes during a variety of stress responses have been unclear. Furthermore, whether monocyte-derived recruited macrophages can functionally substitute for inadequate or functionally impaired native macrophages has been controversial and seem to be not only tissue- but also stress-type dependent. To provide further insight into these issues, we made detailed observations at baseline and post-erythroid stress (E-stress) in 2 mouse models with genetically depressed macrophage numbers and compared them to their controls. We documented that, irrespective of the stress-induced (hemolytic or post-erythropoietin [Epo]) treatment, only native CD11b(lo) splenic macrophages expand dramatically post-stress in normal mice without significant changes in the monocyte-derived CD11b(hi) subset. The latter remained a minority and did not change post-stress in 2 genetic models lacking either Spi-C or VCAM-1 with impaired native macrophage proliferative expansion. Although CD11b(lo) macrophages in these mice were one-fifth of normal at their peak response, surprisingly, their erythroid response was not compromised and was similar to controls. Thus, despite the prior emphasis on numerical macrophage reliance to provide functional rescue from E-stress, our data highlight the importance of previously described non-macrophage-dependent pathways activated under certain stress conditions to compensate for low macrophage numbers.
© 2016 by The American Society of Hematology.
Figures
Similar articles
-
Nrf2 deficiency in mice attenuates erythropoietic stress-related macrophage hypercellularity.Exp Hematol. 2020 Apr;84:19-28.e4. doi: 10.1016/j.exphem.2020.02.005. Epub 2020 Mar 6. Exp Hematol. 2020. PMID: 32151553 Free PMC article.
-
Combinatorial and distinct roles of α₅ and α₄ integrins in stress erythropoiesis in mice.Blood. 2011 Jan 20;117(3):975-85. doi: 10.1182/blood-2010-05-283218. Epub 2010 Oct 18. Blood. 2011. PMID: 20956802 Free PMC article.
-
CD169⁺ macrophages provide a niche promoting erythropoiesis under homeostasis and stress.Nat Med. 2013 Apr;19(4):429-36. doi: 10.1038/nm.3057. Epub 2013 Mar 17. Nat Med. 2013. PMID: 23502962 Free PMC article.
-
Role of the macrophage in erythropoiesis.Pathol Int. 1999 Oct;49(10):841-8. doi: 10.1046/j.1440-1827.1999.00954.x. Pathol Int. 1999. PMID: 10571815 Review.
-
Cellular mechanism of resistance to erythropoietin.Nephrol Dial Transplant. 1995;10 Suppl 6:27-30. doi: 10.1093/ndt/10.supp6.27. Nephrol Dial Transplant. 1995. PMID: 8524490 Review.
Cited by
-
Combined liver-cytokine humanization comes to the rescue of circulating human red blood cells.Science. 2021 Mar 5;371(6533):1019-1025. doi: 10.1126/science.abe2485. Science. 2021. PMID: 33674488 Free PMC article.
-
Selenoproteins regulate stress erythroid progenitors and spleen microenvironment during stress erythropoiesis.Blood. 2018 Jun 7;131(23):2568-2580. doi: 10.1182/blood-2017-08-800607. Epub 2018 Apr 3. Blood. 2018. PMID: 29615406 Free PMC article.
-
Kindlin-3 deficiency leads to impaired erythropoiesis and erythrocyte cytoskeleton.Blood Adv. 2023 May 9;7(9):1739-1753. doi: 10.1182/bloodadvances.2022008498. Blood Adv. 2023. PMID: 36649586 Free PMC article.
-
The Multiple Facets of Iron Recycling.Genes (Basel). 2021 Aug 30;12(9):1364. doi: 10.3390/genes12091364. Genes (Basel). 2021. PMID: 34573346 Free PMC article. Review.
-
Reappraising the role of α5 integrin and the microenvironmental support in stress erythropoiesis.Exp Hematol. 2020 Jan;81:16-31.e4. doi: 10.1016/j.exphem.2019.12.004. Epub 2019 Dec 28. Exp Hematol. 2020. PMID: 31887343 Free PMC article.
References
-
- Bessis M. Erythroblastic island, functional unity of bone marrow. Rev Hematol. 1958;13(1):8–11. - PubMed
Publication types
MeSH terms
Substances
Grants and funding
LinkOut - more resources
Full Text Sources
Other Literature Sources
Molecular Biology Databases
Research Materials
Miscellaneous
