. 2016 Sep 20;45(3):513-526.
doi: 10.1016/j.immuni.2016.07.016. Epub 2016 Aug 11.

The Pseudokinase MLKL and the Kinase RIPK3 Have Distinct Roles in Autoimmune Disease Caused by Loss of Death-Receptor-Induced Apoptosis

Affiliations

The Pseudokinase MLKL and the Kinase RIPK3 Have Distinct Roles in Autoimmune Disease Caused by Loss of Death-Receptor-Induced Apoptosis

Silvia Alvarez-Diaz et al. Immunity. .

Abstract

The kinases RIPK1 and RIPK3 and the pseudo-kinase MLKL have been identified as key regulators of the necroptotic cell death pathway, although a role for MLKL within the whole animal has not yet been established. Here, we have shown that MLKL deficiency rescued the embryonic lethality caused by loss of Caspase-8 or FADD. Casp8(-/-)Mlkl(-/-) and Fadd(-/-)Mlkl(-/-) mice were viable and fertile but rapidly developed severe lymphadenopathy, systemic autoimmune disease, and thrombocytopenia. These morbidities occurred more rapidly and with increased severity in Casp8(-/-)Mlkl(-/-) and Fadd(-/-)Mlkl(-/-) mice compared to Casp8(-/-)Ripk3(-/-) or Fadd(-/-)Ripk3(-/-) mice, respectively. These results demonstrate that MLKL is an essential effector of aberrant necroptosis in embryos caused by loss of Caspase-8 or FADD. Furthermore, they suggest that RIPK3 and/or MLKL may exert functions independently of necroptosis. It appears that non-necroptotic functions of RIPK3 contribute to the lymphadenopathy, autoimmunity, and excess cytokine production that occur when FADD or Caspase-8-mediated apoptosis is abrogated.


Figures

Figure 1
Figure 1. Casp8−/−Mlkl−/− mice are viable
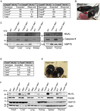
(A) Expected and observed frequency of mice of the indicated genotypes in offspring from crosses of mice with the indicated genotypes. (B) Photograph of a 14-week-old Casp8−/−Mlkl−/− mouse bred from a double deficient cross alongside a wild-type (WT) mouse. (C) Immunoblotting for Caspase-8, MLKL and HSP70 (loading control) from solid organs (left panel) and lymphoid tissues (right panel) of mice of the indicated genotypes. (D) Expected and observed frequency of mice of the indicated genotypes in offspring from crosses of mice with the indicated genotypes. (E) Photograph of an 8-week-old Fadd−/−Mlkl−/− mouse alongside a littermate control mouse. (F) Immunoblotting for FADD, MLKL, Actin and HSP70 (last two used as loading controls) from solid organs and lymphoid tissues of mice of the indicated genotypes. See also Figure S1.
Figure 2
Figure 2. Cells from Casp8−/−Mlkl−/− mice are resistant to diverse necroptotic cell death stimuli
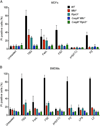
(A and B) Primary MDFs (A) and BMDMs (B) from the indicated genotypes were treated with TNF (100 ng/mL), FASL (10 ng/mL), poly(I:C) (25 µg/mL) or LPS (25 µg/mL) in the presence or absence of the caspase inhibitor Q-VD-OPh (25 µM), z-VAD-FMK (20 µM) or SMAC mimetic (CpdA: 500 nM) or were left untreated for 24 h. Cell viability was determined by staining with propidium iodide (PI) and flow cytometric analysis. Data are presented as mean ± SEM (n = 3 for each genotype). *P<0.05, **P<0.001, ***P<0.0001. See also Figure S2.
Figure 3
Figure 3. Casp8−/−Mlkl−/− mice develop progressive severe lymphadenopathy
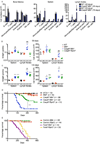
(A) Cross section of immune cells in bone marrow, spleen and lymph nodes from mice of the indicated genotypes at 20 days and 70 days of age (n = 3). Different cell subsets were determined by flow cyotmetry using the following markers: B cells (B220+ or CD19+), T cells (CD3+), Monocytes and Macrophages (MAC-1+), Granulocytes (GR-1+), Erythroid cells (TER119+) and NK cells (NK1.1+ and NKp46+). Data represent mean ± SD (n = 3). (B and C) Weight and total cell numbers of the lymph nodes (axillary, brachial, inguinal and mesenteric) and spleen from mice of the indicated genotypes at, (A) 50 days, and (B) 100 days. *P<0.05, ***P<0.0001 compared to WT mice; #P<0.05, ##P<0.01, ###P<0.0001 compared to Casp8−/−Ripk3−/− mice. (D) Kaplan-Meyer survival curves for WT (n = 15), Mlkl−/− (n = 19), Casp8+/−Mlkl−/− (n = 39), Casp8−/−Mlkl−/− (n = 22) and Casp8−/−Ripk3−/− (n = 31) mice. (E) Kaplan-Meyer survival curves for control (MLKL) (n=32, FaddwtMlkl−/− or Fadd+/−Mlkl−/−), Fadd−/−Mlkl−/− (n = 34), control (RIP3) (n=44, FaddwtRipk3−/− or Fadd+/−Ripk3−/−), and Fadd−/− Ripk3−/− (n = 28) mice. Survival of mice of different genotypes was compared by log-rank test. **P<0.001, ***P<0.0001. See also Figure S3.
Figure 4
Figure 4. Casp8−/−Mlkl−/− mice accumulate ‘unusual’ B220+CD3+CD4CD8 T-cells
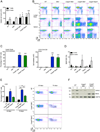
(A) Numbers of B and T cells recovered from spleens from mice of the indicated genotypes. Values represent mean ± SD (n = 3–5 mice/genotype), *P<0.05, **P<0.001, ***P<0.0001. (B) Representative flow cytometric images of the ‘unusual’ DN T cells (numbers indicate percentage of cells in each quadrant) (n=4). (C) The percentages and numbers of the ‘unusual’ DN T cells in the lymph nodes of mice of the indicated genotypes were measured by flow cytometric analysis. Values represent mean ± SD (n = 3–5 mice/genotype), *P<0.05, **P<0.001, ***P<0.0001. (D) The percentages and numbers of the ‘unusual’ DN T cells in the peripheral blood of mice of the indicated genotypes were measured by flow cytometric analysis. Values represent mean ± SD (n = 3–5 mice/genotype). (E) Proliferation of CD3+CD8+ T cells from mice of the indicated genotypes was determined by staining for Ki67 after fixation and permeabilization. Percentages of Ki67+ cells in 20 days and 70 days old mice of the indicated genotypes (n = 3) (left) and representative flow cytometric images of the CD3+CD8+ T cells (numbers indicate percentage of cells in each quadrant) (n = 3) (right) are shown. Data are presented as mean ± SD, for each genotype **P<0.001, ***P<0.0001. (F) Immunoblotting for RIPK3, MLKL and HSP70 (loading control) in extracts from purified DN T cells (Casp8−/−Mlkl−/− and Casp8−/−Ripk3−/− mice) or total T cells (wild-type mice). Two mice per genotype were used. See also Figure S4.
Figure 5
Figure 5. Casp8−/−Mlkl−/− mice develop autoimmune glomerulonephritis
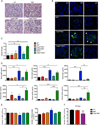
(A) Representative H&E-stained sections of the kidneys from mice of the indicated genotypes were examined for pathological changes, such as hyper-cellularity, glomerular enlargement or leukocyte infiltration. Kidneys from 6 mice of each genotype were analyzed. Magnification × 40. (B) Representative confocal photomicrographs of frozen sections (kidneys from 3 mice of each genotype analyzed) stained for the presence of IgA-, IgG- or IgM-containing immune complexes (green) in glomeruli. Nuclei are revealed by staining with DAPI (blue). Scale bars represent 25 µm. (C and D) Sera of mice of the indicated genotypes were collected and the concentrations of (C) ANA or (D) total antibodies of the different Ig isotypes were quantified by ELISA (age 100 days). Values in graphs represent mean ± SEM (n = 6–13 mice/genotype), *P<0.05, **P<0.001, ***P<0.0001. (E) RBC and reticulocyte numbers were measured in blood samples of mice of the indicated genotypes. Data represent mean ± SD (n = 9–53 mice/genotype), *P<0.05, **P<0.001, ***P<0.0001. (F) RBC numbers were measured in blood samples of mice of the indicated genotypes at 60 days of age. Data represent mean ± SD (n = 5 mice/genotype).
Figure 6
Figure 6. Casp8−/−Mlkl−/− mice have abnormally low platelet counts
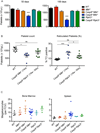
(A) Platelet counts in mice of the indicated genotypes at 50 days (left) and 100 days (right) of age. Data represent mean ± SD (n = 6–19 mice/genotype), *P<0.05, **P<0.001, ***P<0.0001. (B) Platelet counts (left) and percentages of reticulated platelets (right) in mice of the indicated genotypes and age. Data represent mean ± SEM (n = 7–10 mice/genotype), *P<0.05, **P<0.001, ***P<0.0001. (C) Megakaryocyte counts in H&E-stained sections of bone marrow (left) and spleen (right). Data represent mean per field of view (FOV; × 200) from 10 fields per individual mouse (n = 3–14 mice/genotype).
Figure 7
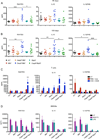
Figure 7. Casp8−/−Mlkl−/− mice have abnormally increased amounts of certain proinflammatory cytokines and chemokines
(A and B) The concentrations of 23 cytokines and chemokines (indicated in Experimental Procedures) were measured in the sera of mice of the indicated genotypes by the multiplex system at, (A) 50 days when animals still appeared healthy, or (B) 100 days of age when Casp8−/−Mlkl−/− mice were showing clear signs of illness. The concentrations of RANTES, IL-10 and IL-12p40 are shown. Each dot represents a single mouse; the bar indicates the average; the error bars represent SEM. *P<0.05, **P<0.001, ***P<0.0001. (C and D) 23 cytokines and chemokines were measured in the supernatants of purified T cells activated with PMA (2 ng/mL) plus ionomycin (10 ng/mL) or CD3 (10 µg/mL) plus CD28 (10 µg/mL) antibodies (C) or BMDMs stimulated with poly(I:C) (25 µg/mL) or LPS (25 µg/mL) (D) from mice of the indicated genotypes. The concentration of RANTES, IL-10 and IL-12p40 are shown. Data represent mean ± SD (n = 3 mice/genotype). **P<0.001 Casp8−/−Mlkl−/− mice compared to any of the other genotypes. See also Figure S5–S7.

Similar articles

Cited by

References

    1. Allam R, Lawlor KE, Yu EC, Mildenhall AL, Moujalled DM, Lewis RS, Ke F, Mason KD, White MJ, Stacey KJ, et al. Mitochondrial apoptosis is dispensable for NLRP3 inflammasome activation but non-apoptotic caspase-8 is required for inflammasome priming. EMBO reports. 2014;15:982–990. - PMC - PubMed
    1. Bossen C, Ingold K, Tardivel A, Bodmer JL, Gaide O, Hertig S, Ambrose C, Tschopp J, Schneider P. Interactions of tumor necrosis factor (TNF) and TNF receptor family members in the mouse and human. The Journal of biological chemistry. 2006;281:13964–13971. - PubMed
    1. Cai Z, Jitkaew S, Zhao J, Chiang HC, Choksi S, Liu J, Ward Y, Wu LG, Liu ZG. Plasma membrane translocation of trimerized MLKL protein is required for TNF-induced necroptosis. Nature cell biology. 2014;16:55–65. - PMC - PubMed
    1. Ch'en IL, Beisner DR, Degterev A, Lynch C, Yuan J, Hoffmann A, Hedrick SM. Antigen-mediated T cell expansion regulated by parallel pathways of death. Proceedings of the National Academy of Sciences of the United States of America. 2008;105:17463–17468. - PMC - PubMed
    1. Chan FK, Luz NF, Moriwaki K. Programmed Necrosis in the Cross Talk of Cell Death and Inflammation. Annual review of immunology. 2014 - PMC - PubMed

Publication types

MeSH terms

Substances