. 2016 Sep;26(9):1021-32.
doi: 10.1038/cr.2016.95. Epub 2016 Aug 12.

Ferroptosis is an autophagic cell death process

Affiliations

Ferroptosis is an autophagic cell death process

Minghui Gao et al. Cell Res. 2016 Sep.

Abstract

Ferroptosis is an iron-dependent form of regulated necrosis. It is implicated in various human diseases, including ischemic organ damage and cancer. Here, we report the crucial role of autophagy, particularly autophagic degradation of cellular iron storage proteins (a process known as ferritinophagy), in ferroptosis. Using RNAi screening coupled with subsequent genetic analysis, we identified multiple autophagy-related genes as positive regulators of ferroptosis. Ferroptosis induction led to autophagy activation and consequent degradation of ferritin and ferritinophagy cargo receptor NCOA4. Consistently, inhibition of ferritinophagy by blockage of autophagy or knockdown of NCOA4 abrogated the accumulation of ferroptosis-associated cellular labile iron and reactive oxygen species, as well as eventual ferroptotic cell death. Therefore, ferroptosis is an autophagic cell death process, and NCOA4-mediated ferritinophagy supports ferroptosis by controlling cellular iron homeostasis.


Figures
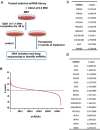
Figure 1
Figure 1
Genetic screen identifies regulators of ferroptosis. (A) RNAi screening strategy to identify novel players of ferroptosis. (B) Plot of z-score (frequency of a specific shRNA in total sequencing reads calculated from ferroptosis-treated cells over the frequency calculated from control cells) of the RNAi screen results shows the enrichment of individual shRNAs. (C) Multiple known ferroptosis regulators were enriched in our RNAi screening. (D) Multiple autophagy-related genes were enriched in our RNAi screening.
Figure 2
Figure 2
Ferroptosis inducer activates autophagy. (A, B) Erastin induced LC3 conversion in MEFs (A) and HT1080 cells (B). Cells seeded in six-well dishes were treated with the 0.5 μM (A) or 5 μM (B) erastin for the indicated times. 20 nM BafA1 was added 2 h before cell harvest. Cell extracts were analyzed by western blot using antibodies against the indicated proteins. The accumulation of LC3II (faster migrating form) relative to LC3I (slower migrating form) is indicative of the induction of autophagy. (C, D) Erastin induced GFP-LC3 puncta formation in MEFs (C) and HT1080 cells (D). Cells stably expressing GFP-LC3 grown on glass cover slips were either left untreated or treated with 0.5 μM (C) or 5 μM (D) erastin for 7 h. Cells were then fixed with 3.7% PFA, processed for imaging, and visualized under the confocal microscope using the 60× magnification objective.
Figure 3
Figure 3
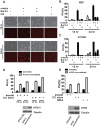
Autophagy positively regulates ferroptosis. (A-C) Autophagy inhibitors BafA1 and CQ inhibit ferroptosis in MEFs (A, B) and HT1080 cells (C). Cells were treated as indicated. In A, the effect of autophagy inhibitors was shown by microscopy (black and white: phase contract; red: PI staining) with inhibitors and time (h) of treatment as indicated. In B and C, cell death was quantified by PI staining coupled with flow cytometry. erastin: 1 μM; BafA1: 20 nM; CQ: 50 μM. The data show means ± SEM from 3 independent experiments (same for all quantitative results thereafter). (D) ATG13 is required for ferroptosis. ATG13KO MEFs, or ATG13KO cells reconstituted with ectopic ATG13 expression, were treated as indicated. Cell death was determined by PI staining coupled with flow cytometry. Western blot confirmed the expression of ATG13. erastin: 1 μM. (E) ATG3 is required for ferroptosis. ATG3KO MEFs, or ATG3KO cells reconstituted with ectopic ATG3 expression, were treated as indicated for 12 h. Cell death was determined by PI staining coupled with flow cytometry. ATG3 expression was confirmed by immunoblotting. erastin: 1 μM; RSL3: 1 μM.
Figure 4
Figure 4
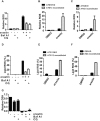
Autophagy is required for ferroptosis-associated ROS accumulation. (A) Autophagy inhibitors Baf1A and CQ can inhibit ferroptosis-associated ROS accumulation. MEFs were treated as indicated for 8 h. ROS was measured by H2DCFDA staining coupled with flow cytometry. BafA1: 20 nM; CQ: 50 μM. (B) ATG13 knockout inhibited ferroptosis-associated ROS accumulation. ATG13KO MEFs, or ATG13KO cells reconstituted with ectopic ATG13 expression, were treated with 1 μM erastin for 8 h. ROS was measured by H2DCFDA staining coupled with flow cytometry. (C) ATG3 is required for ferroptosis-induced ROS accumulation. ATG3KO MEFs, or ATG3KO cells reconstituted with ectopic ATG3 expression, were treated with 1 μM erastin for 8 h. ROS was measured by H2DCFDA staining coupled with flow cytometry. (D) Autophagy inhibitors BafA1 and CQ inhibit ferroptosis-associated lipid ROS generation. MEFs were treated as indicated for 8 h. Lipid ROS was measured by C11-BODIPY staining coupled with flow cytometry. erastin: 1 μM; BafA1: 20 nM; CQ: 50 μM. (E, F) ATG13 and ATG3 are required for ferroptosis-associated lipid ROS accumulation. The experiments were performed as B and C, except that lipid ROS (not total ROS) was measured by C11-BODIPY staining coupled with flow cytometry. (G) Autophagy is not required for erastin-induced GSH depletion. MEFs were treated as indicated for 8 h. Total GSH was measured with or without pharmacological inhibition of autophagy. BafA1: 20 nM; CQ: 50 μM.
Figure 5
Figure 5
Autophagy is required for ferroptosis-associated labile iron accumulation. (A) Erastin treatment caused an increase of cellular LIP. MEFs were treated with erastin (1 μM) for the indicated times. Cells were stained with calcein-acetoxymethyl ester and LIP was subsequently quantitated by flow cytometry. (B) Pharmacological inhibition of autophagy prevents ferroptosis-associated LIP accumulation. MEFs were treated with or without BafA1 as indicated for 6 h. Cells were stained with calcein-acetoxymethyl ester, and LIP was subsequently quantitated by flow cytometry. BafA1: 20 nM. (C) Genetic disruption of autophagy prevents ferroptosis-associated LIP accumulation. ATG13KO MEFs, or ATG13KO MEFs reconstituted with ectopic ATG13 expression, were treated with 1 μM erastin as indicated for 6 h. Cells were stained with calcein-acetoxymethyl ester and LIP was subsequently quantitated by flow cytometry.
Figure 6
Figure 6
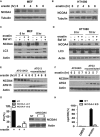
NCOA4-mediated ferritinophagy promotes ferroptosis. (A, B) Ferroptosis induced NCOA4 degradation in a time-dependent manner in MEFs (A) and HT1080 cells (B). MEFs or HT1080 cells were treated as indicated. Total cell extract was used for western blot to detect NCOA4 change during ferroptosis. erastin: 0.5 μM (A) or 5 μM (B). (C, D) Autophagy inhibitor BafA1 can block ferroptosis-induced NCOA4 degradation in MEFs (C) and HT1080 cells (D). MEFs or HT1080 cells were treated as indicated. Total cell extract was used for western blot to detect NCOA4 change during ferroptosis. erastin: 0.5 μM (C) or 5 μM (D). BafA1: 20 nM. (E, F) Genetic disruption of autophagy blocks ferroptosis-induced NCOA4 degradation. ATG13KO and ATG13-reconstituted MEFs (E), or ATG3KO and ATG3-reconstituted MEFs (F), were treated with 1 μM erastin for the indicated times. Total cell lysate was used for western blot to detect NCOA4 change during ferroptosis. (G) Knockdown of NCOA4 by shRNAs can block ferroptosis. MEFs infected with non-target (NT) shRNA or two independent NCOA4 shRNAs were treated with 0.5 μM erastin for 12 h. Cell death was measured by PI staining coupled with flow cytometry. (H) Knockdown of NCOA4 by shRNA in MEFs can block ferroptosis-associated lipid ROS accumulation. NCOA4-knockdown or control knockdown cells were treated with 1 μM erastin for 10 h. Lipid ROS was measured by C11-BODIPY staining coupled with flow cytometry.
Figure 7
Figure 7
Regulation of FTH1 expression during ferroptosis. (A) Ferroptosis induced an increase of FTH1 protein levels. HT1080 cells were treated with 5 μM erastin for the indicated times. Total cell lysate was used to detect FTH1 expression. (B) Ferroptosis induced an upreguation of FTH1 mRNA levels. HT1080 cells were treated with 5 μM erastin as indicated. Total RNA was isolated and mRNA level of FTH1 was measured by q-PCR. (C) NCOA4 is required for ferroptosis-induced FTH1 mRNA upregulatioin. HT1080 cells with or without NCOA4 depletion were treated with 5 μM erastin for 10 h. Total RNA was isolated and mRNA level of FTH1 was measured by q-PCR. (D) BafA1 inhibits ferroptosis-associated FTH1 degradation. HT1080 cells were treated as indicated. Total cell lysate was used for immunoblotting to detect the changes of target protein levels.

Similar articles

Cited by

References

    1. Danial NN, Korsmeyer SJ. Cell death: Critical control points. Cell 2004; 116:205–219. - PubMed
    1. Green DR, Kroemer G. The pathophysiology of mitochondrial cell death. Science 2004; 305:626–629. - PubMed
    1. Fuchs Y, Steller H. Programmed cell death in animal development and disease. Cell 2011; 147:742–758. - PMC - PubMed
    1. Bergsbaken T, Fink SL, Cookson BT. Pyroptosis: host cell death and inflammation. Nat Rev Microbiol 2009; 7:99–109. - PMC - PubMed
    1. Blum ES, Abraham MC, Yoshimura S, Lu Y, Shaham S. Control of nonapoptotic developmental cell death in Caenorhabditis elegans by a polyglutamine-repeat protein. Science 2012; 335:970–973. - PMC - PubMed

Publication types