. 2016 Aug 16;113(33):9333-8.
doi: 10.1073/pnas.1606801113. Epub 2016 Aug 1.

O-linked GlcNAcylation elevated by HPV E6 mediates viral oncogenesis

Affiliations

O-linked GlcNAcylation elevated by HPV E6 mediates viral oncogenesis

Qinghua Zeng et al. Proc Natl Acad Sci U S A. .

Abstract

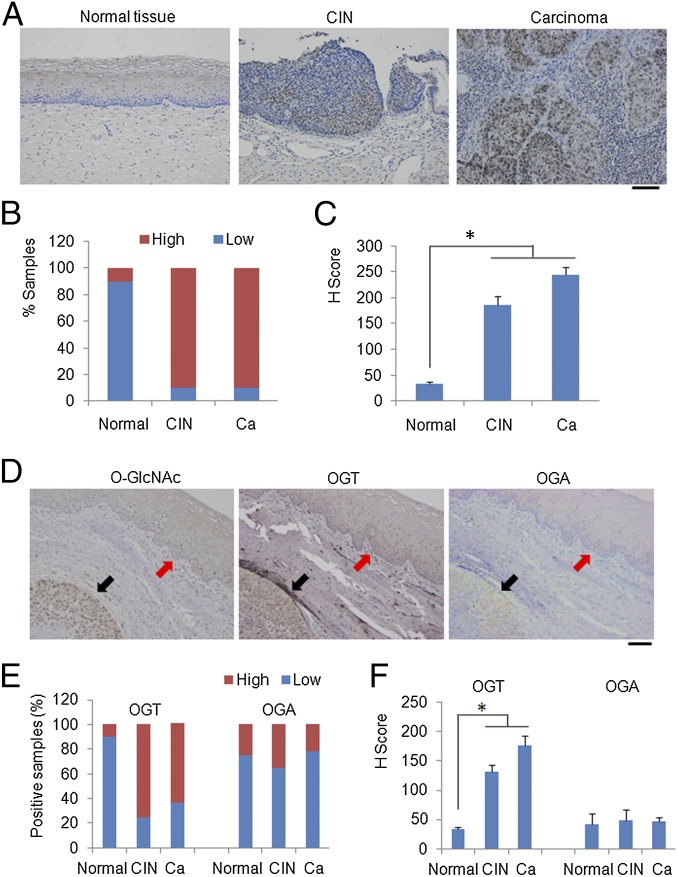
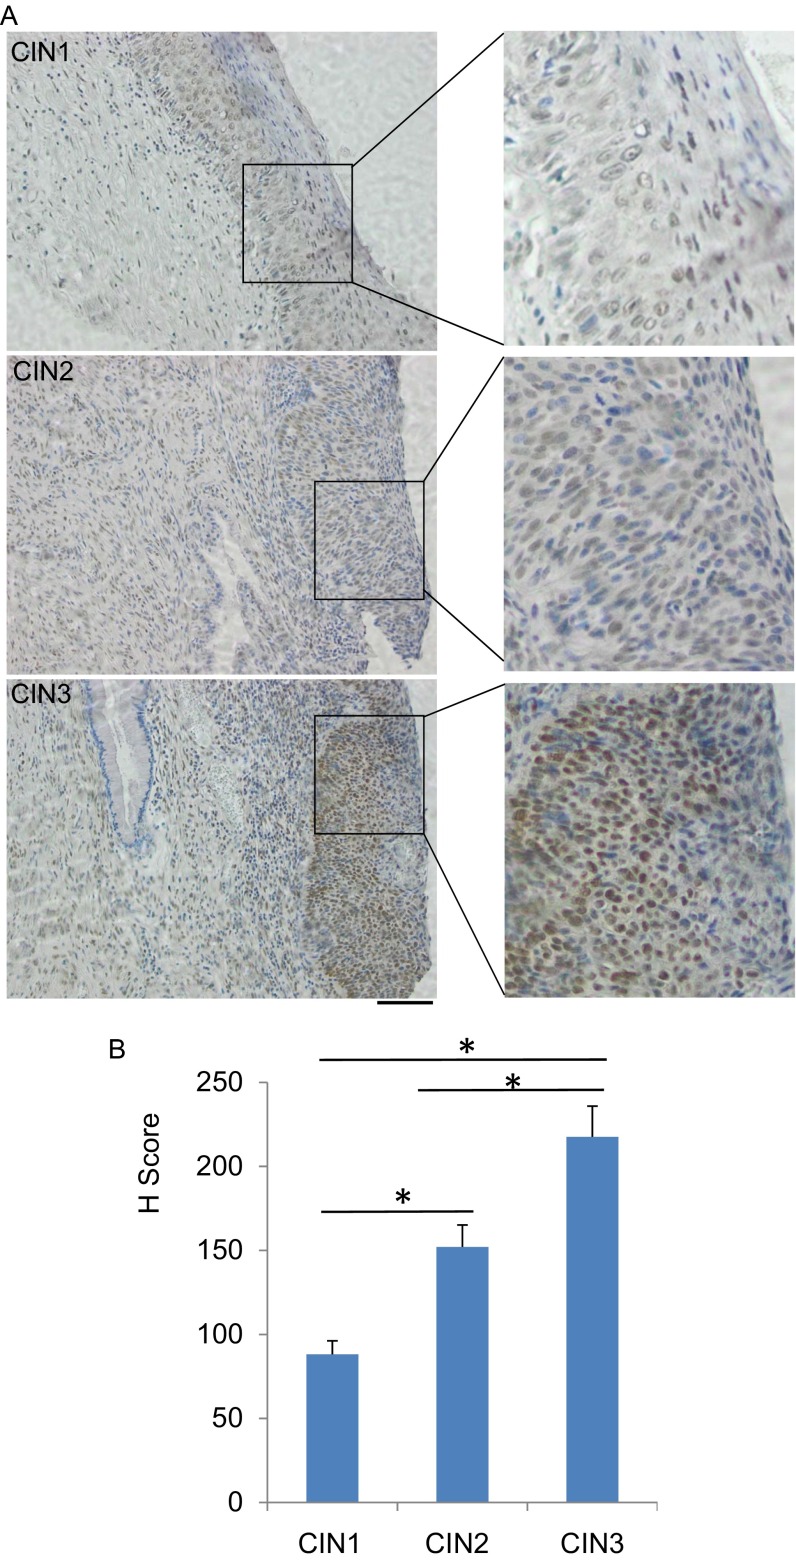
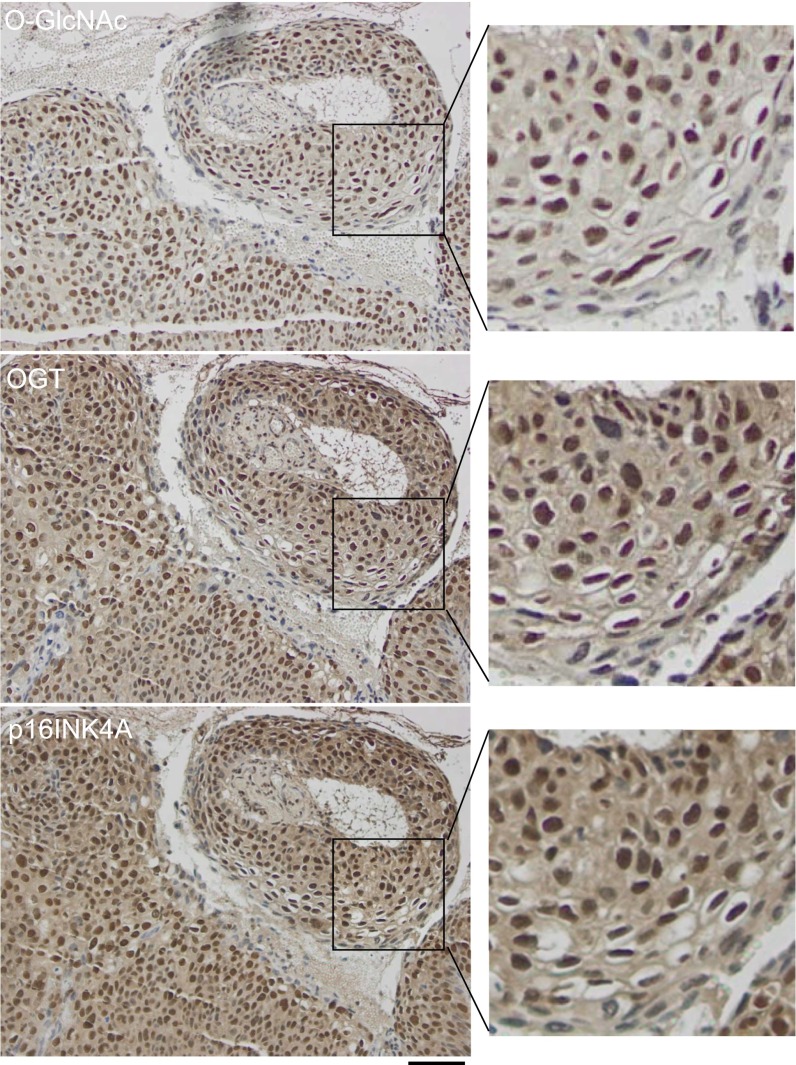
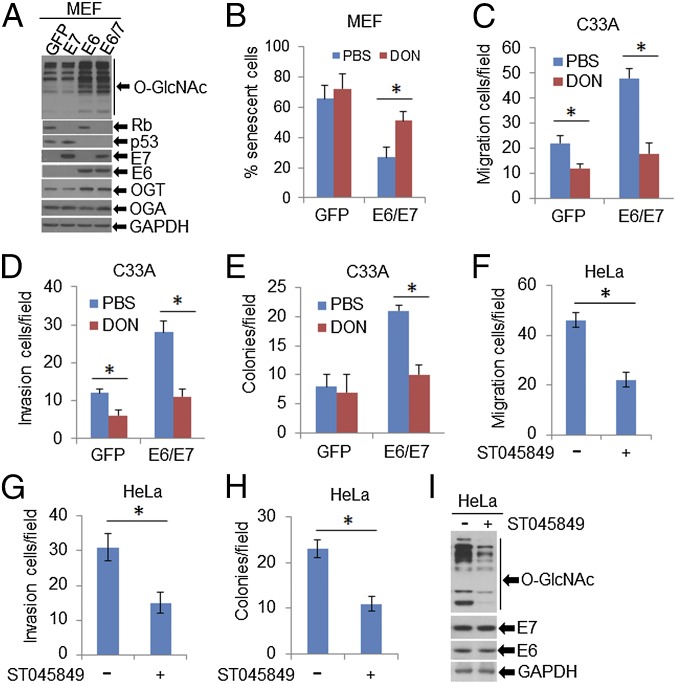
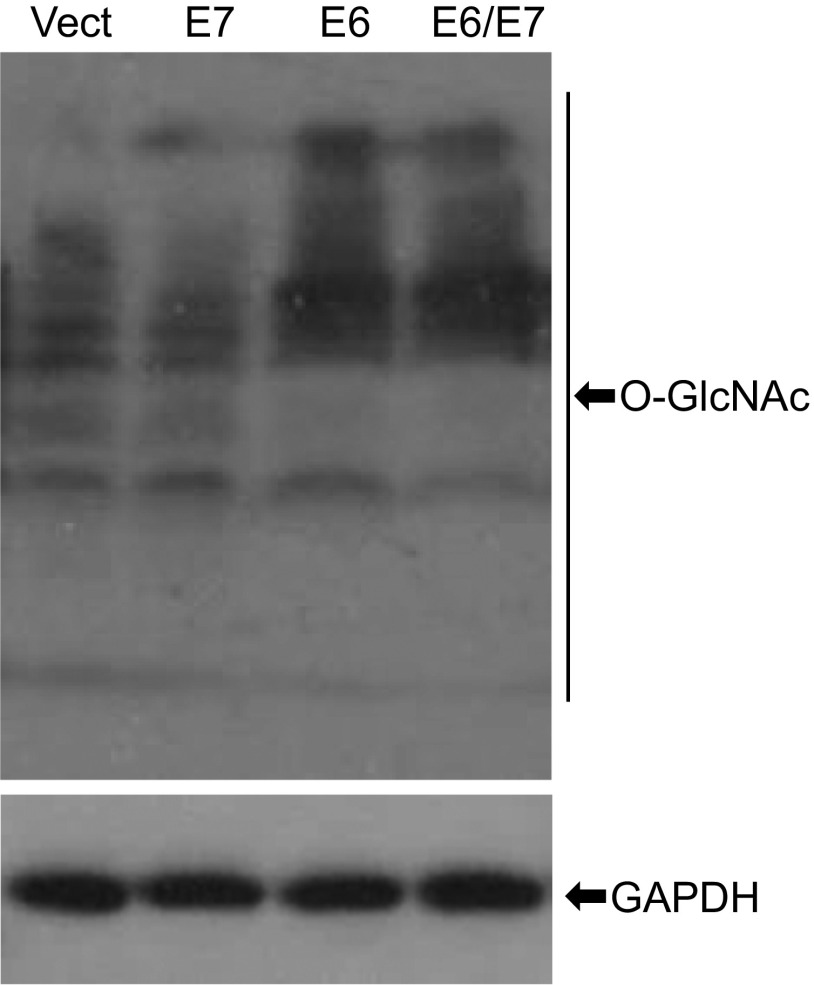
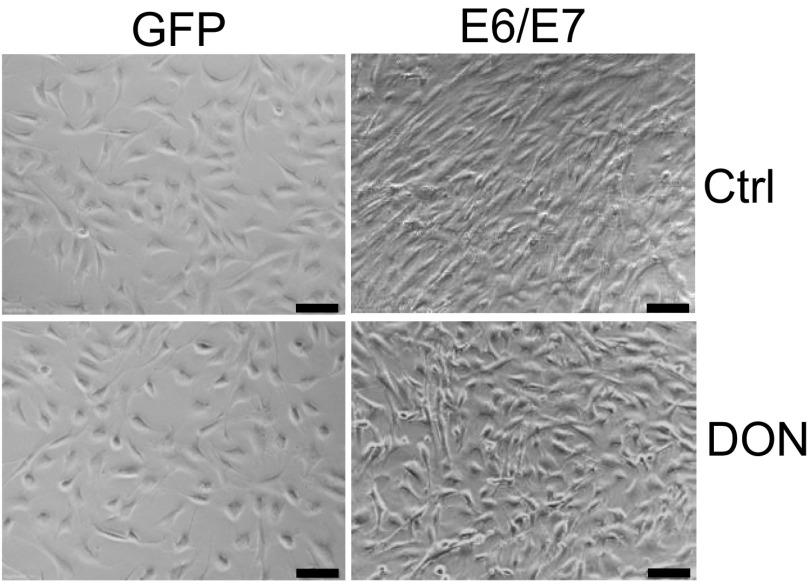
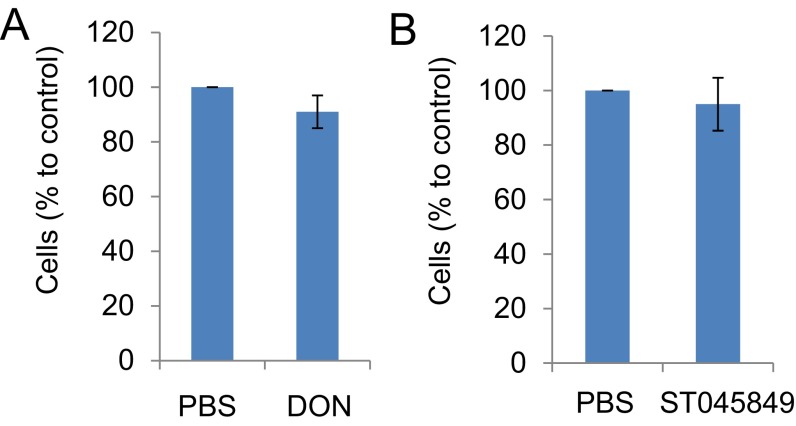
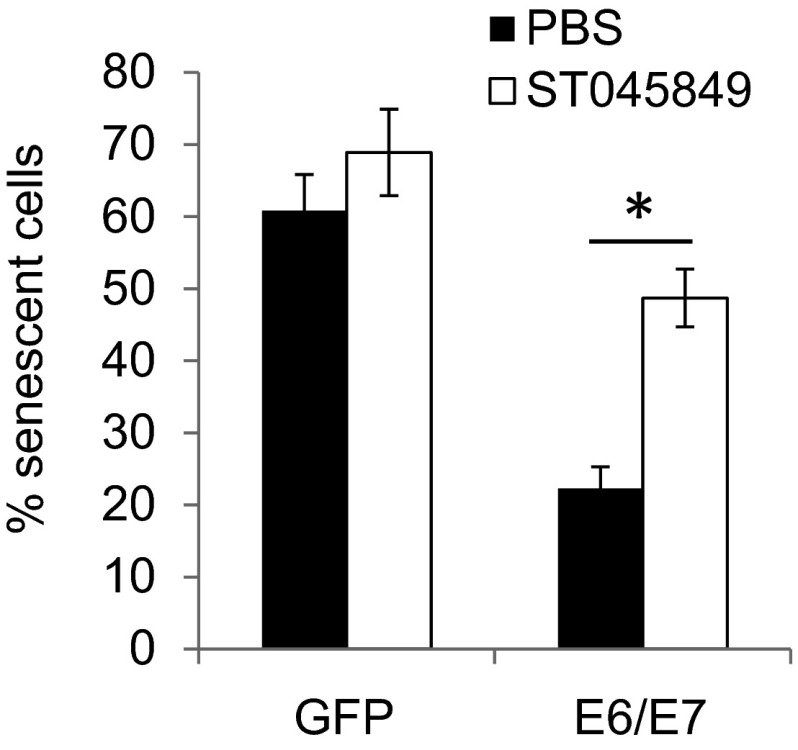
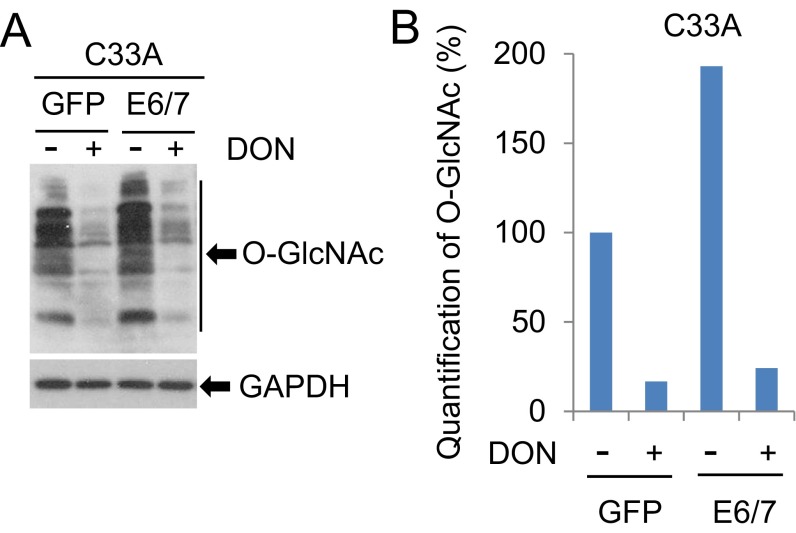
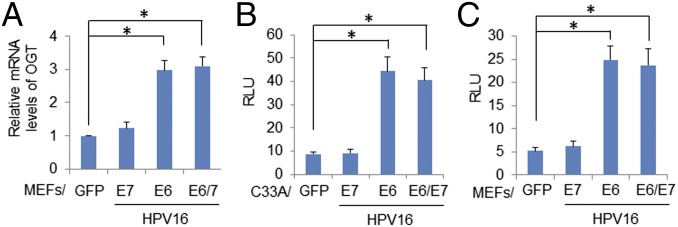
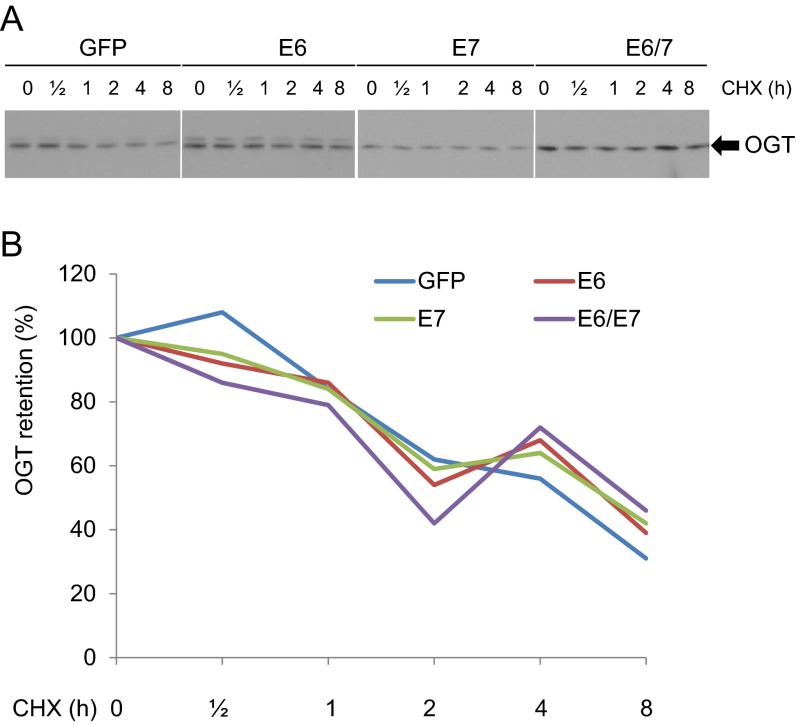
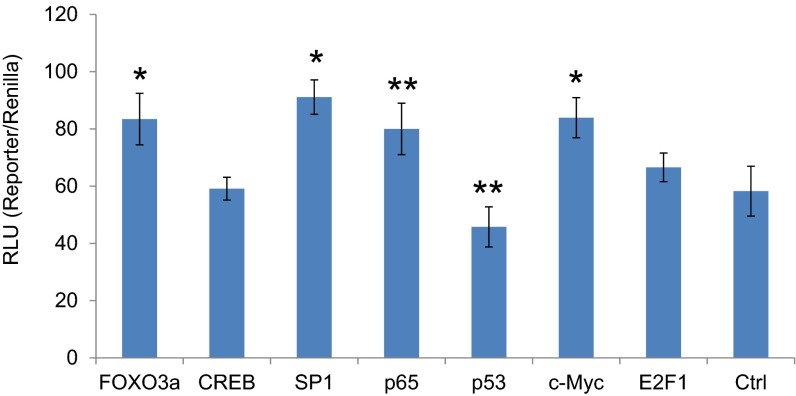
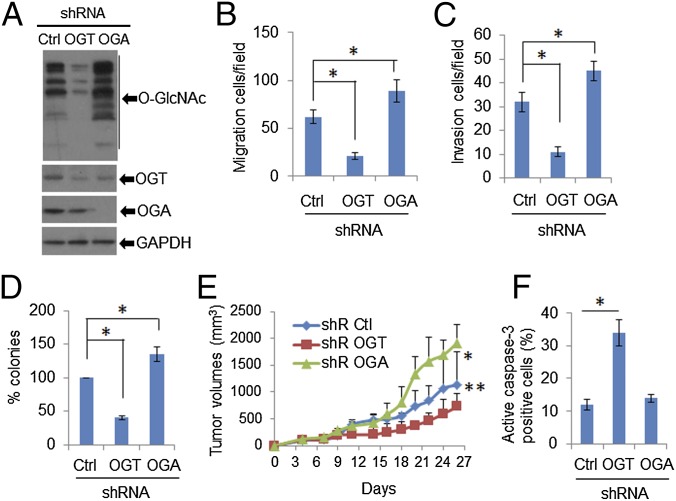
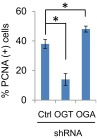
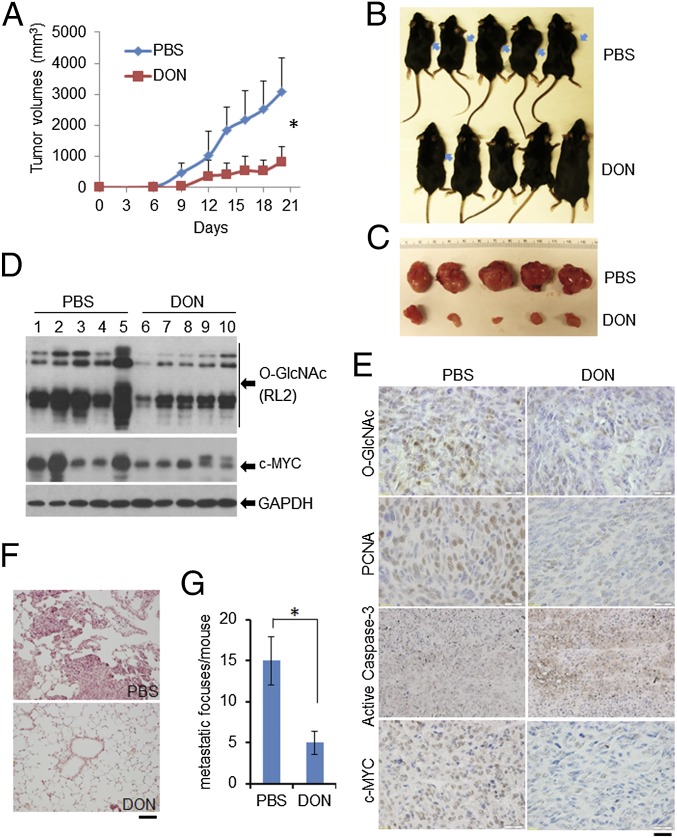
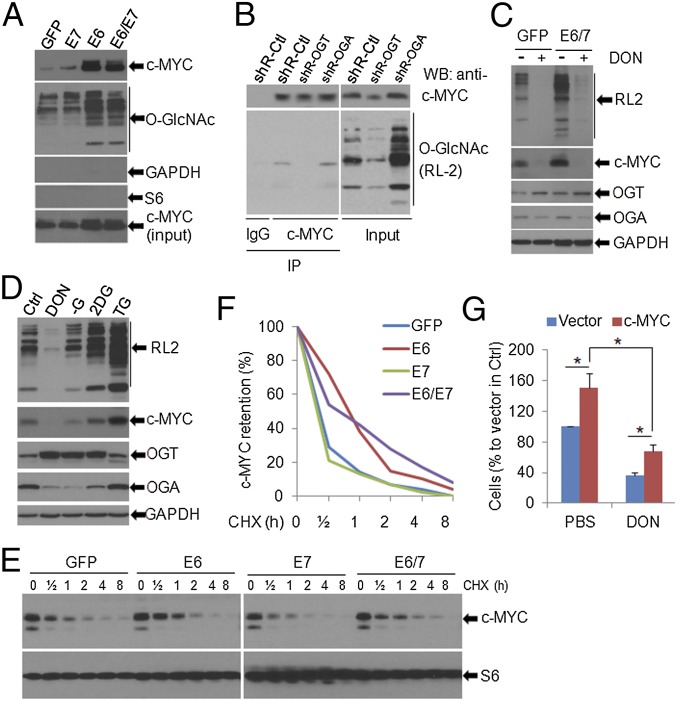
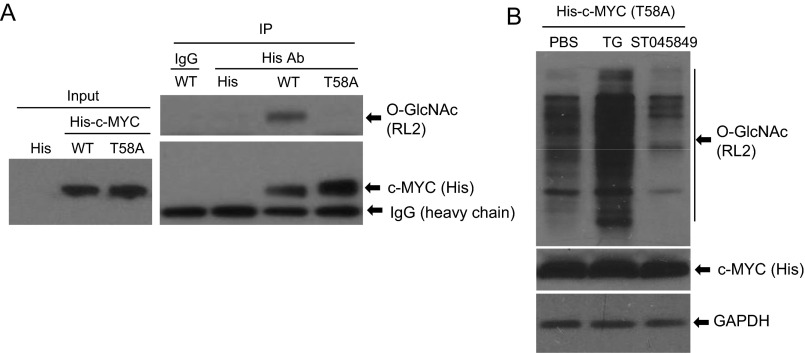
High-risk human papillomaviruses (HPVs) are causative agents of anogenital cancers and a fraction of head and neck cancers. The mechanisms involved in the progression of HPV neoplasias to cancers remain largely unknown. Here, we report that O-linked GlcNAcylation (O-GlcNAc) and O-GlcNAc transferase (OGT) were markedly increased in HPV-caused cervical neoplasms relative to normal cervix, whereas O-GlcNAcase (OGA) levels were not altered. Transduction of HPV16 oncogene E6 or E6/E7 into mouse embryonic fibroblasts (MEFs) up-regulated OGT mRNA and protein, elevated the level of O-GlcNAc, and promoted cell proliferation while reducing cellular senescence. Conversely, in HPV-18-transformed HeLa cervical carcinoma cells, inhibition of O-GlcNAc with a low concentration of a chemical inhibitor impaired the transformed phenotypes in vitro. We showed that E6 elevated c-MYC via increased protein stability attributable to O-GlcNAcylation on Thr58. Reduction of HPV-mediated cell viability by a high concentration of O-GlcNAc inhibitor was partially rescued by elevated c-MYC. Finally, knockdown of OGT or O-GlcNAc inhibition in HeLa cells or in TC-1 cells, a mouse cell line transformed by HPV16 E6/E7 and activated K-RAS, reduced c-MYC and suppressed tumorigenesis and metastasis. Thus, we have uncovered a mechanism for HPV oncoprotein-mediated transformation. These findings may eventually aid in the development of effective therapeutics for HPV-associated malignancies by targeting aberrant O-GlcNAc.

Keywords: HPV E6; HPV oncogenicity; O-linked GlcNAcylation; c-MYC; cervical cancer.


Conflict of interest statement

The authors declare no conflict of interest.

Figures

Fig. 1.
Fig. 1.
O-GlcNAc and OGT are increased in cervical lesions. Human cervical tissues from healthy controls (n = 22), cervical intraepithelial neoplasias (n = 43), and cervical carcinomas (n = 229) were examined. (A) Representative IHC staining of O-GlcNAc with antibody RL2. (Scale bar, 50 µm.) (B) Quantification of O-GlcNAc antigen positivity in the above tissue specimens. Masked reading was performed by two investigators using the same criteria to evaluate the staining (low: overall negative or weak staining; high: overall moderate or strong staining). The Pearson’s χ2-test was used to analyze the distribution difference of O-GlcNAc among human cervical tissues (P < 0.01). (C) H-scores of O-GlcNAc staining in tissues from normal cervix, CINs, and carcinomas (Pearson’s χ2-test, *P < 0.01). (D–F) OGT is elevated in cervical lesions. (D) Representative IHC staining of O-GlcNAc, OGT, and OGA in serial sections of a cervical cancer tissue. (Scale bar, 50 µm.) Black arrows point to the tumor tissue. Red arrows point to the normal cervix. (E) Quantification of OGT and OGA antigen positivity in cervical tissues following the approaches in B (P < 0.01). (F) H-scores of OGT and OGA in normal tissues and cervical diseases were calculated (*P < 0.01).
Fig. S1.
Fig. S1.
Detection of O-GlcNAc in CIN lesions. CIN1 (n = 4), CIN2 (n = 16), and CIN3 (n = 23) were examined. (A) Representative IHC staining of O-GlcNAc in CIN1, -2, and -3 were shown. (Scale bar, 50 µm.) (B) H scores of O-GlcNAc staining in tissues from the CIN lesions were calculated (Pearson’s χ2-test, *P < 0.01).
Fig. S2.
Fig. S2.
Staining patterns of O-GlcNAc, OGT, and p16INK4A in a cervical carcinoma. Three serial tissues from a cervical squamous cell carcinoma were stained with anti–O-GlcNAc (RL2), anti-OGT, and anti-p16INK4A antibodies. Representative IHC staining fields were shown. (Scale bar, 50 µm.)
Fig. 2.
Fig. 2.
O-GlcNAc mediates HPV oncogenic activities. (A and B) MEFs (passage 3) were infected with lentiviruses expressing HPV16 E6, E7, E6/E7, or GFP (control). (A) Whole-cell extracts (WCEs) were analyzed with immunoblots for OGT and OGA as well as with O-GlcNAcylated proteins with respective antibodies. E6, E7, Rb, and p53 were determined for evaluating the HPV16 oncogene expression and function. GAPDH served as a loading control. (B) Percentages of MEFs in senescence at passage 12 were determined after staining with SA–β-gal. Data are average ± SEM of three independent experiments. *P < 0.01. Impact of O-GlcNAcylation on HPV16-induced cell migration (C) and invasion (D) as described in SI Materials and Methods. *P < 0.01 (n = 3). (E) Anchorage-independent cellular growth in soft agar. C33A/GFP and C33A/HPV16-E6/E7 cells were grown on 0.4% agar with 1 μM DON for 2 wk. Colonies were recorded with an Envision light microscope and counted. *P < 0.01 (n = 3). (FI) O-GlcNAc mediates oncogenic activities of HeLa. HPV18-positive HeLa cells were treated with 50 μM ST045849. Migration (F) and invasion (G) assays and anchorage-independent growth (H) were performed as above described. *P < 0.01 (n = 3). WCEs were used for immunoblot analyses. GAPDH served as a loading control (I).
Fig. S3.
Fig. S3.
Detection of O-GlcNAc in HPV18-infected cells. MEFs (passage 3) were infected with retroviruses expressing HPV18 E6, E7, E6/E7, or empty vector (control). WCEs were analyzed with immunoblots for the expression of O-GlcNAcylated proteins with an anti–O-GlcNAc antibody (RL2). GAPDH served as a loading control.
Fig. S4.
Fig. S4.
Inhibition of HPV16 E6/E7-mediated morphological transformation of MEFs upon suppression of O-GlcNAc. Primary MEFs (passage 3) were infected with lentiviruses expressing HPV16 E6/E7 or GFP (control). The cells were then treated with 1 μM DON. Cells were cultured and passaged. Populations of the HPV16 E6/E7-transduced cells were morphologically transformed (at passages 6–9). Representative fields of the cells in passage 9 are shown. (Scale bar, 50 µm.)
Fig. S5.
Fig. S5.
Viability of MEFs upon treatment of DON and ST045849. Primary MEFs (passage 6) were treated with 1 μM DON (A) or 50 μM ST045849 (B) for 72 h. Cell viability was determined by MTT assay. The value in MEFs treated with PBS (control) was set as 100%. The means ± SEM for three independent experiments are shown.
Fig. S6.
Fig. S6.
Percentages of MEFs in senescence after treatment with ST045849. MEFs (passage 3) were infected with lentiviruses expressing HPV16 E6/E7 or GFP (control). Beginning at passage 6, the cells were exposed to 50 μM ST045849 continuously. Percentages of MEFs in senescence at passage 12 were determined after staining with SA–β-gal. Data are average ± SEM of three independent experiments. *P < 0.01.
Fig. S7.
Fig. S7.
Reduction of O-GlcNAc by DON. C33A cells transduced with GFP or HPV16 E6/E7 were treated with 1 µM DON for 24 h. WCEs were harvested for immunoblot analyses. GAPDH served as a loading control (A). O-GlcNAc levels with different treatments in A were quantified with the NIH ImageJ software (B).
Fig. 3.
Fig. 3.
HPV16 E6 or E6/E7 enhances OGT transcription. (A) MEFs were infected with lentiviruses expressing HPV16 E6, E7, E6/E7, or GFP (control). mRNA levels of OGT in the transduced cells were determined by qPCR. The relative mRNA levels were calculated. *P < 0.01 (n = 3). HPV activated the promoter of OGT in C33A cells (B) and in MEFs (C). Human OGT promoter sequences −1010 to +10 were cloned to the pGL3 vector and transfected to the cells expressing HPV16 oncoproteins. The pRL vector expressing wild-type Renilla luciferase was used as a control reporter. Relative luciferase unit (RLU) was the ratio of the OGT promoter-driven luciferase activity to Renilla activity. *P < 0.01 (n = 3).
Fig. S8.
Fig. S8.
Stability of OGT is not affected by HPV16 oncogene expression. MEF/GFP, E6, E7, or E6/E7 were treated with 20 µg/mL cycloheximide (CHX). WCEs were collected at each time point. (A) Immunoblot was conducted to detect the expression of OGT. (B) OGT levels at different time points in (A) were quantified with the NIH ImageJ software.
Fig. S9.
Fig. S9.
Transcription regulation of the OGT promoter by HPV-targeted transcriptional factors. Human OGT promoter sequences −1010 to +10 were cloned to the pGL3 vector and transfected to C33A cells along with constructs expressing Foxo3a, CREB, SP1, NF-κB p65, p53, c-MYC, E2F1, or GFP (Ctrl). The pRL vector expressing wild-type Renilla luciferase was used as a control reporter. RLU was the ratio of OGT promoter-driven luciferase activity to Renilla activity. The means ± SEM for three independent experiments were presented. *P < 0.01 and **P < 0.05 compared with the control (Ctrl) group.
Fig. 4.
Fig. 4.
Knockdown of OGT reduces O-GlcNAc and tumor growth. HeLa cells were stably transduced with lentiviruses expressing shRNA-Ctrl, shRNA-OGT, or shRNA-OGA. (A) Immunoblots were used to detect O-GlcNAc, OGT, and OGA in cell lysates. GAPDH served as a loading control. (B and C) Migration and invasion assays in HeLa cells in which OGT or OGA expression was stably knocked down. *P < 0.01 (n = 3). (D) Anchorage-independent cellular growth in soft agar. *P < 0.01 (n = 3). (E and F) Depletion of OGT reduced tumor growth in SCID mice, whereas OGA knockdown promoted tumor growth. Two million HeLa/shRNA-Ctrl, /shRNA-OGT, or /shRNA-OGA cells were inoculated s.c. under the flank. (E) Tumor volumes were measured every 3 d. *P < 0.01 and **P < 0.05 compared with shRNA-Ctrl group (n = 10). (F) The tumors were removed from euthanized mice. IHC was used to detect cells positive for active cleaved caspase-3 in the tumor tissues. At least 200 cells were counted in each group for determining the percentage of positive cells. *P < 0.01.
Fig. S10.
Fig. S10.
Reduction of tumor growth upon knockdown of OGT. The 2 × 10⁶ HeLa/shRNA-Ctrl, /shRNA-OGT, or /shRNA-OGA cells were inoculated s.c. under the flank. The tumors were removed from euthanized mice at the end of week 3. IHC was used to detect PCNA in the tumor tissues. At least 200 cells were counted in each group for determining the percentage of positive cells. *P < 0.01.
Fig. 5.
Fig. 5.
Suppression of O-GlcNAcylation impedes HPV-positive tumor growth and metastasis in TC-1–induced cancer models in syngeneic mouse. (A–D) The 2 × 10⁶ TC-1 cells were inoculated s.c. under the flank of C57BL6 mouse. Mice were treated with PBS or DON (five mice/group). (A) Tumor volumes for PBS- and DON-treated mice. *P < 0.01, comparison of the tumor volumes between DON and PBS treatment from day 9. (B) Tumors in mice. Arrows indicate the locations of the tumors. (C) Tumors recovered from euthanized mice. (D) O-GlcNAc and c-MYC were reduced in tumors from mice treated with DON. Fresh tumor tissues from the mice were frozen in liquid nitrogen and were kept at −80°. WCEs from the tumor tissues were isolated for immunoblot analyses. GAPDH served as a loading control. (E) IHC detection of O-GlcNAc, PCNA, active cleaved caspase-3, and c-MYC in the tumor tissues. Representative stained tissue sections were presented for each group. (Scale bar, 50 µm.) (F and G) C57BL6 mice were injected with 2 × 10⁵ TC-1 cells via the tail vein. Mice were administered with PBS or DON as in A–D. Lung tissues were collected from euthanized mice, fixed, and stained with H&E. (F) Representative photographs of lung tumor foci. (Scale bar, 100 µm.) Lung metastatic foci in the maximum horizontal layer for each mouse were counted (G). *P < 0.01.
Fig. S11.
Fig. S11.
Unaltered mouse body weights after administration of DON. The 2 × 10⁶ TC-1 cells were inoculated s.c. under the flank of each C57BL6 mouse. The mice were randomly grouped for treatment with PBS or DON (five mice/group). One milligram per kilogram of DON dissolved in 200 µL PBS was administered i.p. on days 1–3 and then repeated every 4 d for a total of seven doses of DON or PBS for each mouse. The body weights of the mice were monitored during the entire treatment process.
Fig. 6.
Fig. 6.
c-MYC is O-GlcNAcylated and stabilized by HPV oncogene expression. (A) O-GlcNAcylated proteins in MEFs transduced with GFP or with HPV16 E7, E6, or E6/E7 were pulled down with succinylated wheat germ agglutinin beads. c-MYC and O-GlcNAc in the pull-down complexes were detected by immunoblotting. (B) c-MYC was O-GlcNAcylated. c-MYC in HeLa/shRNA-Ctrl, shRNA-OGT, and shRNA-OGA cells was immunoprecipiated with a polyclonal antibody to c-MYC (Upper). The O-GlcNAcylated c-MYC was detected with an O-GlcNAc monoclonal antibody, RL2. (C) HPV16 E6/E7 elevated the O-GlcNAcylated proteins and the c-MYC protein. Both enhancements were abolished by the inhibition of O-GlcNAc with DON. MEFs transduced with GFP or E6/E7 were treated with 10 µM DON overnight. The WCEs were harvested for immunoblot analyses. (D) The amounts of c-MYC correlated with the levels of O-GlcNAc. TC-1 cells were treated with 10 µM DON, 10 mM 2-DG, 10 µM TG, or starved (no glucose, −G) for overnight. The WCEs were collected and subjected to immunoblot analyses. In C and D, GAPDH served as a loading control. (E and F) c-MYC was stabilized in HPV16 E6- and E6/E7-expressing cells. MEF/GFP, E6, E7, and E6/E7 cells were treated with 20 µg/mL CHX for the indicated duration. The WCEs were then collected for immunoblots to detect c-MYC and S6 in the cells (E). c-MYC levels at each time point were quantified with NIH ImageJ software (F). (G) Overexpression of c-MYC partially rescued O-GlcNAc inhibition-induced repression of cell viability. HeLa cells were stably transfected with empty vector or c-MYC expression construct. The cells were then selected with 500 µg/mL G418 for 2 wk. The survived clones were pooled and subjected to cell viability assay in the presence or absence of DON (10 µM) for 72 h. *P < 0.01 (n = 3).
Fig. S12.
Fig. S12.
Reduction of O-GlcNAc on ectopic his-c-MYC Thr58A without alterations in total his-c-MYC levels by O-GlcNAc modulators. (A) HeLa cells were transfected with pD40-His/V5-c-MYC, pD40-His/V5-c-MYC Thr58A, or empty His vector for 48 h. WCEs were isolated and immunoprecipitation was performed with His tag antibody or IgG. O-GlcNAc and c-MYC were then detected in the immune precipitates with RL2 or with His tag antibody. Six hundred micrograms of WCEs was used for the co-immunoprecipitation. (B) The abundance of the his-c-MYC Thr58A protein was not affected by modulators of O-GlcNAc. HeLa cells were transfected with pD40-His/V5-c-MYC Thr58A for 48 h. The cells were then exposed to TG (10 µM), ST045849 (50 µM), or PBS for another 24 h. WCEs were collected for immunoblot assays to detect O-GlcNAc, c-MYC, and GAPDH. Thirty micrograms of WCEs was used for the Western blot.

Similar articles

Cited by

References

    1. Walboomers JM, et al. Human papillomavirus is a necessary cause of invasive cervical cancer worldwide. J Pathol. 1999;189(1):12–19. - PubMed
    1. zur Hausen H. Papillomaviruses in the causation of human cancers: A brief historical account. Virology. 2009;384(2):260–265. - PubMed
    1. Lajer CB, von Buchwald C. The role of human papillomavirus in head and neck cancer. APMIS. 2010;118(6-7):510–519. - PubMed
    1. White EA, Howley PM. Proteomic approaches to the study of papillomavirus-host interactions. Virology. 2013;435(1):57–69. - PMC - PubMed
    1. Hart GW, Slawson C, Ramirez-Correa G, Lagerlof O. Cross talk between O-GlcNAcylation and phosphorylation: Roles in signaling, transcription, and chronic disease. Annu Rev Biochem. 2011;80:825–858. - PMC - PubMed

Substances