

Optimized design and analysis of preclinical intervention studies in vivo
- PMID: 27480578
- PMCID: PMC4969752
- DOI: 10.1038/srep30723
Optimized design and analysis of preclinical intervention studies in vivo
Abstract
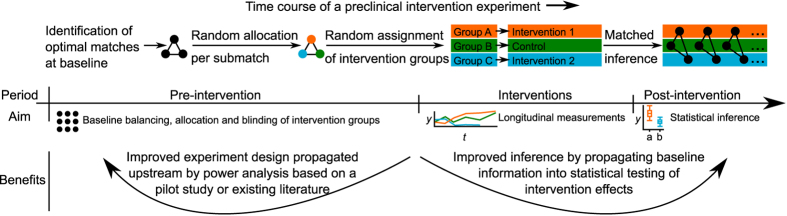
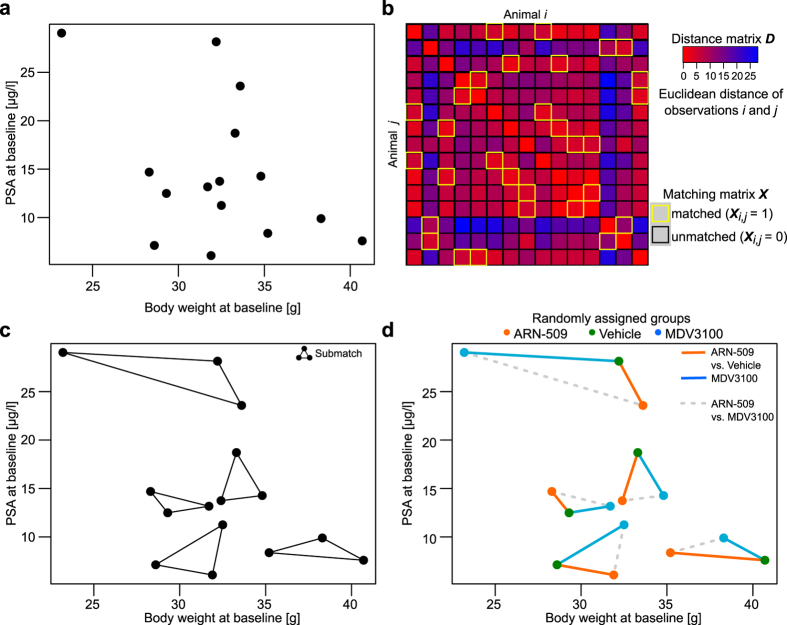
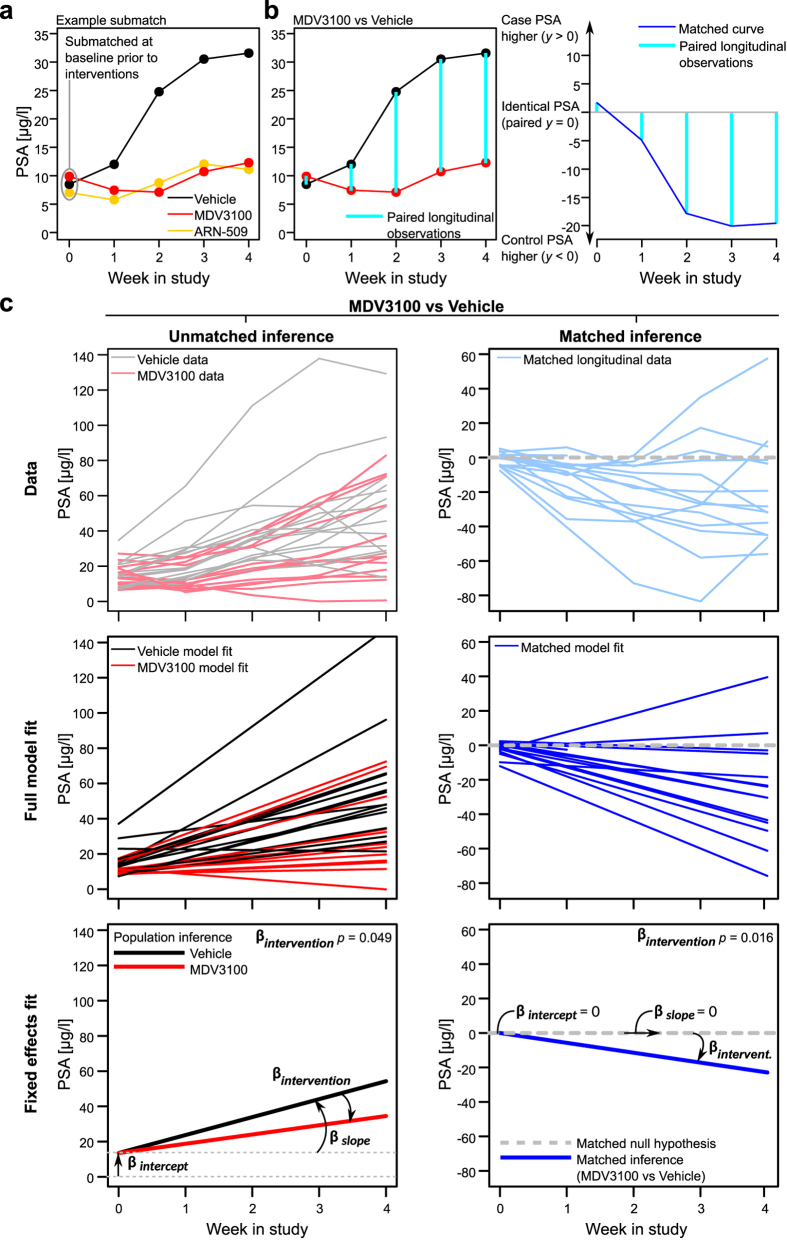
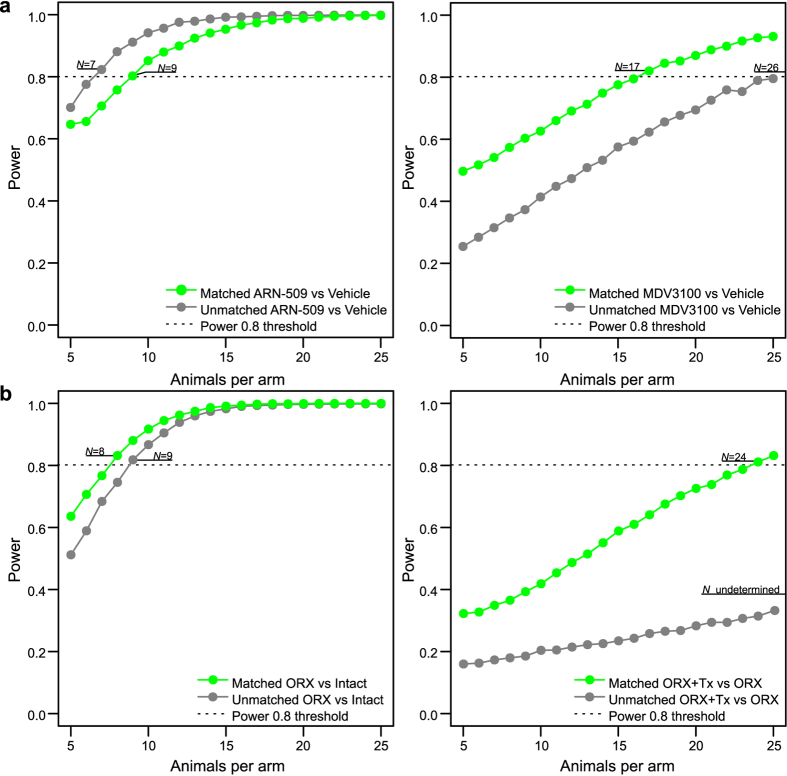
Recent reports have called into question the reproducibility, validity and translatability of the preclinical animal studies due to limitations in their experimental design and statistical analysis. To this end, we implemented a matching-based modelling approach for optimal intervention group allocation, randomization and power calculations, which takes full account of the complex animal characteristics at baseline prior to interventions. In prostate cancer xenograft studies, the method effectively normalized the confounding baseline variability, and resulted in animal allocations which were supported by RNA-seq profiling of the individual tumours. The matching information increased the statistical power to detect true treatment effects at smaller sample sizes in two castration-resistant prostate cancer models, thereby leading to saving of both animal lives and research costs. The novel modelling approach and its open-source and web-based software implementations enable the researchers to conduct adequately-powered and fully-blinded preclinical intervention studies, with the aim to accelerate the discovery of new therapeutic interventions.
Conflict of interest statement
M.P. is the director of Turku Center for Disease Modeling (TCDM), providing preclinical mouse models including statistical analyses of drug interventions. All other authors have declared no competing interests.
Figures
Similar articles
-
Software for animal randomization: A tool for increasing the reproducibility of science.Lab Anim. 2024 Apr;58(2):164-169. doi: 10.1177/00236772231194957. Epub 2023 Oct 28. Lab Anim. 2024. PMID: 37898111 Free PMC article.
-
The usefulness of matched pair randomization for medical practice-based research.Fam Pract Res J. 1992 Sep;12(3):235-43. Fam Pract Res J. 1992. PMID: 1414427
-
Crosstalk between epithelial-mesenchymal transition and castration resistance mediated by Twist1/AR signaling in prostate cancer.Endocr Relat Cancer. 2015 Dec;22(6):889-900. doi: 10.1530/ERC-15-0225. Epub 2015 Aug 26. Endocr Relat Cancer. 2015. PMID: 26311513
-
The power and promise of RNA-seq in ecology and evolution.Mol Ecol. 2016 Mar;25(6):1224-41. doi: 10.1111/mec.13526. Epub 2016 Mar 1. Mol Ecol. 2016. PMID: 26756714 Review.
-
An overview of variance inflation factors for sample-size calculation.Eval Health Prof. 2003 Sep;26(3):239-57. doi: 10.1177/0163278703255230. Eval Health Prof. 2003. PMID: 12971199 Review.
Cited by
-
High intratumoral dihydrotestosterone is associated with antiandrogen resistance in VCaP prostate cancer xenografts in castrated mice.iScience. 2022 Apr 25;25(5):104287. doi: 10.1016/j.isci.2022.104287. eCollection 2022 May 20. iScience. 2022. PMID: 35573198 Free PMC article.
-
Testing Cancer Immunotherapy in a Human Immune System Mouse Model: Correlating Treatment Responses to Human Chimerism, Therapeutic Variables and Immune Cell Phenotypes.Front Immunol. 2021 Mar 29;12:607282. doi: 10.3389/fimmu.2021.607282. eCollection 2021. Front Immunol. 2021. PMID: 33854497 Free PMC article.
-
Reporting animal research: Explanation and elaboration for the ARRIVE guidelines 2.0.PLoS Biol. 2020 Jul 14;18(7):e3000411. doi: 10.1371/journal.pbio.3000411. eCollection 2020 Jul. PLoS Biol. 2020. PMID: 32663221 Free PMC article.
-
Monotherapy efficacy of blood-brain barrier permeable small molecule reactivators of protein phosphatase 2A in glioblastoma.Brain Commun. 2020 Jan 11;2(1):fcaa002. doi: 10.1093/braincomms/fcaa002. eCollection 2020. Brain Commun. 2020. PMID: 32954276 Free PMC article.
-
Perioperative Neurocognitive Disorder: State of the Preclinical Science.Anesthesiology. 2020 Jan;132(1):55-68. doi: 10.1097/ALN.0000000000002956. Anesthesiology. 2020. PMID: 31834869 Free PMC article. Review.
References
Publication types
MeSH terms
LinkOut - more resources
Full Text Sources
Other Literature Sources
Medical
