. 2015 May 19:1:15005.
doi: 10.1038/celldisc.2015.5. eCollection 2015.

Modulation of tumorigenesis by the pro-inflammatory microRNA miR-301a in mouse models of lung cancer and colorectal cancer

Affiliations

Modulation of tumorigenesis by the pro-inflammatory microRNA miR-301a in mouse models of lung cancer and colorectal cancer

Xiaodong Ma et al. Cell Discov. .

Erratum in

Abstract

Lung cancer and colorectal cancer account for over one-third of all cancer deaths in the United States. MicroRNA-301a (miR-301a) is an activator of both nuclear factor-κB (NF-κB) and Stat3, and is overexpressed in both deadly malignancies. In this work, we show that genetic ablation of miR-301a reduces Kras-driven lung tumorigenesis in mice. And miR-301a deficiency protects animals from dextran sodium sulfate-induced colon inflammation and colitis-associated colon carcinogenesis. We also demonstrate that miR-301a deletion in bone marrow-derived cells attenuates tumor growth in the colon carcinogenesis model. Our findings ascertain that one microRNA-miR-301a-activates two major inflammatory pathways (NF-κB and Stat3) in vivo, generating a pro-inflammatory microenvironment that facilitates tumorigenesis.

Keywords: Kras; NF-κB; Stat3; colon cancer; lung cancer; miR-301a; tumor microenvironment.


Figures

Figure 1
Figure 1
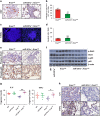
miR-301a deletion reduces lung tumor development and increases survival in KrasLA2 mice. (a) Expression of miR-301a in lung tumors and spleens from KrasLA2 mice. Total RNA of lung and spleen was extracted from WT and KrasLA2 mutant littermates (n=5 per group) at 9, 13, and 18 weeks of age. (b–d) Representative gross (b) and hematoxylin and eosin (H&E) histological sections (c, d) of lungs isolated from KrasLA2 (n=5) and miR-301a−/−;KrasLA2 (n=6) mice at 18 weeks of age. Images in d show the enlargement of boxed areas from c. Scale bars, 5 mm (b, c) or 500 μm (d). (e) Total number of tumor nodules on the lung surface of KrasLA2 (n=5) and miR-301a−/−;KrasLA2 (n=6) littermates at 18 weeks of age. (f) Distribution of various-sized lung tumors from KrasLA2 (n=5) and miR-301a−/−;KrasLA2 (n=6) mice at 18 weeks of age. (g) Tumor spectrum in KrasLA2 (n=34) and miR-301a−/−;KrasLA2 (n=28) mice. (h) Survival curves of KrasLA2 (n=34) and miR-301a−/−;KrasLA2 (n=28) mice (P<0.0001). Values are means±s.d. **P⩽0.01 indicates the significance of the differences between experimental groups.
Figure 2
Figure 2
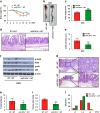
Inhibition of lung tumorigenesis in miR-301a−/−;KrasLA2 mice correlates with reduced NF-κB and Stat3 activation. (a) Cell proliferation in lung adenomas from KrasLA2 (n=5) and miR-301a−/−;KrasLA2 (n=6) at 18 weeks of age as determined by Ki67 staining. The scale bars represent 50 μm. (b) Ki67-positive cell counts in tumor tissue sections. (c) Quantification of apoptotic cells in the lung adenomas from KrasLA2 (n=5) and miR-301a−/−;KrasLA2 (n=6) at 18 weeks of age as determined by TUNEL assay. Scale bars, 200 μm. (d) TUNEL-positive cell counts in tumor tissue sections. (e) Detecting activation of NF-κB and Stat3 in lung adenoma sections from KrasLA2 (n=5) and miR-301a−/−;KrasLA2 (n=6) at 18 weeks of age using antibodies against phospho-p65 and phospho-Stat3. Scale bars, 50 μm. (f) Western blot analysis of p65 and Stat3 to detect NF-κB and Stat3 activation. (g) Relative expression levels of the indicated mRNAs isolated from tumor tissues of WT (n=3), miR-301a−/− (n=3), KrasLA2 (n=5), and miR-301a−/−;KrasLA2 mice (n=5) at 18 weeks of age. (h) IL-6 and TNFα expression in lung adenoma sections from KrasLA2 (n=5) and miR-301a−/−;KrasLA2 (n=6) at 18 weeks of age was determined by immunohistochemistry. Scale bars, 50 μm. Values are means±s.d. **P⩽0.01; *P⩽0.05. NS, not a significant difference between experimental groups.
Figure 3
Figure 3
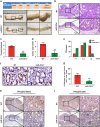
Deletion of miR-301a reduces colitis-associated colon cancer development. (a) Study timeline of CAC and representative overview of colon from treated WT (n=10) and miR-301a−/− (n=10) mice. (b) Hematoxylin and eosin (H&E) histological sections of colon tumors from WT (n=10) and miR-301a−/− (n=10) mice. Scale bars, 500 μm (left) and 100 μm (right). (c–e) Tumor number (c), tumor size (d), and tumor size distribution (e) in WT (n=10) and miR-301a−/− (n=10) mice. Values are means±s.d. **P⩽0.01 indicates the significance of the differences between the indicated groups. (f) Cell proliferation in colon tumors from WT (n=10) and miR-301a−/− (n=10) mice as determined by Ki67 staining. Scale bars, 50 μm. (g) Ki67-positive cell counts in tumor sections of WT (n=10) and miR-301a−/− (n=10) mice. Values are means±s.d. **P⩽0.01 indicates the significance of the differences between the indicated groups. (h, i) Stat3 and NF-κB activation in colon tumors from WT (n=10) and miR-301a−/− (n=10) mice was determined by immunohistochemistry by using antibodies against phospho-Stat3 (h) and phospho-p65 (i). Scale bars, 500 μm (left) and 100 μm (right).
Figure 4
Figure 4
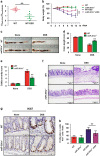
miR-301a deficiency inhibits the severity of colitis. (a) Expression of miR-301a during DSS-induced acute colitis. (b) Body weight loss during DSS-induced colitis in WT (n=10) and miR-301a−/− (n=10) mice. (c) Overview of colon shortening in treated mice. (d) Colon length of WT (n=10) and miR-301a−/− (n=10) mice with and without DSS treatment. (e) Colitis severity score 12 days after DSS-treated WT (n=10) and miR-301a−/− (n=10) mice. (f) Representative histological sections of mouse colon stained with hematoxylin and eosin (H&E; n=10 per group). Scale bars, 200 μm. (g) Cell proliferation during DSS-induced colitis in WT (n=10) and miR-301a−/− (n=10) mice as determined by Ki67 staining. Scale bars, 50 μm. (h) Ki67-positive cell counts in colon sections (n=10 per group). Values are means±s.d. **P⩽0.01 indicates the significance of the differences between the indicated groups.
Figure 5
Figure 5
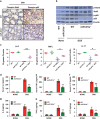
Reduced severity of colitis in miR-301a−/− mice correlates with inhibition of NF-κB and Stat3 activation and downregulation of cytokine expression. (a) Colon sections were stained using antibodies against phospho-Stat3 and phospho-p65 to evaluate activated NF-κB and Stat3 (n=10 per group). Scale bars, 50 μm. (b) Western blot analysis of colon tissue lysates for NF-κB and Stat3 activation. (c) Cytokine gene expression in colon tissues of WT and miR-301a−/− mice as determined by qPCR (n=3 for the untreated group and n=5 for the DSS-treated group). (df) IL-6 (d), TNF-α (e), and IL-17 (f) levels in the serum of WT (n=5) and miR-301a−/− (n=5) mice as determined by ELISA. (g–i) Levels of IL-6 (g), TNF-α (h), and IL-17 (i) secreted from colon ex vivo as determined by ELISA. Values are means±s.d. *P⩽0.05. **P⩽0.01 indicates the significance of the differences between the indicated groups.
Figure 6
Figure 6
Deletion of miR-301a in hematopoietic cells leads to reduced severity of DSS-induced colitis and colitis-associated colon cancer development. WT→WT, WT mice transplanted with bone marrow from WT mice; miR-301a−/−→WT, WT mice transplanted with bone marrow from miR-301a−/− mice (n=5 each). (a) Body weight during DSS-induced colitis in chimeric mice. (b) Overview of colon shortening in DSS-treated mice. (c) Colon length in mice treated with DSS. (d) Representative histological sections of mouse colon stained with hematoxylin and eosin (H&E). Scale bars, 200 μm. (e) Colitis severity score. (f) Western blot analysis of p65 and Stat3 to determine NF-κB and Stat3 activation. (g) H&E histological sections of colon tumors from chimeric mice treated with AOM/DSS. Scale bars, 500 μm (left) and 200 μm (right). (h–j) Bar graphs showing tumor number (h), tumor size (i), and tumor size distribution (j) in AOM/DSS-treated mice. Values are means±s.d. *P⩽0.05. **P⩽0.01 indicates the significance of the differences between the indicated groups.
Figure 7
Figure 7
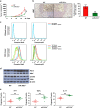
miR-301a deficiency in the tumor microenvironment inhibits tumor growth in mouse xenografts. (a) Tumor growth of LLC1 cells in WT and miR-301a−/− mice (n=10 per group). (b) Cell proliferation in tumors xenografted in WT and miR-301a−/− mice using LLC1 cells as determined by Ki67 staining. Values are means±s.d. Scale bars, 200 μm. (c) Intracellular flow cytometry analysis of phospho-Stat3 (left) and phospho-p65 (right) from single-cell suspensions of spleen in WT and miR-301a−/− mice with (lower) or without (upper) LLC1 tumor implantation. (d) Western blot analysis to determine NF-κB and Stat3 activation in tumors. (e) Expression of cytokine genes in LLC1 tumors grown in WT and miR-301a−/− mice as determined by qPCR. **P<0.01 indicates a significant difference.
Figure 8
Figure 8
Schematic of the effects of miR-301a on inflammation and tumor formation.

Similar articles

Cited by

References

    1. Grivennikov SI, Greten FR, Karin M. Immunity, inflammation, and cancer. Cell 2010; 140: 883–899. - PMC - PubMed
    1. Basseres DS, Ebbs A, Levantini E, Baldwin AS. Requirement of the NF-κB subunit p65/RelA for K-Ras-induced lung tumorigenesis. Cancer Res 2010; 70: 3537–3546. - PMC - PubMed
    1. Finco TS, Westwick JK, Norris JL, Beg AA, Der CJ, Baldwin AS Jr. Oncogenic Ha-Ras-induced signaling activates NF-κB transcriptional activity, which is required for cellular transformation. J Biol Chem 1997; 272: 24113–24116. - PubMed
    1. Takahashi H, Ogata H, Nishigaki R, Broide DH, Karin M. Tobacco smoke promotes lung tumorigenesis by triggering IKKbeta- and JNK1-dependent inflammation. Cancer Cell 2010; 17: 89–97. - PMC - PubMed
    1. Greten FR, Eckmann L, Greten TF, et al. IKKbeta links inflammation and tumorigenesis in a mouse model of colitis-associated cancer. Cell 2004; 118: 285–296. - PubMed

LinkOut - more resources