

Reduced hnRNPA3 increases C9orf72 repeat RNA levels and dipeptide-repeat protein deposition
- PMID: 27461252
- PMCID: PMC5007570
- DOI: 10.15252/embr.201541724
Reduced hnRNPA3 increases C9orf72 repeat RNA levels and dipeptide-repeat protein deposition
Abstract
Intronic hexanucleotide (G4C2) repeat expansions in C9orf72 are genetically associated with frontotemporal lobar degeneration (FTLD) and amyotrophic lateral sclerosis (ALS). The repeat RNA accumulates within RNA foci but is also translated into disease characterizing dipeptide repeat proteins (DPR). Repeat-dependent toxicity may affect nuclear import. hnRNPA3 is a heterogeneous nuclear ribonucleoprotein, which specifically binds to the G4C2 repeat RNA We now report that a reduction of nuclear hnRNPA3 leads to an increase of the repeat RNA as well as DPR production and deposition in primary neurons and a novel tissue culture model that reproduces features of the C9orf72 pathology. In fibroblasts derived from patients carrying extended C9orf72 repeats, nuclear RNA foci accumulated upon reduction of hnRNPA3. Neurons in the hippocampus of C9orf72 patients are frequently devoid of hnRNPA3. Reduced nuclear hnRNPA3 in the hippocampus of patients with extended C9orf72 repeats correlates with increased DPR deposition. Thus, reduced hnRNPA3 expression in C9orf72 cases leads to increased levels of the repeat RNA as well as enhanced production and deposition of DPR proteins and RNA foci.
Keywords: C9orf72; dipeptide repeat proteins; frontotemporal lobar degeneration; hnRNPA3; neurodegeneration.
© 2016 The Authors.
Figures
- A, B
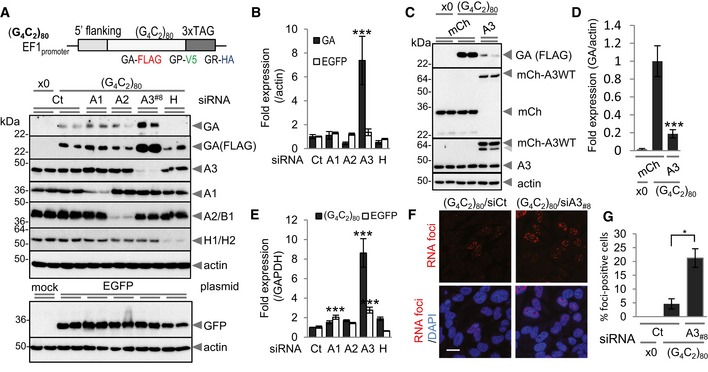
Knockdown of hnRNPA3 increases poly‐GA expression, while expressions of EGFP protein levels are not altered upon knockdown of hnRNPs. The control (“x0″) vector lacks the G4C2 repeats but still contains the 5′ flanking region and 3x TAG.
- C, D
Overexpression of hnRNPA3 suppresses poly‐GA expression. n = 2 experiments performed in duplicates.
- E
Increased repeat RNA upon hnRNPA3 knockdown. EGFP RNA levels are only slightly increased as compared to the levels of the repeat RNA. n = 2 experiments performed in duplicates.
- F, G
Knockdown of hnRNPA3 increases RNA foci. n = 3 replicates; two‐tailed paired t‐test, Scale bar, 20 μm.
- A–C
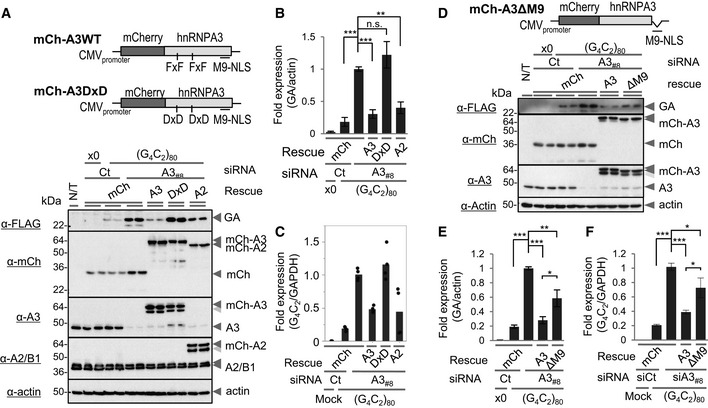
Rescue of repression of poly‐GA and repeat RNA by wild‐type (wt) hnRNPA3 and hnRNPA2 but not by the RNA binding mutant hnRNPA3DxD. (B) n = 3 experiments performed in duplicates; (C) n = 2 experiments performed in duplicates.
- D–F
Rescue of repression of poly‐GA and repeat RNA by hnRNPA3WT but not the M9‐NLS deletion mutant. (E) n = 3 experiments performed in duplicates; (F) n = 4 experiments performed in duplicates.
- A, B
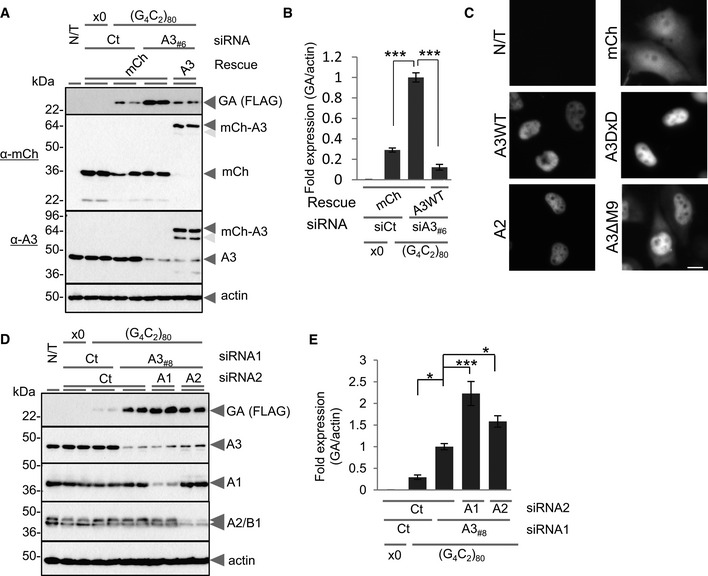
hnRNPA3 knockdown using an independent siRNA targeting hnRNPA3 (siA3#6) increases poly‐GA expression and is rescued by mCherry‐fused hnRNPA3. n = 4 experiments in duplicates.
- C
Partial cytoplasmic distribution of mCherry‐hnRNPΔM9 lacking the M9 nuclear localization signal (NLS). mCherry‐fused hnRNPA3WT, its RNA binding mutant (DxD), and hnRNPA2 are almost completely nuclear. Scale bar, 10 μm. n = 2.
- D, E
Double knockdown of hnRNPA3 and either hnRNPA1 or hnRNPA2 augments poly‐GA expression. n = 4 experiments in duplicates.
- A
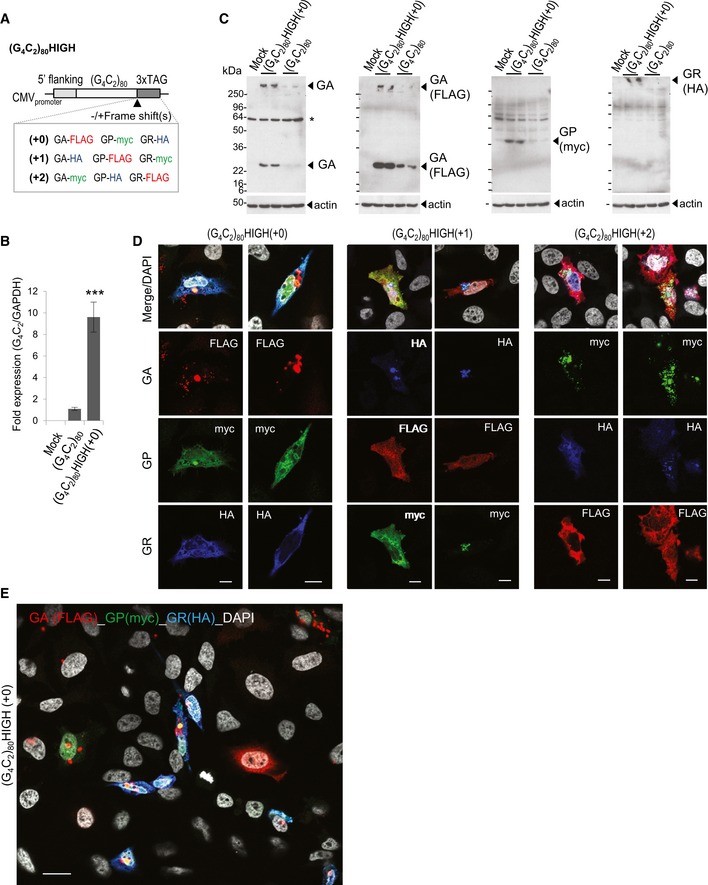
Schematic representation of the repeat RNA expression constructs under the control of the strong CMV promoter.
- B
(G4C2)80HIGH(+0) drives significantly more G4C2 repeat RNA transcription than that of the original (G4C2)80 construct, n = 3 experiments in duplicates. ***P < 0.001; ANOVA with Tukey's post‐test. Mean ± SEM are shown.
- C
Upon transfection of the (G4C2)80HIGH(+0) construct, abundant poly‐GA protein was detected at the expected molecular weight together with insoluble aggregates that remained on the top of the gel as shown before 4. Asterisk indicates unspecific band.
- D, E
All three sense DPRs show variable intracellular distribution upon transient transfection of one of the (G4C2)80HIGH constructs. Cells expressing relatively low amounts of GA show a diffuse GA distribution pattern (see E), whereas cells with high levels contain large cytoplasmic and/or nuclear GA aggregates. GP locates to the cytoplasm and nucleus and often co‐aggregates with GA. GR typically shows a diffuse cytoplasmic distribution. Expression and intracellular distribution pattern of each DPR appears is not affected by different TAGs. Scale bar, 10 μm. n = 3. (E) A large image visualizes frequent DPR expressions with various patterns. Scale bar, 20 μm.
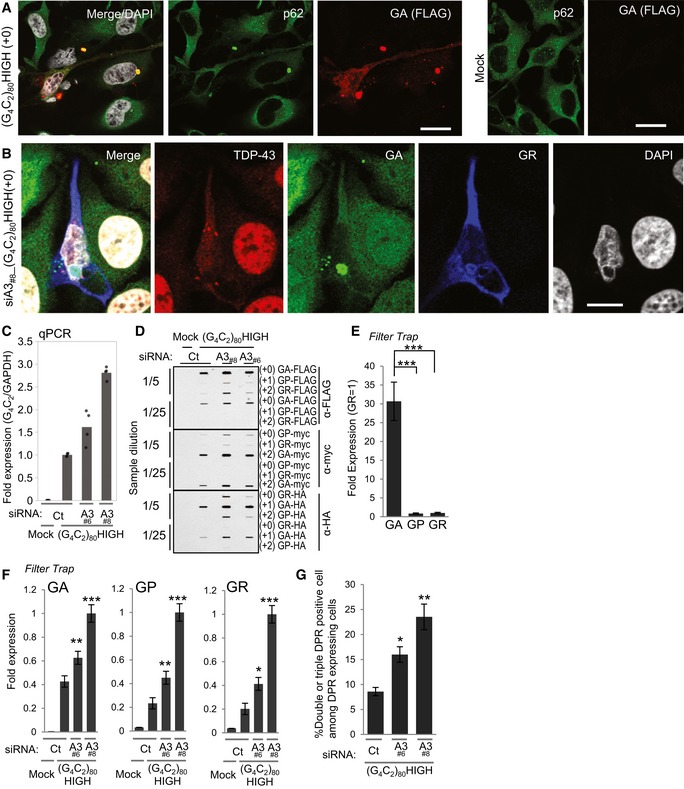
Poly‐GA aggregates co‐localize with p62‐positive deposits.
Redistribution of nuclear TDP‐43 to the cytoplasm in a poly‐GA/poly‐GR double‐positive cell. Note that nuclei of poly‐GA/poly‐GR double‐positive cells are frequently disrupted.
Knockdown of hnRNPA3 increases repeat RNA expression. n = 2 experiments performed in duplicates.
Filter trap assay probed with anti‐FLAG, anti‐myc, or anti‐HA antibodies reveal abundant DPR production.
Relative expression level of poly‐GA, poly‐GP, and poly‐GR normalized to GR. n = 3 experiments.
Expression of all three DPRs is increased upon knockdown of hnRNPA3. Signals from knockdown with siRNA#8 were normalized to 1. n = 3 experiments.
Co‐expression of two/three different DPRs in single cells is increased upon hnRNPA3 knockdown. n = 3 replicates.
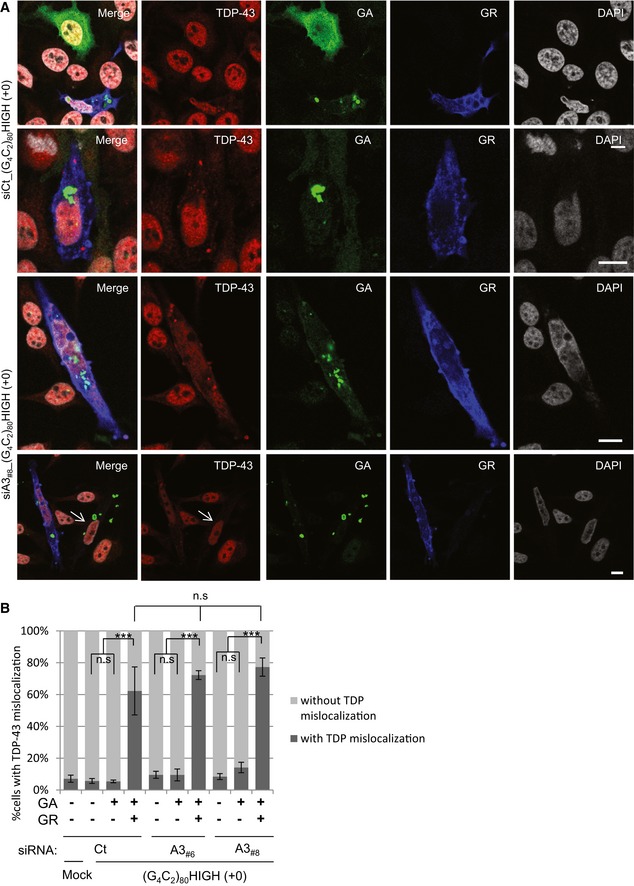
Representative examples of endogenous TDP‐43 mislocalization in GA and GR co‐expressing cells. GA deposit‐positive but GR‐negative cell (arrow) shows normal TDP‐43 distribution (lowest panels). Nuclei were counterstained with DAPI. Scale bar, 10 μm.
Poly‐GA and poly‐GR double‐positive cells frequently show increased mislocalization of endogenous TDP‐43. In three independent experiments, 697, 852, 287, 32, 767, 201, 40, 728, 207, and 64 cells per column were analyzed. ***P < 0.001; ANOVA with Tukey's post‐test. Mean ± SEM are shown.
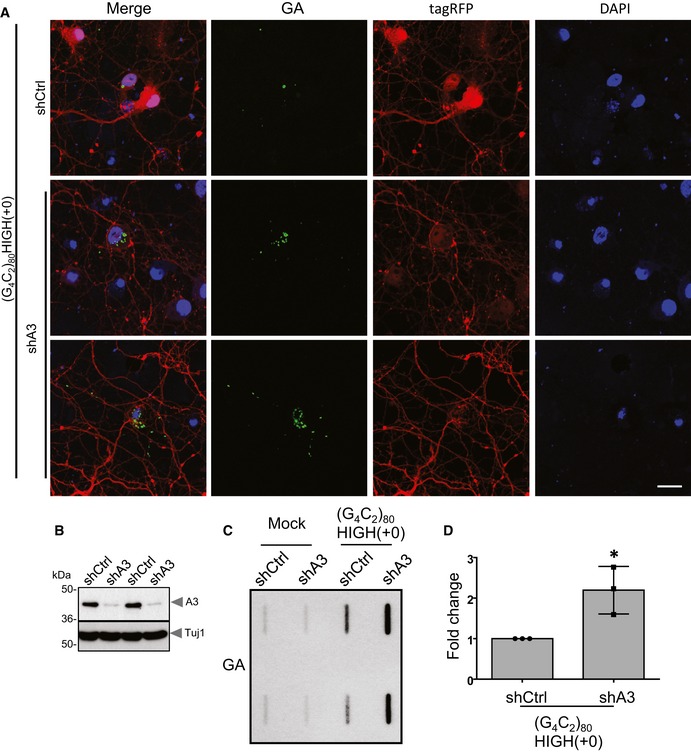
Neurons were fixed, immunostained, and imaged by confocal microscopy. Double immunofluorescence for poly‐GA aggregates (green) and tagRFP (red). Nuclei were labeled with DAPI. Scale bar represents 20 μm.
Efficient knockdown of endogenous rat hnRNPA3 with its targeting shRNA.
Poly‐GA aggregates were detected in a filter trap assay using an anti‐Flag antibody.
The amounts of poly‐GA aggregates were quantified and are presented as the fold change of signals from neurons treated with the control shRNA or the repeat construct. Means ± SD of three independent experiments are shown. *P < 0.05 by a Student's t‐test. n = 3 replicates.
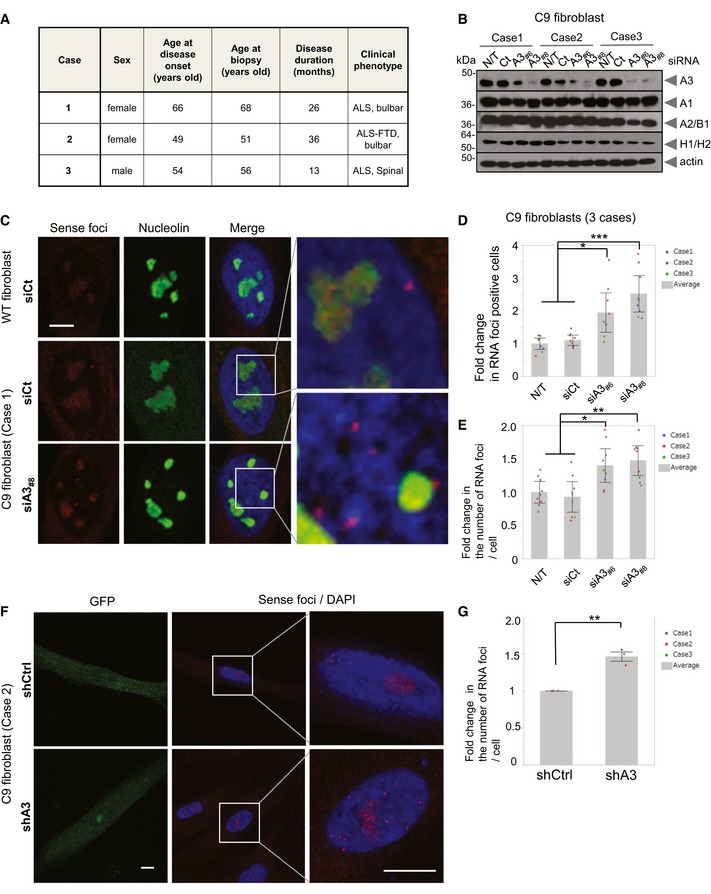
Fibroblasts from three individual patients with confirmed C9orf72 repeat expansions were investigated.
Knockdown of hnRNPA3 with two independent siRNA results in selective depletion of hnRNPA3 in fibroblasts from 3 C9orf72 repeat carriers. Actin was used as a loading control.
Knockdown of hnRNPA3 increases RNA foci in cells derived from C9orf72 carriers. No G4C2 repeat RNA foci are detected in fibroblasts without C9orf72 repeat expansions (WT). Nucleoli were stained with anti‐nucleolin antibodies (green), and nuclei were stained with DAPI (blue). Scale bar, 10 μm.
Quantification of the relative frequency of RNA foci‐positive cells (RNA foci positivity; fold change). n = 3 experiments for each case. The average foci number of non‐treated (N/T) fibroblast was normalized to 1. Color code labels values obtained in fibroblasts derived from the three individual patients. Bars indicate mean, individual points indicate mean values obtained from a single experiment (49–214 cells were counted in a single experiment), and error bars indicate 95% CI. *P < 0.05, ***P < 0.001; ANOVA with Tukey–Kramer HSD test.
Quantification of the number of RNA foci per RNA foci‐positive cell (fold change). n = 3 experiments for each case. The average foci number of non‐treated (N/T) fibroblast was normalized to 1. Color code labels values obtained in fibroblasts derived from the three individual patients. Bars indicate mean, individual points indicate mean values obtained from a single experiment (49–214 cells were counted in a single experiment), and error bars indicate 95% CI. *P < 0.05, **P < 0.01; ANOVA with Tukey–Kramer HSD test.
Representative presentation of increased RNA foci in C9orf72 carriers upon lentiviral‐mediated hnRNPA3 knockdown. Scale bar, 10 μm.
Quantification of the number of RNA foci (fold change). Three cases were analyzed. Single points indicate an average obtained from 29 to 30 cells per case. Color code labels values obtained in fibroblasts derived from the three individual patients. Mean ± SEM. **P < 0.01; two‐tailed t‐test.
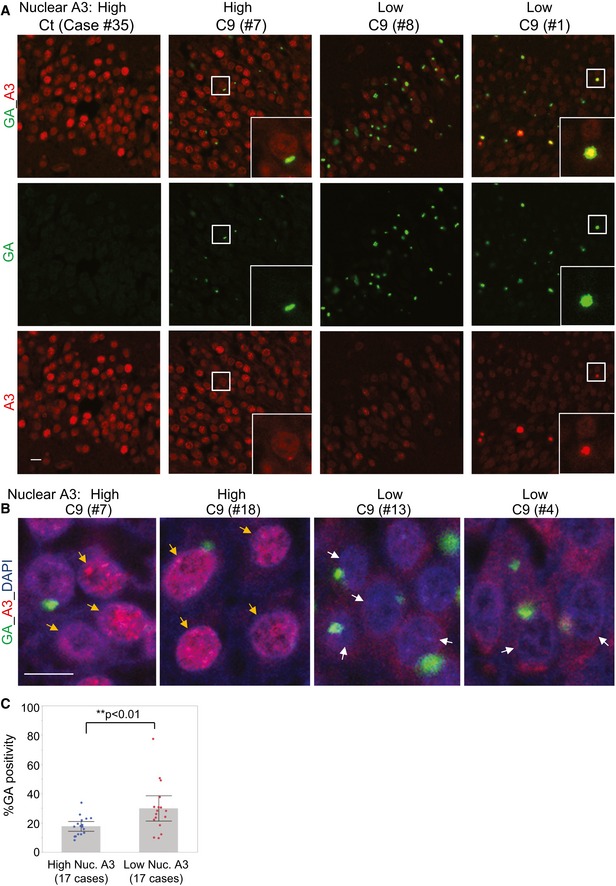
Double immunofluorescence staining with anti‐GA (green) and anti‐hnRNPA3 (red) antibodies of the granular layer of the dentate gyrus of a control case and three C9orf72 mutation cases. In C9 mutation cases with low nuclear hnRNPA3 expression (#8 & #1), more poly‐GA aggregates were observed as in cases with high nuclear hnRNPA3 (#7). Inserts show examples of co‐localization of poly‐GA and hnRNPA3 aggregates. Scale bar, 10 μm.
Granular layer neurons of a C9orf72 mutation case with (white arrows) or without (orange arrows) nuclear clearance of hnRNPA3. Scale bar, 10 μm.
Poly‐GA aggregates are more frequent in C9orf72 mutation cases with lower nuclear hnRNPA3 levels than in those cases with higher nuclear hnRNPA3 levels (divided by median of nuclear hnRNPA3 intensities in 34 C9orf72 mutation cases into two subgroups). Bar graph indicates mean values. Error bars indicate 95% CI. Single points indicate mean from three micrographs per case. Note that the difference in GA positivity between both groups remains significant (P = 0.0086) after removal of the highest outlier in the low nuclear A3 group; two‐tailed t‐test.
Similar articles
-
Poly-glycine-alanine exacerbates C9orf72 repeat expansion-mediated DNA damage via sequestration of phosphorylated ATM and loss of nuclear hnRNPA3.Acta Neuropathol. 2020 Jan;139(1):99-118. doi: 10.1007/s00401-019-02082-0. Epub 2019 Oct 23. Acta Neuropathol. 2020. PMID: 31642962 Free PMC article.
-
Therapeutic reduction of GGGGCC repeat RNA levels by hnRNPA3 suppresses neurodegeneration in Drosophila models of C9orf72-linked ALS/FTD.Hum Mol Genet. 2023 May 5;32(10):1673-1682. doi: 10.1093/hmg/ddac298. Hum Mol Genet. 2023. PMID: 36611007
-
Sequestration of multiple RNA recognition motif-containing proteins by C9orf72 repeat expansions.Brain. 2014 Jul;137(Pt 7):2040-51. doi: 10.1093/brain/awu120. Epub 2014 May 27. Brain. 2014. PMID: 24866055 Free PMC article.
-
RNA Dysmetabolism and Repeat-Associated Non-AUG Translation in Frontotemporal Lobar Degeneration/Amyotrophic Lateral Sclerosis due to C9orf72 Hexanucleotide Repeat Expansion.JMA J. 2023 Jan 16;6(1):9-15. doi: 10.31662/jmaj.2022-0160. Epub 2022 Dec 23. JMA J. 2023. PMID: 36793534 Free PMC article. Review.
-
C9orf72 isoforms in Amyotrophic Lateral Sclerosis and Frontotemporal Lobar Degeneration.Brain Res. 2016 Sep 15;1647:43-49. doi: 10.1016/j.brainres.2016.04.062. Epub 2016 Apr 29. Brain Res. 2016. PMID: 27134035 Review.
Cited by
-
HnRNP Pathologies in Frontotemporal Lobar Degeneration.Cells. 2023 Jun 15;12(12):1633. doi: 10.3390/cells12121633. Cells. 2023. PMID: 37371103 Free PMC article. Review.
-
Heterogeneous ribonuclear protein E2 (hnRNP E2) is associated with TDP-43-immunoreactive neurites in Semantic Dementia but not with other TDP-43 pathological subtypes of Frontotemporal Lobar Degeneration.Acta Neuropathol Commun. 2017 Jun 30;5(1):54. doi: 10.1186/s40478-017-0454-4. Acta Neuropathol Commun. 2017. PMID: 28666471 Free PMC article.
-
Role of RNA Binding Proteins with prion-like domains in muscle and neuromuscular diseases.Cell Stress. 2020 Mar 10;4(4):76-91. doi: 10.15698/cst2020.04.217. Cell Stress. 2020. PMID: 32292882 Free PMC article. Review.
-
The MDM2 inducible promoter folds into four-tetrad antiparallel G-quadruplexes targetable to fight malignant liposarcoma.Nucleic Acids Res. 2021 Jan 25;49(2):847-863. doi: 10.1093/nar/gkaa1273. Nucleic Acids Res. 2021. PMID: 33410915 Free PMC article.
-
The RNA exosome complex degrades expanded hexanucleotide repeat RNA in C9orf72 FTLD/ALS.EMBO J. 2020 Oct 1;39(19):e102700. doi: 10.15252/embj.2019102700. Epub 2020 Aug 24. EMBO J. 2020. PMID: 32830871 Free PMC article.
References
-
- Gendron TF, Bieniek KF, Zhang YJ, Jansen‐West K, Ash PE, Caulfield T, Daughrity L, Dunmore JH, Castanedes‐Casey M, Chew J et al (2013) Antisense transcripts of the expanded C9ORF72 hexanucleotide repeat form nuclear RNA foci and undergo repeat‐associated non‐ATG translation in c9FTD/ALS. Acta Neuropathol 126: 829–844 - PMC - PubMed
-
- Mori K, Arzberger T, Grasser FA, Gijselinck I, May S, Rentzsch K, Weng SM, Schludi MH, van der Zee J, Cruts M et al (2013) Bidirectional transcripts of the expanded C9orf72 hexanucleotide repeat are translated into aggregating dipeptide repeat proteins. Acta Neuropathol 126: 881–893 - PubMed
-
- Mori K, Weng SM, Arzberger T, May S, Rentzsch K, Kremmer E, Schmid B, Kretzschmar HA, Cruts M, Van Broeckhoven C et al (2013) The C9orf72 GGGGCC repeat is translated into aggregating dipeptide‐repeat proteins in FTLD/ALS. Science 339: 1335–1338 - PubMed
Publication types
MeSH terms
Substances
LinkOut - more resources
Full Text Sources
Other Literature Sources
Molecular Biology Databases
Miscellaneous
