Antibiotic-induced perturbations in gut microbial diversity influences neuro-inflammation and amyloidosis in a murine model of Alzheimer's disease
- PMID: 27443609
- PMCID: PMC4956742
- DOI: 10.1038/srep30028
Antibiotic-induced perturbations in gut microbial diversity influences neuro-inflammation and amyloidosis in a murine model of Alzheimer's disease
Abstract
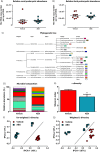
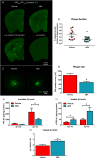
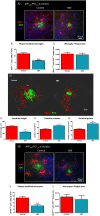
Severe amyloidosis and plaque-localized neuro-inflammation are key pathological features of Alzheimer's disease (AD). In addition to astrocyte and microglial reactivity, emerging evidence suggests a role of gut microbiota in regulating innate immunity and influencing brain function. Here, we examine the role of the host microbiome in regulating amyloidosis in the APPSWE/PS1ΔE9 mouse model of AD. We show that prolonged shifts in gut microbial composition and diversity induced by long-term broad-spectrum combinatorial antibiotic treatment regime decreases Aβ plaque deposition. We also show that levels of soluble Aβ are elevated and that levels of circulating cytokine and chemokine signatures are altered in this setting. Finally, we observe attenuated plaque-localised glial reactivity in these mice and significantly altered microglial morphology. These findings suggest the gut microbiota community diversity can regulate host innate immunity mechanisms that impact Aβ amyloidosis.
Figures


Similar articles
-
Antibiotic-induced perturbations in microbial diversity during post-natal development alters amyloid pathology in an aged APPSWE/PS1ΔE9 murine model of Alzheimer's disease.Sci Rep. 2017 Sep 5;7(1):10411. doi: 10.1038/s41598-017-11047-w. Sci Rep. 2017. PMID: 28874832 Free PMC article.
-
Sodium oligomannate alters gut microbiota, reduces cerebral amyloidosis and reactive microglia in a sex-specific manner.Mol Neurodegener. 2024 Feb 17;19(1):18. doi: 10.1186/s13024-023-00700-w. Mol Neurodegener. 2024. PMID: 38365827 Free PMC article.
-
Deletion of the type-1 interferon receptor in APPSWE/PS1ΔE9 mice preserves cognitive function and alters glial phenotype.Acta Neuropathol Commun. 2016 Jul 11;4(1):72. doi: 10.1186/s40478-016-0341-4. Acta Neuropathol Commun. 2016. PMID: 27400725 Free PMC article.
-
Role of gut-brain axis, gut microbial composition, and probiotic intervention in Alzheimer's disease.Life Sci. 2021 Jan 1;264:118627. doi: 10.1016/j.lfs.2020.118627. Epub 2020 Oct 22. Life Sci. 2021. PMID: 33169684 Review.
-
Innate Immune Influences on the Gut Microbiome: Lessons from Mouse Models.Trends Immunol. 2018 Dec;39(12):992-1004. doi: 10.1016/j.it.2018.10.004. Epub 2018 Oct 28. Trends Immunol. 2018. PMID: 30377046 Review.
Cited by
-
Correlation Between Regulation of Intestinal Flora by Danggui-Shaoyao-San and Improvement of Cognitive Impairment in Mice With Alzheimer's Disease.Brain Behav. 2024 Nov;14(11):e70110. doi: 10.1002/brb3.70110. Brain Behav. 2024. PMID: 39482855 Free PMC article.
-
Implications of Microorganisms in Alzheimer's Disease.Curr Issues Mol Biol. 2022 Sep 30;44(10):4584-4615. doi: 10.3390/cimb44100314. Curr Issues Mol Biol. 2022. PMID: 36286029 Free PMC article. Review.
-
Early modulation of the gut microbiome by female sex hormones alters amyloid pathology and microglial function.Sci Rep. 2024 Jan 21;14(1):1827. doi: 10.1038/s41598-024-52246-6. Sci Rep. 2024. PMID: 38246956 Free PMC article.
-
The Microbiome-Gut-Brain Axis and Dementia: A Bibliometric Analysis.Int J Environ Res Public Health. 2022 Dec 9;19(24):16549. doi: 10.3390/ijerph192416549. Int J Environ Res Public Health. 2022. PMID: 36554429 Free PMC article.
-
The Role of Functional Amyloids in Bacterial Virulence.J Mol Biol. 2018 Oct 12;430(20):3657-3684. doi: 10.1016/j.jmb.2018.07.010. Epub 2018 Jul 12. J Mol Biol. 2018. PMID: 30009771 Free PMC article. Review.
References
-
- Arends Y. M., Duyckaerts C., Rozemuller J. M., Eikelenboom P. & Hauw J. J. Microglia, amyloid and dementia in alzheimer disease. A correlative study. Neurobiology of aging 21, 39–47 (2000). - PubMed
-
- Delacourte A. General and dramatic glial reaction in Alzheimer brains. Neurology 40, 33–37 (1990). - PubMed
Publication types
MeSH terms
Substances
Grants and funding
LinkOut - more resources
Full Text Sources
Other Literature Sources
Medical
Molecular Biology Databases

