. 2016 Jul 18;12(7):e1006162.
doi: 10.1371/journal.pgen.1006162. eCollection 2016 Jul.

Fragment Length of Circulating Tumor DNA

Affiliations

Fragment Length of Circulating Tumor DNA

Hunter R Underhill et al. PLoS Genet. .

Abstract

Malignant tumors shed DNA into the circulation. The transient half-life of circulating tumor DNA (ctDNA) may afford the opportunity to diagnose, monitor recurrence, and evaluate response to therapy solely through a non-invasive blood draw. However, detecting ctDNA against the normally occurring background of cell-free DNA derived from healthy cells has proven challenging, particularly in non-metastatic solid tumors. In this study, distinct differences in fragment length size between ctDNAs and normal cell-free DNA are defined. Human ctDNA in rat plasma derived from human glioblastoma multiforme stem-like cells in the rat brain and human hepatocellular carcinoma in the rat flank were found to have a shorter principal fragment length than the background rat cell-free DNA (134-144 bp vs. 167 bp, respectively). Subsequently, a similar shift in the fragment length of ctDNA in humans with melanoma and lung cancer was identified compared to healthy controls. Comparison of fragment lengths from cell-free DNA between a melanoma patient and healthy controls found that the BRAF V600E mutant allele occurred more commonly at a shorter fragment length than the fragment length of the wild-type allele (132-145 bp vs. 165 bp, respectively). Moreover, size-selecting for shorter cell-free DNA fragment lengths substantially increased the EGFR T790M mutant allele frequency in human lung cancer. These findings provide compelling evidence that experimental or bioinformatic isolation of a specific subset of fragment lengths from cell-free DNA may improve detection of ctDNA.


Conflict of interest statement

The authors have declared that no competing interests exist.

Figures
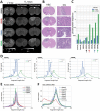
Fig 1
Fig 1. Periodicity and shorter fragment length of ctDNA derived from GBM8.
In A, coronal f maps and pre- and post-contrast R1 maps with matched histology (B) and percent of human ctDNA detected in rat plasma (C, colored arrows identify results that correspond to images in A). GBM42 is a small tumor (A, white arrow) confirmed on histology (B, black box) with no evidence of a disrupted blood-brain barrier (i.e., post-contrast enhancement on R1 maps; A). In GBM81, a large tumor (white arrow on f map) is associated with disruption of the blood-brain barrier above the corpus callosum, but not below (asterisk on f map). GBM83 is an infiltrating tumor (white arrow) with no evidence of blood-brain barrier disruption, but possible invasion into the ventricle as identified on histology (B, black box). GBM84 is a large bulky tumor with disruption of the blood-brain barrier (A). Human ctDNA was detected at a level above the control animals for all GBM8 tumors (C). Fragment length distribution for rat cell-free DNA (green line) and human ctDNA (blue line) inferred from paired-end sequencing are plotted in D. All detected ctDNA demonstrated the same strong periodicity and shorter fragment length compared to rat cell-free DNA (E). Distribution of normal rat cell-free DNA was largely consistent between animals (F).
Fig 2
Fig 2. The ctDNA from GBM4 and hepatocellular carcinoma have a similar shortening of fragment length as GBM8.
GBM44 is a small tumor (A, white arrow) confirmed on histology (B, black box) with evidence of a disrupted blood-brain barrier by presence of contrast enhancement on post-contrast R1 maps. The fragment length and periodicity seen previously in GBM8 (Fig 1) are also present in GBM4 (C), which also replicates in new animals with GBM8, as shown in GBM86 and GBM87. Histology from an animal implanted with human hepatocellular carcinoma (Hep G2 cells) in the flank identified a highly vascular tumor (D). The ctDNA from human hepatocellular carcinoma had a similar fragment length (E) that was seen in the GBM tumors suggesting that the observed differences in fragment length were not secondary to effects of the blood-brain barrier or specific to GBM.
Fig 3
Fig 3. The cell-free DNA and ctDNA from melanoma patients consisted of shorter fragments than the healthy controls and the WT allele fragments.
In A, the relative fragment length of cell-free DNA obtained from melanoma patients with and without metastatic disease (± lymph node, LN; A) tended to be shorter by densitometry compared to cell-free DNA from four healthy controls (A, gray lines). In B, the fragment lengths derived from cell-free DNA deep-sequencing in a patient with melanoma (A, black arrow) were generally shorter than the fragment lengths present in the pool of healthy controls (green and purple lines, respectively). (C) In the melanoma patient, cell-free DNA fragment lengths containing the mutant allele (BRAF V600E, red line) were shorter compared to the fragment lengths containing the wild-type (WT) allele (blue line). In the shorter fragments there was general overlap between the mutant and WT allele sizes since the BRAF V600E mutation is heterozygous. (D) Fragment lengths between 110–140 bp had the highest proportion of the mutant allele (D, red solid line; the mutant allele frequency <100 bp was erratic due to few observations). In D, the solid black line represents the overall frequency for each range of fragment lengths in the melanoma patient and indicates that there may be insufficient amount of DNA for detecting mutant alleles below 100 bp. Of note, the WT allele from the healthy control occurred more commonly between 160–180 bp (D, blue dashed line).
Fig 4
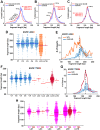
Fig 4. In lung cancer patients, mutant alleles occurred more commonly in shorter fragments of cell-free DNA.
In A-C, histograms of overall cell-free DNA fragment length from the entire 16-gene capture panel determined by sequencing compared between five healthy controls (blue lines) and individual tumor patients (red line). Plasma concentration of cell-free DNA and presence (+) /absence (-) of EGFR and KRAS amplifications are also described for each tumor patient. There was a strong left shift (i.e., shorter fragment lengths) and periodicity in LC5 compared to controls (A). In B, there was a subtle shift towards shorter fragment length that was most apparent at longer lengths (black arrow) where fewer inserts from the tumor patient (LC1) were present compared to the healthy controls. In C, no difference between the tumor patient (LC10) and the healthy controls was observed. In D, the length of fragments containing the WT or mutant EGFR allele is shown for healthy controls (blue dots) and tumor patients with the mutant L858R allele (orange dots). The solid bars indicate the mean fragment length for each sample. In E, a histogram of the fragment lengths of the mutant L858R allele from LC5 (orange line) vs. the WT allele in healthy controls (blue lines) demonstrates a higher prevalence of mutant allele at shorter fragment lengths. The black dashed-line identifies the fragment length that corresponds to the most inserts in the tumor patient. Note that the mutant allele more commonly occurs at shorter fragment lengths while the WT allele in healthy controls occurs more commonly at longer fragment lengths. In F, the fragment length associated with EGFR for the WT allele in the healthy controls (blue dots) and tumor patients with the mutant T790M allele (red dots) is displayed. The solid bars correspond to mean fragment length for each sample. In G, a histogram of the fragment length of the mutant allele (L858R) from LC9 (red line) vs. the WT allele in healthy controls (blue lines) is shown. The black dashed-line identifies the fragment length that corresponds to the most inserts in the tumor patient. Note that the WT allele in healthy controls more commonly occurs at longer fragment lengths. In H, the EGFR fragment length associated with the WT allele (pink dots) and the mutant T790M allele (MA; red dots) in each of the tumor patients are depicted. The mutant allele more commonly occurred at a shorter fragment length compared to the length of the WT allele within the same patient.
Fig 5
Fig 5. Extraction of cell-free DNA fractions for evaluating mutant allele frequency within specific fragment lengths.
In A, an image of an 8% polyacrylamide gel loaded with a truncated library prepared from the cell-free DNA of a lung cancer patient (LC10, middle column). On either side is a custom-designed ladder made from phage lambda containing double-stranded DNA of 229, 240, and 262 bp in length. Six adjacent samples were excised from the gel corresponding to the colored boxes. In B, densitometry of the full-length libraries made from each fraction and the original library are shown. Colors of each curve and peak correspond to the colors in A (the library is shown in black). In C, the mutant allele frequency as determined by digital droplet PCR is shown for the library and each fraction. Colors for mutant allele frequency (%) correspond to the colors in A and B. Note that the purple fraction (peak fragment length of 320 bp) represented the largest increase (9.1-fold) in mutant allele frequency compared to the library (peak fragment length of 348 bp). Fractions containing longer fragment lengths than the library (e.g., blue fraction: peak fragment lengths of 361 bp) demonstrated a reduction in mutant allele frequency.
Fig 6
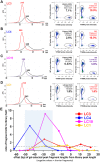
Fig 6. Selection of shorter cell-free DNA fragments enriched for ctDNA.
In A-D, cell-free DNA fragment size distribution by densitometry and the corresponding digital droplet PCR results for mutant allele frequency are shown for each tumor patient. In A-C, the first column identifies the fragment size distribution for the fraction associated with the largest increase in mutant allele frequency (red or purple curve) along with the distribution of the corresponding library (black curve). In D, the first column shows a similar fraction for LC1 as presented in A-C. In A-D, the color of each curve matches the gel location as depicted in S8 Fig. In A-D, the middle and last columns report the digital droplet PCR results for mutant allele frequency (%) in the library and the gel fraction, respectively. In E, the ratio of the mutant allele frequency in each fraction to the MAF in the library was plotted for each tumor patient. The dashed gray line represents a ratio of 1 (i.e., no increase or decrease in MAF). To account for variability during gel fraction excision between samples, the x-axis location for plotting values associated with each gel fraction was determined via densitometry by subtracting the peak fragment length for each library from the peak fragment length for each fraction. Negative values correspond to shorter fragments and positive values correspond to longer fragments. The blue shaded box identifies the region where increase in the mutant allele frequency was the greatest across all samples.

Similar articles

Cited by

References

    1. Schwarzenbach H, Hoon DS, Pantel K. Cell-free nucleic acids as biomarkers in cancer patients. Nature reviews. 2011;11(6):426–37. Epub 2011/05/13. 10.1038/nrc3066 nrc3066 [pii]. 21562580. - DOI - PubMed
    1. Dawson SJ, Tsui DW, Murtaza M, Biggs H, Rueda OM, Chin SF, et al. Analysis of circulating tumor DNA to monitor metastatic breast cancer. N Engl J Med. 2013;368(13):1199–209. Epub 2013/03/15. 10.1056/NEJMoa1213261 . - DOI - PubMed
    1. Forshew T, Murtaza M, Parkinson C, Gale D, Tsui DW, Kaper F, et al. Noninvasive identification and monitoring of cancer mutations by targeted deep sequencing of plasma DNA. Sci Transl Med. 2012;4(136):136ra68 Epub 2012/06/01. 10.1126/scitranslmed.3003726 4/136/136ra68 [pii]. . - DOI - PubMed
    1. Frattini M, Gallino G, Signoroni S, Balestra D, Battaglia L, Sozzi G, et al. Quantitative analysis of plasma DNA in colorectal cancer patients: a novel prognostic tool. Ann N Y Acad Sci. 2006;1075:185–90. Epub 2006/11/17. 1075/1/185 [pii] 10.1196/annals.1368.025 . - DOI - PubMed
    1. Catarino R, Ferreira MM, Rodrigues H, Coelho A, Nogal A, Sousa A, et al. Quantification of free circulating tumor DNA as a diagnostic marker for breast cancer. DNA Cell Biol. 2008;27(8):415–21. Epub 2008/08/13. 10.1089/dna.2008.0744 . - DOI - PubMed

Publication types

MeSH terms