. 2016 Sep 2;291(36):19079-91.
doi: 10.1074/jbc.M116.737585. Epub 2016 Jul 15.

Opposing Functions of the N-terminal Acetyltransferases Naa50 and NatA in Sister-chromatid Cohesion

Affiliations

Opposing Functions of the N-terminal Acetyltransferases Naa50 and NatA in Sister-chromatid Cohesion

Ziye Rong et al. J Biol Chem. .

Abstract

During the cell cycle, sister-chromatid cohesion tethers sister chromatids together from S phase to the metaphase-anaphase transition and ensures accurate segregation of chromatids into daughter cells. N-terminal acetylation is one of the most prevalent protein covalent modifications in eukaryotes and is mediated by a family of N-terminal acetyltransferases (NAT). Naa50 (also called San) has previously been shown to play a role in sister-chromatid cohesion in metazoans. The mechanism by which Naa50 contributes to cohesion is not understood however. Here, we show that depletion of Naa50 in HeLa cells weakens the interaction between cohesin and its positive regulator sororin and causes cohesion defects in S phase, consistent with a role of Naa50 in cohesion establishment. Strikingly, co-depletion of NatA, a heterodimeric NAT complex that physically interacts with Naa50, rescues the sister-chromatid cohesion defects and the resulting mitotic arrest caused by Naa50 depletion, indicating that NatA and Naa50 play antagonistic roles in cohesion. Purified recombinant NatA and Naa50 do not affect each other's NAT activity in vitro Because NatA and Naa50 exhibit distinct substrate specificity, we propose that they modify different effectors and regulate sister-chromatid cohesion in opposing ways.

Keywords: N-terminal acetylation; acetyltransferase; cell cycle; chromosomes; cohesin; enzyme; mitosis; sister-chromatid cohesion.


Figures

FIGURE 1.
FIGURE 1.
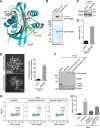
Naa50 has both catalytic and non-catalytic roles in sister-chromatid cohesion. A, ribbon diagram of the structure of human Naa50 with the bound CoA and the MGLP peptide substrate shown in sticks. Two residues close to the active site, Phe-27 and Tyr-124, are also shown in sticks. B, auto-acetylation of GST-Naa50 wild type (WT) and F27A in the presence of [14C]acetyl-CoA. The reaction mixtures were separated on SDS-PAGE, stained with GelCode blue (bottom panel), and subjected to autoradiography with phosphorimaging (top panel). Representative image of more than three independent experiments is shown. C, immunoblots of lysates of 293FT cells transfected with the indicated siRNAs. Tubulin was blotted as the loading control. Representative image of two independent experiments is shown. D, quantification of the mitotic indices (defined as the percentage of MPM2-positive 4N cells) of cells in C. Results are the mean ± range, n = 2 independent experiments. E, representative metaphase spread images of 293FT cells transfected with the indicated siRNAs and treated with nocodazole for 3 h. Metaphase spreads with mostly paired chromatids (top) or with separated chromatids (bottom) are shown. The percentages of metaphase spreads with mostly separated chromatids are quantified and shown on the right. Results are the mean ± range, n = 2 independent experiments. F, immunoblots of lysates of HeLa Tet-On cells transfected with the indicated siRNA and plasmids. Tubulin was blotted as the loading control. The positions of the endogenous Naa50 and Myc-Naa50 proteins are labeled. Representative images of four independent experiments are shown. G, representative FACS graphs of cells in F. Mitotic cells (MPM2-positive 4N cells) are boxed and quantified. H, quantification of the mitotic indices (defined as the percentage of MPM2-positive 4N cells) of cells in F. Results are the mean ± range, n = 2 independent experiments.
FIGURE 2.
FIGURE 2.
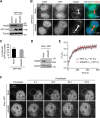
Naa50 is dispensable for cohesin loading and dynamics. A, immunoblots of HeLa Tet-On cells transfected with the indicated siRNA and plasmids. A representative image of three independent experiments is shown. B, immunofluorescence staining of cells in A that had been synchronized at telophase. DAPI, GFP, and tubulin staining was pseudo-colored blue, green, and red, respectively, in the merged images. C, quantification of the percentage of telophase cells with positive GFP-SA2 staining on chromatin. Results are the mean ± range, n = 2 independent experiments with 40 cells counted for each group in each experiment. D, immunoblots of HeLa Tet-On cells stably expressing Smc1-GFP that had been mock-transfected or transfected with siNaa50. A representative image of three independent experiments is shown. E, quantification of relative fluorescent signals during FRAP. Data were collected from 10 cells for each group in three independent experiments. Error bars, S.E. The t½ values are listed below. F, representative Smc1-GFP images of cells in D before and at different times after photobleaching. The bleached areas are marked by dashed circles.
FIGURE 3.
FIGURE 3.
Naa50 promotes the establishment of sister-chromatid cohesion through antagonizing Wapl. A, representative images of mock or siNaa50 transfected HeLa Tet-On cells synchronized at S phase and stained with DAPI and FISH probes. The boxed regions are magnified in the inset. B, quantification of distances between paired FISH signals of cells in A. Mean ± S.D. is shown. Data were collected in two independent experiments. p value was calculated with Student's t test. C, immunoblots of lysates of HeLa Tet-On cells transfected with the indicated siRNAs. Tubulin was blotted as the loading control. A representative image of eight independent experiments is shown. D, representative metaphase spread images of HeLa Tet-On cells transfected with the indicated siRNAs and treated with nocodazole for 3 h. Metaphase spreads with mostly paired chromatids (top) or with separated chromatids (bottom) are shown. The percentages of metaphase spreads with mostly separated chromatids are quantified and shown on the right. Results are the mean ± range, n = 2 independent experiments. E, quantification of mitotic indices of HeLa Tet-On cells transfected with the indicated siRNAs. Results are the mean ± S.D., n = 3 independent experiments.
FIGURE 4.
FIGURE 4.
Naa50 promotes sororin binding to cohesin without affecting Smc3 acetylation. A, immunoblots of the cytosolic and nuclear fractions of HeLa Tet-On cells transfected with the indicated siRNAs. Representative image of three independent experiments is shown. B, FACS profiles of mock or siNaa50 transfected HeLa Tet-On cells synchronized at late S/G2. The percentages of S/G2 cells are quantified. C, immunoblots of lysates, IgG IP, anti-sororin IP, and anti-Smc1 IP of cells in B. A representative image of >10 independent experiments is shown. D, HeLa Tet-On cells stably expressing Myc-Sgo1 were mock- or siNaa50-transfected and synchronized in mitosis. Mitotic cells were collected by shake-off. The total cell lysates and anti-Myc IP were blotted with the indicated antibodies. A representative image of five independent experiments is shown.
FIGURE 5.
FIGURE 5.
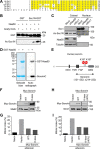
Scc1 and sororin are not functionally relevant substrates of Naa50 in cohesion. A, sequence alignment of the N-terminal region of Scc1 proteins from different species. Hs, Homo sapiens; Xl, Xenopus laevis; Dm, Drosophila melanogaster; Ce, Caenorhabditis elegans; Sp, Schizosaccharomyces pombe; Sc, Sacchromyces cerevisiae. B, immunoblots of recombinant GST or Scc1N-GST proteins that had been incubated in the presence or absence of Naa50 or acetyl-CoA. Representative image of two independent experiments is shown. C, immunoblots of cytosolic and nuclear fractions of HeLa Tet-On cells transfected with the indicated siRNAs. Representative image of two independent experiments is shown. D, recombinant purified sororinC protein (residues 131–252 with the basic region 214–222 deleted) was incubated with [14C]acetyl-CoA in the presence or absence of GST-Naa50. The reaction mixtures were separated on SDS-PAGE, stained with GelCode blue (right panel) and subjected to autoradiography with phosphorimaging (left panel). E, schematic drawing of human sororin with its domains and motifs shown. The boundary of sororinC is indicated. The two acetylated lysines are also labeled. F and H, immunoblots of lysates HeLa Tet-On cells depleted of sororin and transiently transfected with Myc-sororin wild type (WT) or the lysine-less (K-less) mutant. Mad2 and Smc1 were used as loading controls. G and I, quantification of the mitotic indices of cells in F and H, respectively, by FACS.
FIGURE 6.
FIGURE 6.
Naa50 opposes NatA in sister-chromatid cohesion. A, immunoblots of HeLa Tet-On cells transfected with the indicated siRNAs. A representative image of >10 independent experiments is shown. B, quantification of mitotic indices of cells in A as determined by FACS. Results are the mean ± range, n = 2 independent experiments. C, quantification of mitotic indices of HeLa Tet-On cells transfected with the indicated siRNAs by FACS. Results are the mean ± range, n = 2 independent experiments. D, representative metaphase spread images of HeLa Tet-On cells transfected with the indicated siRNAs and treated with nocodazole for 3 h. Metaphase spreads with mostly paired chromatids (top) or with separated chromatids (bottom) are shown. The percentages of metaphase spreads with mostly separated chromatids are quantified and shown on the right. Results are the mean ± range, n = 2 independent experiments.
FIGURE 7.
FIGURE 7.
Naa50 and NatA do not mutually regulate the activities of each other. A, Coomassie stained gel of recombinant purified Naa50, NatA (the Naa10-Naa15 complex), and the Naa50-NatA complex. B, acetyltransferase activities of enzymes in A using the MLGP or SAGE peptides as substrates. Results are the mean ± S.D. of the reactions in triplicate. C, quantification of mitotic indices of HeLa Tet-On cells transfected with the indicated siRNAs by FACS. Results are the mean ± range, n = 2 independent experiments. D, model for the opposing roles of Naa50 and NatA in sister-chromatid cohesion. In this model Naa50 and NatA acetylate different sets of substrates. NatA-mediated acetylation weakens cohesion through modulating the cohesin-sororin interaction. Naa50-dependent acetylation counteracts this effect of NatA. Naa50 might also directly inhibit NatA during translation in vivo.

Similar articles

Cited by

References

    1. Nasmyth K. (2002) Segregating sister genomes: the molecular biology of chromosome separation. Science 297, 559–565 - PubMed
    1. Holland A. J., and Cleveland D. W. (2009) Boveri revisited: chromosomal instability, aneuploidy, and tumorigenesis. Nat. Rev. Mol. Cell Biol. 10, 478–487 - PMC - PubMed
    1. Schvartzman J. M., Sotillo R., and Benezra R. (2010) Mitotic chromosomal instability and cancer: mouse modelling of the human disease. Nat. Rev. Cancer 10, 102–115 - PMC - PubMed
    1. Holland A. J., and Cleveland D. W. (2012) Losing balance: the origin and impact of aneuploidy in cancer. EMBO Rep. 13, 501–514 - PMC - PubMed
    1. Onn I., Heidinger-Pauli J. M., Guacci V., Unal E., and Koshland D. E. (2008) Sister chromatid cohesion: a simple concept with a complex reality. Annu. Rev. Cell Dev. Biol. 24, 105–129 - PubMed

MeSH terms

Substances