. 2016 Jul 13:5:e18124.
doi: 10.7554/eLife.18124.

Talin-KANK1 interaction controls the recruitment of cortical microtubule stabilizing complexes to focal adhesions

Affiliations

Talin-KANK1 interaction controls the recruitment of cortical microtubule stabilizing complexes to focal adhesions

Benjamin P Bouchet et al. Elife. .

Abstract

The cross-talk between dynamic microtubules and integrin-based adhesions to the extracellular matrix plays a crucial role in cell polarity and migration. Microtubules regulate the turnover of adhesion sites, and, in turn, focal adhesions promote the cortical microtubule capture and stabilization in their vicinity, but the underlying mechanism is unknown. Here, we show that cortical microtubule stabilization sites containing CLASPs, KIF21A, LL5β and liprins are recruited to focal adhesions by the adaptor protein KANK1, which directly interacts with the major adhesion component, talin. Structural studies showed that the conserved KN domain in KANK1 binds to the talin rod domain R7. Perturbation of this interaction, including a single point mutation in talin, which disrupts KANK1 binding but not the talin function in adhesion, abrogates the association of microtubule-stabilizing complexes with focal adhesions. We propose that the talin-KANK1 interaction links the two macromolecular assemblies that control cortical attachment of actin fibers and microtubules.

Keywords: biophysics; cell biology; focal adhesion; human; microtubule; structural biology; talin; KANK.


Conflict of interest statement

AA: Reviewing editor, eLife. The other authors declare that no competing interests exist.

Figures
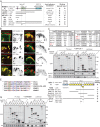
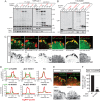
Figure 1.
Figure 1.. The KN motif of KANK1 interacts with the R7 domain of talin1.
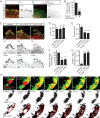
(A) Schematic representation of KANK1 and the deletion mutants used in this study, and the summary of their interactions and localization. N.d., not determined in this study. (B) TIRFM images of live HeLa cells transiently expressing the indicated GFP-tagged KANK1 deletion mutants together with the focal adhesion marker mCherry-paxillin. In these experiments, endogenous KANK1 and KANK2 were also expressed. (C) Identification of the binding partners of Bio-GFP-tagged KANK1 and its indicated deletion mutants by using streptavidin pull down assays from HEK293T cells combined with mass spectrometry. (D) Streptavidin pull down assays with the BioGFP-tagged KANK1 or the indicated KANK1 mutants, co-expressed with GFP-talin1 in HEK293T cells, analyzed by Western blotting with the indicated antibodies. (E) Sequence alignment of KANK1 and KANK2 with the known talin-binding sites of DLC1, RIAM and Paxillin. The LD-motif and the interacting hydrophobic residues are highlighted green and blue respectively. (F) Schematic representation of talin1 and the deletion mutants used in this study, and their interaction with KANK1. (G) Streptavidin pull down assays with the BioGFP-tagged talin1 or the indicated talin1 mutants, co-expressed with HA-KANK1 in HEK293T cells, analyzed by Western blotting with the indicated antibodies. DOI: http://dx.doi.org/10.7554/eLife.18124.003
Figure 1—figure supplement 1.
Figure 1—figure supplement 1.. KANK1 colocalizes with CMSC components around FAs.
(A) Widefield fluorescence images of HeLa cells stained for endogenous proteins as indicated. In the two bottom panels, cells were transfected with GFP-KANK1. pY, phospho-tyrosine, a FA marker. (B) Widefield fluorescence images of HaCaT cells stained for endogenous proteins as indicated. DOI: http://dx.doi.org/10.7554/eLife.18124.004
Figure 1—figure supplement 2.
Figure 1—figure supplement 2.. Role of myosin II activity in KANK1 localization to FA.
(A) Widefield fluorescence images of serum-starved HeLa cells stimulated with fetal calf serum with or without blebbistatin and stained as indicated. (B) Quantification of peripheral clustering of LL5β in cells treated as in panel (A) (n=25–30, 6 cells per condition). (C) Widefield fluorescence images of HeLa treated for 45 min with the ROCK1 inhibitor Y-27632 at indicated concentrations and stained as indicated. (DE) Average FA number (D) and individual area (E) in cells treated as in (C) (373–642 FAs/ condition averaged per cell; n=7). (F) Quantification of peripheral clustering of KANK1 in cells treated as in panel (C) (n=12, 5 cells per condition). (G) Quantification of KANK1 and talin colocalization. Pearson R value, n=30 in 10–12 cells per conditions. (H) Dual fluorescence time-lapse images acquired using TIRFM in HeLa cells stably expressing TagRFP-paxillin and GFP-KANK1 and treated as indicated. Red line, FA rim obtained by using a threshold-based mask. In all plots: error bar, SEM; ns, non-significant, ***p<0.001, Mann- Whitney U test. DOI: http://dx.doi.org/10.7554/eLife.18124.005
Figure 1—figure supplement 3.
Figure 1—figure supplement 3.. FA localization of KN-bearing proteins.
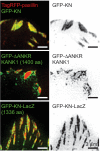
GFP-KN-LacZ fusion localizes to the inner part of FAs. TIRFM images of live HeLa cells transfected with TagRFP-paxillin and GFP-tagged KN peptide, ΔANKR KANK1 mutant or KN-LacZ. DOI: http://dx.doi.org/10.7554/eLife.18124.007
Figure 2.
Figure 2.. Biochemical and structural characterization of the Talin-KANK interaction.
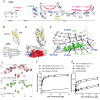
(A) Schematic representation of Talin1, with F-actin, β-integrin and vinculin binding sites highlighted. The KANK1 binding site on R7 is also shown. (B) The structure of the complex between talin1 R7-R8 (white) and the LD-motif of DLC1 (yellow) bound on the R8 subdomain (PDB ID. 5FZT, [Zacharchenko et al., 2016]). Residues W1630 and Y1389 (blue) and S1641 (magenta) are highlighted. (CD) The KANK KN domain binds to a novel site on talin R7. 1H,15N HSQC spectra of 150 μM 15N-labelled talin1 R7 (residues 1357–1659 Δ1454–1586) in the absence (black) or presence of KANK1(30–68)C peptide (red) (top panel) or KANK1-4A (green) (bottom panel) at a ratio of 1:3. (D) Mapping of the KANK1 binding site on R7 as detected by NMR using weighted chemical shift differences (red) – mapped onto the R7-R8 structure in (B). Residues W1630 and Y1389 (blue) and G1404 and S1641 (magenta) are highlighted. (E) Structural model of the talin1:KANK1 interface. Ribbon representation of the KANK1 binding site, comprised of the hydrophobic groove between helices 29 and 36 of R7. Two bulky conserved residues, W1630 and Y1389 (blue) hold these two helices apart forming the binding interface. A small glycine side chain (G1404) creates a pocket between the helices. S1641 (magenta) has been shown previously to be a phosphorylation site (Ratnikov et al., 2005). The KN peptide (green) docked onto the KANK binding surface. (FG) Biochemical characterization of the talin:KANK interaction. (F) Binding of BODIPY-labeled KANK1(30–60)C, KANK2(31–61)C and KANK1-4A peptides to Talin1 R7-R8 (1357–1659) was measured using a Fluorescence Polarization assay. (G) Binding of BODIPY-labeled KANK1(30–60)C to wild type R7-R8, R7-R8 S1641E, R7-R8 G1404L and R7-R8 W1630A. Dissociation constants ± SE (μM) for the interactions are indicated in the legend. All measurements were performed in triplicate. ND, not determined. DOI: http://dx.doi.org/10.7554/eLife.18124.009
Figure 2—figure supplement 1.
Figure 2—figure supplement 1.. NMR validation of the Talin1 R7-R8 mutants.
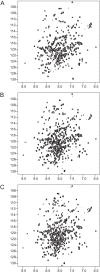
1H,15N HSQC spectra of; (A) Talin1 R7-R8 domain, (B) G1404L Talin1 R7-R8 mutant, and (C) W1630A Talin1 R7-R8 Mutant. The mutant spectra show good peak distribution with uniform intensity similar to the wildtype suggesting that they are correctly folded. DOI: http://dx.doi.org/10.7554/eLife.18124.010
Figure 2—figure supplement 2.
Figure 2—figure supplement 2.. Biochemical characterization of the Talin2:KANK interaction.
Binding of BODIPY-labeled KANK1(30–60)C, KANK2(31–61)C and KANK1-4A peptides to Talin2 R7-R8 measured using a Fluorescence Polarization assay. Dissociation constants ± SE (μM) for the interactions are indicated in the legend. ND, not determined. DOI: http://dx.doi.org/10.7554/eLife.18124.011
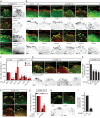
Figure 3.
Figure 3.. KANK1-talin interaction is required for recruiting KANK1 to FAs.
(A) Streptavidin pull-down assays with the BioGFP-tagged KANK1 or the indicated KANK1 mutants, co-expressed with GFP-talin1 in HEK293T cells, analyzed by Western blotting with the indicated antibodies. (B) Streptavidin pull down assays with the BioGFP-tagged talin1 or the indicated talin1 mutants, co-expressed with HA-KANK1 in HEK293T cells, analyzed by Western blotting with the indicated antibodies. (C) TIRFM images of live HeLa cells depleted of KANK1 and KANK2 and co-expressing the indicated siRNA-resistant GFP-KANK1 fusions and TagRFP-paxillin. (D) Fluorescence profile of GFP-tagged mutants and TagRFP-paxillin based on line scan measurement across the FA area in TIRFM images as in panel (C). (E) Widefield fluorescence images of HeLa cells depleted of endogenous talin1 and talin2, rescued by the expression of the wild type GFP-tagged mouse talin1 or its G1404L mutant and labeled for endogenous KANK1 by immunofluorescence staining. (F) Quantification of peripheral clustering of KANK1 in cells treated and analyzed as in (E) (n=12, 6 cells per condition). Error bar, SEM; ***p<0.001, Mann-Whitney U test. DOI: http://dx.doi.org/10.7554/eLife.18124.012
Figure 3—figure supplement 1.
Figure 3—figure supplement 1.. Validation of KANK1/2 and talin1/2 knockdown and effect of disrupted KANK/talin 1 binding in cell spreading and FA formation in HeLa cells.
(AB) Western blot analysis of KANK1/KANK2 (A), and talin1/talin2 (B) co-depletion by independent siRNAs (KANK1#1, K1 #1, KANK1#2, K1 #2 and KANK2#1, K2 #1; talin1 #2, t1 #2 and talin2#1, t2 #1) compared to control siRNA (CT). Ku80, loading control. (C) HeLa cells co-depleted of talin1 and talin2 were transfected with the indicated talin1 fusions and stained for the endogenous KANK1. (D) Fluorescent F-actin staining in cells treated as in (C). (EG) Cell area (E), FA count (F) and FA area (G) in cells treated as in (C) (n=12 cells, 577–664 FAs analyzed). In all plots: error bar, SEM; ns, non-significant, *p<0.05, Mann- Whitney U test. DOI: http://dx.doi.org/10.7554/eLife.18124.014
Figure 4.
Figure 4.. KANK1-talin interaction is required for recruiting CMSCs to FAs.
(A) Widefield fluorescence images of HeLa cells depleted of KANK1 and KANK2 and expressing the indicated siRNA-resistant GFP-KANK1 fusions (rescue), stained for the FA marker phospho-tyrosine (pY). (B) Widefield fluorescence images of HeLa cells transfected with the control siRNA or siRNAs against KANK1 and KANK2, expressing GFP alone or the indicated siRNA-resistant GFP-KANK1 fusions and stained for LL5β or KIF21A. (C) Quantification of peripheral clustering of LL5β and KIF21A in cells treated as in panel (B) (n=12, 5–6 cells per condition). (D) TIRFM images of live HeLa cells depleted of KANK1 and KANK2 and co-expressing the indicated siRNA-resistant GFP-KANK1 fusions and mCherry-CLASP2. (E) Quantification of peripheral clustering of mCherry-CLASP2 in cells treated as in panel (D) (n=20, 8 cells per condition). (F) Widefield fluorescence images of HeLa cells transfected with the indicated GFP-KANK1 fusions and stained for endogenous LL5β. (G) Quantification of peripheral clustering of LL5β in cells treated as in panel (F) (n=12, 6 cells per condition). (H) Widefield fluorescence images of HeLa cells transfected with GFP-tagged KANK1 or its CC1 mutant and stained for LL5β. (I) Quantification of peripheral clustering of LL5β cells treated as in panel (H) (n=12, 6 cells per condition). Error bars, SEM; ns, non-significant; **p<0.005; ***p<0.001, Mann-Whitney U test. DOI: http://dx.doi.org/10.7554/eLife.18124.016
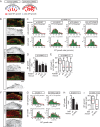
Figure 5.
Figure 5.. The role of talin-KANK1 interaction in regulating microtubule plus end dynamics around FAs.
(A) Schematic representation of the pattern of microtubule growth in control HeLa cells and in cells with perturbed CMSCs, based on (van der Vaart et al., 2013). (B) TIRFM images of live HeLa cells depleted of KANK1 and KANK2 and co-expressing the indicated siRNA-resistant GFP-KANK1 fusions and EB3-mRFP. Images are maximum intensity projection of 241 images from time lapse recording of both fluorescence channels. (C) Distributions of microtubule growth rates at the 3 µm broad cell area adjacent to the cell edge, and in the central area of the ventral cortex for the cells treated as described in (B) (n=87–153, 7–8 cells). (D) Ratio of microtubule growth rate in the cell center and at the cell edge for the cells treated as described in B (n=7–8 cells). (E) Angles of microtubule growth relative to the cell margin for the cells treated as described in B. Box plots indicate the 25th percentile (bottom boundary), median (middle line), mean (red dots), 75th percentile (top boundary), nearest observations within 1.5 times the interquartile range (whiskers) and outliers (black dots) (n=93–114, 7–8 cells). (F) TIRFM images of live HeLa cells depleted of talin1 and talin 2 and co-expressing the indicated GFP-talin1 fusions and EB3-mRFP. Images are maximum intensity projection of 241 images from time lapse recordings of both fluorescence channels. (G) Distributions of microtubule growth rates at the 3 µm broad cell area adjacent to the cell edge, and in the central area of the ventral cortex for the cells treated as described in F (n=88–154, 7 cells). (H) The ratio of microtubule growth rate in the cell center and at the cell edge for the cells treated as described in panel (F) (n=7 cells). (I) Angles of microtubule growth relative to the cell margin for the cells treated as described in F. Box plots as in (E) (n=155–166, 10 cells). In all plots: error bars, SEM; ns, non-significant; **p<0.01; **p<0.005; ***p<0.001, Mann-Whitney U test. DOI: http://dx.doi.org/10.7554/eLife.18124.018
Figure 6.
Figure 6.. Model of talin-directed assembly of cortical microtubule stabilizing complex.
(A) Three-step CMSC clustering around focal adhesion: 1) KANK1 binds talin rod domain R7 via the KN motif, 2) KANK1 initiates a cortical platform assembly by binding liprin-β1 via its CC1 domain, 3) completion of CMSC assembly by further clustering of liprins, ELKS, LL5β, CLASP and KIF21A around FA. (B) KANK1 binding to nascent talin clusters acts as a 'seed' for macromolecular complex assembly and organization around a FA. DOI: http://dx.doi.org/10.7554/eLife.18124.020

Comment in

  • Bridging the gap.
    Armitage SK, Plotnikov SV. Armitage SK, et al. Elife. 2016 Aug 23;5:e19733. doi: 10.7554/eLife.19733. Elife. 2016. PMID: 27552250 Free PMC article.

Similar articles

Cited by

References

    1. Akhmanova A, Stehbens SJ, Yap AS. Touch, grasp, deliver and control: functional cross-talk between microtubules and cell adhesions. Traffic. 2009;10:268–274. doi: 10.1111/j.1600-0854.2008.00869.x. - DOI - PubMed
    1. Alam T, Alazmi M, Gao X, Arold ST. How to find a leucine in a haystack? Structure, ligand recognition and regulation of leucine-aspartic acid (LD) motifs. Biochemical Journal. 2014;460:317–329. doi: 10.1042/BJ20140298. - DOI - PubMed
    1. Anthis NJ, Wegener KL, Ye F, Kim C, Goult BT, Lowe ED, Vakonakis I, Bate N, Critchley DR, Ginsberg MH, Campbell ID. The structure of an integrin/talin complex reveals the basis of inside-out signal transduction. The EMBO Journal. 2009;28:3623–3632. doi: 10.1038/emboj.2009.287. - DOI - PMC - PubMed
    1. Astro V, Chiaretti S, Magistrati E, Fivaz M, de Curtis I. Liprin-α1, ERC1 and LL5 define polarized and dynamic structures that are implicated in cell migration. Journal of Cell Science. 2014;127:3862–3876. doi: 10.1242/jcs.155663. - DOI - PubMed
    1. Astro V, de Curtis I. Plasma membrane-associated platforms: dynamic scaffolds that organize membrane-associated events. Science Signaling. 2015;8:e18124. doi: 10.1126/scisignal.aaa3312. - DOI - PubMed