. 2016 Jul 21;535(7612):367-75.
doi: 10.1038/nature18637. Epub 2016 Jul 13.

A comprehensive transcriptional map of primate brain development

Trygve E Bakken  1 Jeremy A Miller  1 Song-Lin Ding  1 Susan M Sunkin  1 Kimberly A Smith  1 Lydia Ng  1 Aaron Szafer  1 Rachel A Dalley  1 Joshua J Royall  1 Tracy Lemon  1 Sheila Shapouri  1 Kaylynn Aiona  1 James Arnold  1 Jeffrey L Bennett  2 Darren Bertagnolli  1 Kristopher Bickley  1 Andrew Boe  1 Krissy Brouner  1 Stephanie Butler  1 Emi Byrnes  1 Shiella Caldejon  1 Anita Carey  1 Shelby Cate  1 Mike Chapin  1 Jefferey Chen  1 Nick Dee  1 Tsega Desta  1 Tim A Dolbeare  1 Nadia Dotson  1 Amanda Ebbert  1 Erich Fulfs  1 Garrett Gee  1 Terri L Gilbert  1 Jeff Goldy  1 Lindsey Gourley  1 Ben Gregor  1 Guangyu Gu  1 Jon Hall  1 Zeb Haradon  1 David R Haynor  3 Nika Hejazinia  1 Anna Hoerder-Suabedissen  4 Robert Howard  1 Jay Jochim  1 Marty Kinnunen  1 Ali Kriedberg  1 Chihchau L Kuan  1 Christopher Lau  1 Chang-Kyu Lee  1 Felix Lee  1 Lon Luong  1 Naveed Mastan  1 Ryan May  1 Jose Melchor  1 Nerick Mosqueda  1 Erika Mott  1 Kiet Ngo  1 Julie Nyhus  1 Aaron Oldre  1 Eric Olson  1 Jody Parente  1 Patrick D Parker  1 Sheana Parry  1 Julie Pendergraft  1 Lydia Potekhina  1 Melissa Reding  1 Zackery L Riley  1 Tyson Roberts  1 Brandon Rogers  1 Kate Roll  1 David Rosen  1 David Sandman  1 Melaine Sarreal  1 Nadiya Shapovalova  1 Shu Shi  1 Nathan Sjoquist  1 Andy J Sodt  1 Robbie Townsend  1 Lissette Velasquez  1 Udi Wagley  1 Wayne B Wakeman  1 Cassandra White  1 Crissa Bennett  1 Jennifer Wu  1 Rob Young  1 Brian L Youngstrom  1 Paul Wohnoutka  1 Richard A Gibbs  5 Jeffrey Rogers  5 John G Hohmann  1 Michael J Hawrylycz  1 Robert F Hevner  6 Zoltán Molnár  4 John W Phillips  1 Chinh Dang  1 Allan R Jones  1 David G Amaral  2 Amy Bernard  1 Ed S Lein  1
Affiliations

A comprehensive transcriptional map of primate brain development

Trygve E Bakken et al. Nature. .

Abstract

The transcriptional underpinnings of brain development remain poorly understood, particularly in humans and closely related non-human primates. We describe a high-resolution transcriptional atlas of rhesus monkey (Macaca mulatta) brain development that combines dense temporal sampling of prenatal and postnatal periods with fine anatomical division of cortical and subcortical regions associated with human neuropsychiatric disease. Gene expression changes more rapidly before birth, both in progenitor cells and maturing neurons. Cortical layers and areas acquire adult-like molecular profiles surprisingly late in postnatal development. Disparate cell populations exhibit distinct developmental timing of gene expression, but also unexpected synchrony of processes underlying neural circuit construction including cell projection and adhesion. Candidate risk genes for neurodevelopmental disorders including primary microcephaly, autism spectrum disorder, intellectual disability, and schizophrenia show disease-specific spatiotemporal enrichment within developing neocortex. Human developmental expression trajectories are more similar to monkey than rodent, although approximately 9% of genes show human-specific regulation with evidence for prolonged maturation or neoteny compared to monkey.


Figures
Extended Data Figure 1
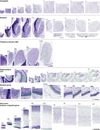
Extended Data Figure 1. Anatomical parcellations of developing cortical and subcortical regions
Nissl stained sections of major brain regions sampled in this resource. Green lines demarcate subregions that were isolated by laser capture microdissection and transcriptionally profiled.
Extended Data Figure 2
Extended Data Figure 2. Canonical cell type marker gene expression across cortical development
Heatmaps of average gene expression in cortical layers at different prenatal (E40 – E120) and postnatal ages (0 – 48 months). Anterior cingulate gyrus (ACG) and primary visual cortex (V1) were sampled at all ages, while primary somatosensory cortex (S1) was sampled in a limited set of layers prenatally. Several additional prefrontal and visual areas were sampled postnatally: orbital gyrus (OG), dorsolateral prefrontal cortex (dlPFC), rectal gyrus (RG) and secondary visual cortex (V2).
Extended Data Figure 3
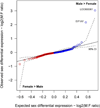
Extended Data Figure 3. Sex differential expression is limited to two Y chromosome genes
a, Quantile-quantile plot of observed versus expected sex differential expression for all 12,441 genes across brain regions during prenatal development. A linear mixed model was fit to all prenatal brain samples with a fixed effect for sex and random effects for brain region, age and donor (see Supplementary Table 11). Genes were ordered by the observed sex effect and plotted versus the expected sex effect based on permutation testing. A 95% confidence interval was calculated (dashed line) based on permutations, and 11 genes in males and no genes in females were more highly expressed than expected by chance. Seven of these 11 genes were nominally significant and included at least two Y-chromosome genes (EIF1AY, LOC720563) and potentially a third gene (LOC693361) whose microarray probe maps to an unannotated region of the Y chromosome.
Extended Data Figure 4
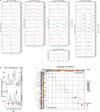
Extended Data Figure 4. Expression rates of change have similar developmental trajectories across all brain regions
a, Rates of expression change in all available brain subregions and ages. b, Boxplots summarizing the number of significantly increasing or decreasing genes between adjacent time points in all subregions. At all ages, the majority of subregions had at least 1000 genes (red line) that were significantly changing. c, Regional specificity of increased autophagy may reflect differential timing of synaptic pruning. Enrichment for autophagy of the most dynamically increasing (upper triangle) and decreasing (lower triangle) genes with samples ordered and labeled as in Fig. 3b. For each gene list, the color corresponds to the proportion of GO terms that are more specific (i.e. “child”) terms subsumed under autophagy (GO:0006914) based on the GO hierarchy and that are significantly enriched (nominal P < 0.05). Note that autophagy was selectively turned on in occipital cortex after infancy and in hippocampus after juvenility (arrows).
Extended Data Figure 5
Extended Data Figure 5. Variable synchrony of biological processes between brain regions
a, Example of variable timing of GO process activity (black boxes) between regions, resulting in different age overlaps (table below). Note that E50 was the earliest age for which we could calculate expression change. AM, amygdala; BG, basal ganglia; HP, hippocampus; NCX, neocortex. b, Average pairwise age overlaps (black, solid line) for all increasing (top) and decreasing (bottom) GO processes were greater than expected by chance (black, dotted line). c, Rank ordered timing of GO processes in Fig. 4c with weighted average rank for each region (asterisks). d, Developmental expression of mature oligodendrocyte markers in four myelin-enriched brain subregions with early increased expression in globus pallidus (arrows) for MOG and ERMN but not MAL and ASPA.
Extended Data Figure 6
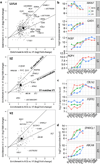
Extended Data Figure 6. Neuro- and glio-genesis in S1 occur at a time course intermediate between V1 and ACG
a, Genes with enriched expression in ACG relative to V1 between E70-E90 also show enriched expression in S1 relative to V1, suggesting that the timing of primary sensory regions is non-uniform in L5/L6 (top), SZ (middle), and VZ (bottom). Each plot shows the average enrichment (log2 fold change) in S1 vs. V1 (y-axes) compared with the average enrichment in ACG vs. V1 (x-axes) between E70-E90 for all genes significantly enriched in ACG in at least two of the three ages between E70-E90 (Fig. 5a). b, Marker genes for cell types (compare with Fig. 5e–h) show expression patterns in S1 which are either consistent with ACG (i.e., GAD1) or intermediate between V1 and ACG (i.e., AQP4). c, Genes with enriched expression for V1 (FGFR3) or ACG (CBLN2) across development show intermediate expression in S1, suggesting that these genes may show cortical gradients rather than specific expression in V1 or ACG. d, Genes with common expression patterning in V1 and ACG can show different patterns in S1, suggesting that rate of neuron and glia development is not the whole story. For example, SPARCL1 and ABCA8 both show increased expression with time in VZ with V1 showing a delay relative to ACG; however, these two genes show different temporal delays in S1.
Extended Data Figure 7
Extended Data Figure 7. Evolutionary conservation of developmental expression
a, Median pairwise correlations of expression trajectories in prefrontal cortex within human (black) and between human and rhesus monkey (red) decrease for less variable genes in rhesus monkey (genes ordered by standard deviation of expression across ages). b, Left: Proportion of genes assigned to different conservation categories is robust to correlation threshold. Right: Developmentally dynamic genes are more highly conserved (genes ordered by same method as in a). For each set of genes, the average ± standard deviation of the proportion of genes in each conservation category was estimated using correlation thresholds ranging from 0 to 0.9. c, Left: Segmented linear fits of expression for example gene with estimated breakpoints in each species (dashed lines). Right: Distribution of breakpoint ages for 179 decreasing genes with good fits to the model in frontal and primary visual cortex. Colors and symbols are consistent in c-d. d, Segmented linear fits with breakpoint estimation of synaptic density for prefrontal and primary visual cortex based on previously published studies (see Methods). e, Breakpoint comparison of 179 increasing genes including 81 synapse related genes (red) between cortical areas within species. Genes that fall on the lines peak at the same age in primary visual and prefrontal cortex. f-g, Comparison of breakpoint timing between human, rhesus monkey and rat in f, prefrontal cortex and g, additional brain regions. Genes that plateau in expression after their breakpoint in human (grey points), and genes that significantly decrease (blue symbols) or increase (red symbols) expression with 95% confidence intervals (grey lines) of breakpoints. Black lines correspond to equal (solid) ± a window (dashed) of developmental ages between species. pcd, post-conceptional days.
Figure 1
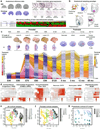
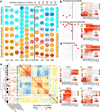
Figure 1. High-resolution transcriptional profiling of rhesus monkey brain development
a, Neuroimaging, histological and transcriptome data components. b, Brain regions analyzed. c, Primary visual cortex (V1) sampling paradigm for transcriptome analysis spanning ages from 40 post-conceptional days (E40) to 48 months after birth, with salient developmental events or stages noted (top row). Whole brain or hemisphere sections are shown for each age (V1, red box), as well as a high magnification Nissl image detailing laminar microdissections. Cortical layers profiled at each stage are color-coded by predominant mitotic (red, pink) or postmitotic (orange, yellow, tan) cell makeup. d, Heatmaps of canonical cell type marker gene expression organized anatomically as in c. e-g, Multi-dimensional scaling (MDS) plots showing the first two principal axes of variation for all cortical samples (n = 922) (e), prenatal samples (n = 542) (f) and postmitotic layers in V1 (n = 175) (g). Scale bars in c: 1 cm (top panels) or 1 mm (bottom panel). Structure abbreviations in Supplementary Table 1.
Figure 2
Figure 2. Transcriptional dynamics across brain regions and ages
a, Similar decreasing rates of gene expression change across cortical layers (rows, ordered from apical to basal) and areas (anterior cingulate gyrus, ACG, red; primary visual cortex, V1, blue). b, Overlap of temporally dynamic genes across brain regions and ages. Proportion of the top 1000 increasing (red, upper triangle) or decreasing (blue, lower triangle) genes for each region between pairs of adjacent ages (e.g. E50 compared to E40) that are shared with other ages and regions. Note large overlap between all regions at each age and within prenatal and postnatal periods. Arrows highlight region-specific rapid expression change. AM, amygdala; BG, basal ganglia; HP, hippocampus; FCx frontal, OCx occipital, PCx parietal and TCx temporal cortex; THAL, thalamus. c, Timing of neuronal connectivity-related events revealed by enrichment of gene ontology (GO) terms in overlapping gene lists from b.
Figure 3
Figure 3. Variable onset of biological processes between brain regions
a, Prolonged duration of biological GO processes. Number of ages at which increasing and decreasing GO processes are active in each region (colors) or in any region (black). b, Synchronous and asynchronous onset of GO processes between regions, mainly beginning in prenatal development. Left: Age of onset for all increasing GO processes ordered by onset in subcortical and then cortical regions (AM, BG, HP, then NCX). Right: GO processes predominantly begin earlier in subcortical than cortical regions. c, Early onset (arrow) of mature oligodendrocyte marker MOBP in subcortical globus pallidus (arrow) compared to cortical myelin-enriched regions. Other myelin genes such as OPALIN show synchronous developmental timing. CA1or, hippocampal CA1 stratum oriens; V1 iz/wm, intermediate zone/white matter; ic, internal capsule.
Figure 4
Figure 4. Protracted maturation of neocortex through young adulthood
a, Expression patterns of genes best marking each cortical layer progressively change with time. Each dot represents the average across-layer expression correlation of the 10% of genes best distinguishing layers at one age (source list) with their expression levels in another age (comparison). Values are plotted against a scaled difference in age. b, Layer-enriched gene expression shows progressive and dramatic change with age. Binary heatmap showing expression of layer-enriched genes (rows) across ages (columns). Genes are ordered and divided based on the median age of laminar expression into four chronological groups: early (median age < E120), middle (E120 – 3M), late (> 3M) and persistent. c, Developmental expression of representative genes from each chronological group in layer 6. d, Number of genes differentially expressed between rostral (ACG) and caudal (V1) cortex in superficial (L2/3), deep (L5/6) and proliferative (SZ, VZ) layers across development. Most differences are found in postmitotic layers during early prenatal and late postnatal development. e-h, Genes marking specific cell classes show regional enrichment consistent with earlier neuro- and gliogenesis in ACG compared to V1. Left column: enrichment of regional genes (from d) with markers for e, cell cycle (progenitors); f, GABAergic and g, glutamatergic neurons in V1; and h, astrocytes. Size of box indicates significance of cell type enrichment in a given layer, region, and age. Right column: expression levels (mean +/− SE) of canonical marker genes for each cell type in V1 (blue) and ACG (red).
Figure 5
Figure 5. Spatiotemporal localization of disease-specific associations in developing cortex
a, WGCNA gene co-expression networks (modules; Supplementary Table 9) based on pooled V1 and ACG samples analyzed independently at each age (columns). Modules were tested for significant gene set enrichment and overlap with hypergeometric tests. Modules significantly enriched for markers of glial cell classes (P < 10−15) or cortical layers (P < 10−30) are color-coded and annotated. Remaining modules are colored or labeled based on maximal expression in postmitotic (neuron-enriched; cyan) layers or progenitor or largely non-neuronal (WM, Layer 1; orange) layers. Modules from adjacent ages with the most highly significant gene overlap (P < 10−50) are connected by grey lines. b-d, Left: Modules significantly enriched for risk genes associated with neurodevelopmental disorders (empirically corrected P < 0.1; red discs). Right: Average expression pattern of genes found in at least two enriched modules. b, Genes related to primary autosomal recessive microcephaly are enriched in early non-neuronal modules, and show maximal expression in early prenatal VZ. c, Genes related to autism spectrum disorder are enriched in modules associated with cortical neurons, and show highest expression in cortical plate across development. d, Genes related to schizophrenia show similar neuronal layer enrichment to autism genes, but restricted to postnatal ages. e, Left: Genes related to intellectual disability are associated with different brain malformations and/or seizures and show four major expression patterns over cortical development. Right: Expression heatmaps of known and candidate disease genes representing developmental profiles of each cluster. ID genes also associated with primary microcephaly are significantly enriched in cortical progenitor-enriched pattern 2 (* P < 0.001; multivariate distance matrix regression permutation test). CC, corpus callosum.
Figure 6
Figure 6. Conserved and human-specific gene expression trajectories in frontal cortex
a, Left: Boxplots of pairwise correlations between developmental expression trajectories (median ± 25th and 75th percentiles, whiskers at 1.5 times the inter-quartile range) of orthologous genes profiled in rhesus monkey, rat and two human data sets. Kruskal-Wallis rank sum test, post-hoc Wilcoxon signed rank paired tests: * P < 0.001 (Bonferroni-corrected), n.s. not significant. Right: Venn diagram showing the number of conserved (R > 0.5) genes between each pair of species. b, Examples of conserved and species-specific gene trajectories. Colors and symbols are consistent in b-d. c, Distribution of breakpoint ages for 179 orthologs (solid lines) of which 81 were synapse related (dashed lines) in frontal cortex and V1. Shaded bars indicate periods of peak synaptic density (95% confidence intervals) in each species (Extended Data Extended Data Fig. 7b). d, Genes with unexpectedly early and late breakpoints in expression trajectories in human. Observed breakpoints (dashed lines) compared to expected breakpoints (dotted lines) based on timing in rhesus monkey. e, Many genes in human cortex have early breakpoints followed by prolonged increase in expression. Left: Comparison of breakpoint timing (points with 95% confidence intervals) between human and rhesus shows a biased population of early breakpoint genes in human cortex but not striatum. Many of these early breakpoint genes continue to increase expression through young adulthood (red) in contrast to genes with relatively conserved timing that tend to plateau (grey) or decrease (blue). Ages corresponding to equivalent (solid lines) or nearby (dashed lines) developmental stages (event scores within ± 0.2; see Methods) in human and rhesus monkey are shown. Right: Bar plot summarizing the number of genes that have an early or late breakpoint in human in different brain regions.

Similar articles

Cited by

References

    1. Workman AD, Charvet CJ, Clancy B, Darlington RB, Finlay BL. Modeling Transformations of Neurodevelopmental Sequences across Mammalian Species. J. Neurosci. 2013;33:7368–7383. - PMC - PubMed
    1. Smart IHM, Dehay C, Giroud P, Berland M, Kennedy H. Unique morphological features of the proliferative zones and postmitotic compartments of the neural epithelium giving rise to striate and extrastriate cortex in the monkey. Cereb. Cortex. 2002;12:37–53. - PMC - PubMed
    1. MacLean EL, et al. The evolution of self-control. Proc. Natl. Acad. Sci. U. S. A. 2014;111:E2140–E2148. - PMC - PubMed
    1. Caldwell CA, Whiten Ain. Primates Perspect. Oxford University Press; 2011. pp. 652–662.
    1. Belmonte JCICI, et al. Brains, Genes, and Primates. Neuron. 2015;86:617–631. - PMC - PubMed

Publication types

MeSH terms