. 2016 Jul 25;213(8):1497-512.
doi: 10.1084/jem.20151912. Epub 2016 Jul 11.

Developmental regulation of myeloerythroid progenitor function by the Lin28b-let-7-Hmga2 axis

Affiliations

Developmental regulation of myeloerythroid progenitor function by the Lin28b-let-7-Hmga2 axis

R Grant Rowe et al. J Exp Med. .

Abstract

For appropriate development, tissue and organ system morphogenesis and maturation must occur in synchrony with the overall developmental requirements of the host. Mistiming of such developmental events often results in disease. The hematopoietic system matures from the fetal state, characterized by robust erythrocytic output that supports prenatal growth in the hypoxic intrauterine environment, to the postnatal state wherein granulocytes predominate to provide innate immunity. Regulation of the developmental timing of these myeloerythroid states is not well understood. In this study, we find that expression of the heterochronic factor Lin28b decreases in common myeloid progenitors during hematopoietic maturation to adulthood in mice. This decrease in Lin28b coincides with accumulation of mature let-7 microRNAs, whose biogenesis is regulated by Lin28 proteins. We find that inhibition of let-7 in the adult hematopoietic system recapitulates fetal erythroid-dominant hematopoiesis. Conversely, deletion of Lin28b or ectopic activation of let-7 microRNAs in the fetal state induces a shift toward adult-like myeloid-dominant output. Furthermore, we identify Hmga2 as an effector of this genetic switch. These studies provide the first detailed analysis of the roles of endogenous Lin28b and let-7 in the timing of hematopoietic states during development.


Figures

Figure 1.
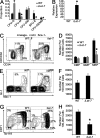
Figure 1.
Myeloerythroid development. (A) Whole WT FL mononuclear cells or BM cells were gated on viable, lineage, c-kit+, and Sca-1 cells, and representative staining patterns for CD16/32 and CD34 are presented. MEPs are defined as lineage, c-kit+, Sca-1, CD16/32, and CD34; GMPs are defined as lineage, c-kit+, Sca-1, CD16/32hi, and CD34+; and CMPs are defined as lineage, c-kit+, Sca-1, CD16/32lo, and CD34+. (B) FL or BM cells were isolated at the indicated time points, and the ratio of MEPs to GMPs is presented. *, P < 0.0001 by Student’s t test, comparing E14.5 FL and P42 BM time points. n = 6 animals for each time point over two experiments. (C) BM or FL cells were stained with the indicated antibodies (including erythroid and lymphoid lineage antibodies), and representative flow cytometry plots are presented. (D) FL or adult BM mononuclear cells were isolated at the indicated developmental time points, and the number of Gr-1+/Mac-1+ cells per 100,000 cells is presented. *, P < 0.001 by Student’s t test for E14.5 FL and P42 BM time points. n = 6 animals over two experiments. (E) FL or BM cells were stained with antibodies against Ter119 and CD71, and representative flow cytometry plots are presented. (F) The number of CD71+/Ter119 cells in FL versus adult BM is presented. *, P < 0.0001 by Student’s t test. n = 6 animals over two experiments. (G) Mononuclear cells were cultured in methylcellulose for 14 d in the presence of growth factors (stem cell factor, IL-3, IL-6, and erythropoietin). Colonies were scored by morphology, and the proportion of each colony type in the cultures is presented. *, P < 0.05 for each colony type by Student’s t test. n = 4 adult BM and 6 E14.5 FL over two experiments. Error bars represent SEM. CFU-M, CFU monocyte; CFU-G, CFU granulocyte; CFU-GM, CFU granulocyte–monocyte.
Figure 2.
Figure 2.
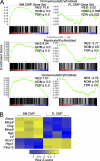
RNAseq analysis of CMPs. (A) FL and adult BM CMPs (n = 3 biological replicates for each condition isolated over at least two separate sorting experiments) were compared by RNAseq to identify significantly different genes between the two populations at a false discovery rate (FDR) cutoff of <0.001. GSEA was performed to compare adult BM CMP- and FL CMP-specific transcripts to normal adult promyelocyte, myelocyte, granulocyte, and erythroblast transcriptomes. In the top row, a significant positive correlation was observed between adult BM CMP-specific transcripts and promyelocyte-enriched transcripts (left), indicating enrichment of adult BM CMP-specific transcripts among transcripts increased in promyelocytes relative to erythroblasts. A significant negative correlation was observed between FL CMP-specific transcripts (right) and transcripts increased in promyelocytes relative to erythroblasts, indicating correlation with erythroblast-specific transcripts. Normalized enrichment score (NES), nominal p-value (NOM p), and FDR are presented. The same analysis was performed in the middle with myelocyte transcripts and at the bottom with granulocyte transcripts. (B) Heat maps showing expression of erythroid/platelet-specific and granulocyte/monocyte-specific transcripts measured by RNAseq are presented.
Figure 3.
Figure 3.
The Lin28let-7 axis during myeloerythropoiesis. (A) FL or adult BM CMPs were isolated by FACS. The level of Lin28b mRNA was measured by qPCR in E14.5 FL or BM CMPs, and the levels were compared with mouse embryonic stem (ES) cells by qPCR. *, P < 0.0001 by Student’s t test. n = 6 replicates for FL and BM each over two experiments. An 8.08-fold expression increase in Lin28b was observed in FL CMPs compared with adult BM CMPs; P = 2.34 × 10⁻¹⁵ by RNAseq. (B) Scatter plot of differentially expressed genes between FL and adult BM CMPs as measured by RNAseq. Predicted let-7 targets with significantly different expression between FL and adult BM CMPs at an FDR of 0.001 are indicated in red. Pertinent transcripts are denoted. n = 3 biological replicates over at least two separate sorting experiments for BM and FL. (C–E) Levels of the indicated mature let-7 microRNA family members (C), Let7bhg (D), or let-7 precursors (E) were measured by qPCR in FACS-sorted FL or adult BM CMPs. The results are presented as fold expression compared with FL, normalized to an expression value of 1. *, P < 0.05. n = 6 embryos/mice sorted from three independent experiments. Error bars represent SEM.
Figure 4.
Figure 4.
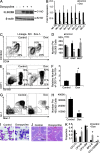
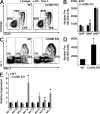
Activation of LIN28B in adult BM. (A) Adult iLIN28B mice were exposed to 1 g/liter doxycycline in drinking water or standard water for 14 d, at which time BM mononuclear cells were isolated, and Western blot analysis for human LIN28B was performed. (B) RNA was isolated from BM CMPs with and without doxycycline (Dox) exposure, and levels of mature let-7 microRNAs were measured by qPCR. For each let-7 form, results are normalized to the control, nondoxycycline-exposed condition. *, P < 0.05 by Student’s t test. n = 4 uninduced and 5 doxycycline-exposed across three experiments. (C) BM mononuclear cells from adult iLIN28B mice with and without 14 d of doxycycline exposure were isolated and immunostained, with representative flow cytometry plots presented. (D) Numbers of myeloid progenitor cells per 100,000 BM mononuclear cells are shown. *, P < 0.01 by Student’s t test. (E) Whole BM cells were analyzed for red blood cell progenitor populations by flow cytometry. Representative plots are shown. (F) Numbers of CD71+/Ter119 cells in doxycycline-exposed iLIN28B animals relative to the control are shown. *, P < 0.02 by Student’s t test. (G) BM mononuclear cells under the indicated conditions were immunostained for Gr-1 and Mac-1. Representative flow cytometry plots are shown. (H) Numbers of Gr-1+/Mac-1+ mature granulocytes per 100,000 BM mononuclear cells under the indicated conditions are presented. *, P < 0.0001 by Student’s t test. (D, F, and H) n = 8 mice for the control condition and 7 mice for the doxycycline-exposed condition across three experiments. (I and J) Morphology of BM cells (I) or splenic tissue (J) from control or doxycycline-treated iLIN28B mice is shown. Images are representative of specimens obtained over at least three independent experiments. (I) Bar, 40 µm. Arrows, neutrophils; arrowheads, erythroblasts. (J) Bar, 200 µm. RP, red pulp; WP, white pulp. Dashed lines indicate borders of these two splenic tissues. (K) BM mononuclear cells from iLIN28B mice exposed to doxycycline for 14 d or unexposed mice were cultured in methylcellulose in the presence of growth factors. After 14 d of culture, colony morphology was scored, and the mean proportions of each colony type are presented. *, P < 0.05 by Student’s t test comparing each colony type. n = 5 control mice and 4 doxycycline-treated mice across three experiments. Error bars represent SEM. CFU-M, CFU monocyte; CFU-G, CFU granulocyte; CFU-GM, CFU granulocyte–monocyte.
Figure 5.
Figure 5.
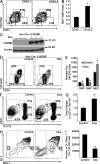
Transplantation of iLIN28B BM into WT recipients and tissue-specific LIN28B induction. (A) Lineage, c-kit+, Sca-1+, CD150+, and CD48 long-term HSCs were purified by FACS from BM of iLIN28B mice (CD45.2) exposed to doxycycline. Long-term HSCs were cotransplanted with CD45.1 BM cells into lethally irradiated CD45.1 recipient mice. Recipient mice continued to receive doxycycline in their drinking water and were sacrificed 16–20 wk after transplantation, and myeloid progenitors in the BM were analyzed within the CD45.1 and CD45.2 fractions. Representative flow cytometry plots are shown. (B) Ratio of MEP to GMP in the CD45.1 and CD45.2 fractions in mixed chimeric recipient mice is presented. *, P < 0.0001 by Student’s t test. n = 10 mice. (C) Triple transgenic mice carrying alleles for iLIN28B, the reverse tetracycline transactivator (rtta) downstream of a loxp-flanked stop codon cassette, and Vav1-cre for hematopoietic-specific excision of the loxp-flanked stop cassette and hematopoietic-specific expression of rtta and transcription of the iLIN28B transgene in the presence of doxycycline. Exposure of triple transgenic mice to doxycycline (Dox) for 14 d resulted in robust LIN28B induction in the adult BM as assessed by Western blotting. (D and E) Myeloid progenitor profiles were assessed after 14 d of doxycycline exposure in triple transgenic mice compared with unexposed mice. *, P < 0.05 by Student’s t test. (F and G) BM cells were stained for erythroid cells, and numbers of CD71+/Ter119 cells were quantified. *, P = 0.02 by Student’s t test. (H and I) BM cells were stained to assess granulocyte maturation, and numbers of Gr-1+/Mac-1+ cells were quantified. *, P = 0.001 by Student’s t test. (D–I) n = 3 mice across two experiments for each condition. Error bars represent SEM.
Figure 6.
Figure 6.
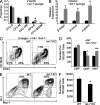
Inhibition of let-7 in adult myeloerythropoiesis. (A) Purified WT adult BM CMPs were retrovirally transduced with an empty vector or a let-7 sponge construct and cultured in methylcellulose for 14 d, when colonies were scored by morphology. Colony distributions are presented. *, P = 0.03 by Student’s t test. n = 5 replicates for vector and sponge constructs across three independent experiments. CFU-M, CFU monocyte; CFU-G, CFU granulocyte; CFU-GM, CFU granulocyte–monocyte. (B) RNA was isolated from cultures after 14 d, and levels of mouse globin genes were measured by qPCR. *, P < 0.01 by Student’s t test. n = 3 replicates across three experiments. (C) Adult mice with the locus encoding let-7b1 and let-7c2–deleted (let-7 KO) or WT C57 littermates were euthanized, BM cells were stained with the indicated antibodies, and myeloid progenitor populations were analyzed by flow cytometry. (D) Numbers of myeloid progenitor cells are presented. *, P = 0.14; **, P = 0.009 by Student’s t test for each comparison. n = 3 WT and let-7 KO mice analyzed; results are representative of two experiments performed (a separate experiment was performed with mice of strain 129 with similar results). (E) BM from the indicated mice was isolated and stained with the indicated antibodies to evaluate granulocyte populations. (F) Numbers of Gr-1+/Mac-1+ mature granulocytes are presented. *, P = 0.09 by Student’s t test. n = 3 for each genotype; the phenotype is verified in an independent strain in an independent experiment. Error bars represent SEM.
Figure 7.
Figure 7.
Induction of let-7 in FL hematopoietic cells. (A) Pregnant females carrying iLet-7 embryos and littermate controls were exposed to doxycycline for 2–4 d before harvesting at E14.5. FL mononuclear cells were cultured in methylcellulose for 14 d in the presence of doxycycline, when colony morphology was scored. Proportions of each colony type are presented. *, P < 0.05 by Student’s t test for each colony type comparison. n = 8 control and 4 iLet-7 embryos across three experiments. CFU-M, CFU monocyte; CFU-G, CFU granulocyte; CFU-GM, CFU granulocyte–monocyte. (B) let-7g induction in the FL at E14.5 after 4-d maternal doxycycline exposure as measured by qPCR. *, P < 0.0001 by Student’s t test. n = 7 WT and 2 iLet-7 embryos from two independent experiments. (C and D) FL cells from the indicated genotypes were stained with the indicated antibodies, and myeloid progenitor populations were analyzed by flow cytometry. Representative histograms are shown. (E and F) FL cells were stained with the indicated antibodies to assess mature granulocyte populations. P = 0.05 by Student’s t test for control and iLet-7 comparison of Gr1+/Mac-1+ cells. (G and H) Whole FL cells were stained with anti-CD71 and anti-Ter119 antibodies to analyze red blood cell progenitor populations by flow cytometry. (C–H) *, P < 0.05 comparing CD71+/Ter119 cells. A total of 10 control and 8 iLet-7 embryos were evaluated, obtained from three independent litters. Error bars represent SEM.
Figure 8.
Figure 8.
Deficiency of Lin28b in the FL. (A) WT or Lin28b KO embryos were isolated at E14.5, and FL cells were stained with the indicated antibodies. (B) The number of myeloid progenitor populations is shown. *, P = 0.007 by Student’s t test. n = 7 WT and 6 Lin28-deficient embryos across three experiments. (C) FL cells of the indicated genotypes were isolated, and granulocyte populations were analyzed by flow cytometry. (D) Numbers of Gr-1+/Mac-1+ granulocytes per 100,000 FL mononuclear cells are shown. *, P = 0.03 by Student’s t test. n = 7 WT and 5 Lin28b-deficient embryos across three experiments. (E) Mature let-7 species were measured in FL CMP cells from E14.5 embryos of the indicated genotypes. *, P < 0.05 by Student’s t test. n = 3 replicates for each genotype from independent litters. Error bars represent SEM.
Figure 9.
Figure 9.
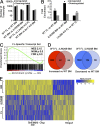
Analysis of mRNA expression by RNAseq. (A) Raw numbers of differentially expressed mRNAs for the CMP comparisons indicated are shown (FDR cutoff for significance is 0.001). (B) Fold enrichment of let-7 target gene frequency in the indicated pools of transcripts compared with the overall frequency of let-7 targets among all analyzed mRNAs is shown. *, P < 0.001; hypergeometric p-values compared with the expected frequency of let-7 targets based on the frequency of targets among all expressed mRNAs. (C) GSEA demonstrating significant positive enrichment of the FL CMP transcriptional program in iLIN28B CMPs. Transcripts enriched in iLIN28B adult BM CMPs compared with adult BM CMPs were compared with the set of transcripts significantly enriched in WT FL CMPs compared with WT adult BM CMPs. NES, normalized enrichment score; NOM p, nominal p-value. (D) Venn diagram analysis showing overlap of transcripts up-regulated in FL CMPs and iLIN28B CMPs compared with WT BM CMPs (left), as well as down-regulated transcripts for these comparisons (right). The p-value for overlap of up-regulated transcripts is <2.2 × 10⁻¹⁶ (expected number of 16.22); the p-value for overlap of down-regulated transcripts is <2.2 × 10⁻¹⁶ (expected number of 39.15). Analysis was performed with Fisher’s exact test. (E) Heat map demonstrating relative expression levels of the transcripts commonly up-regulated or down-regulated in iLIN28B CMPs and WT FL CMPs compared with WT BM CMPs. Pertinent transcripts are denoted.
Figure 10.
Figure 10.
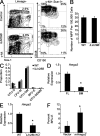
Assessment of LIN28B function in MPPs and investigation of Hmga2 as a Lin28b–let-7 target regulating myeloerythropoiesis. (A) Representative flow cytometry plots showing gating strategy to assess MPP populations in control and iLIN28B mice. (B) Numbers of MPP in the indicated mice are shown. P = 0.82 by Student’s t test. n = 5 mice for each condition across three independent experiments. (C) MPPs were isolated by FACS and cultured in methylcellulose in the presence of myelopoietic cytokines for 10–14 d, when colony morphology was scored. Colony distributions are presented. *, P = 0.04 by Student’s t test. n = 5 mice for each condition across three independent experiments. CFU-M, CFU monocyte; CFU-G, CFU granulocyte; CFU-GM, CFU granulocyte–monocyte. (D and E) Levels of Hmga2 mRNA were measured by qPCR and compared in FL versus adult BM CMPs (D) or Lin28b-deficient compared with littermate control FL CMPs (E). (D) *, P = 0.002 by Student’s t test. n = 3 in each group sorted across two experiments. (E) *, P = 0.007. n = 4 WT and 3 Lin28b-deficient samples from three separate litters. (F) WT adult BM CMPs were transduced with the indicated retroviruses and cultured in methylcellulose in the presence of growth factors for 14 d, when colony morphology was scored. The percentages of BFU-E are indicated. *, P < 0.05 by Student’s t test. n = 3 from three independent experiments. Error bars represent SEM.

Similar articles

Cited by

References

    1. Akashi K., Traver D., Miyamoto T., and Weissman I.L.. 2000. A clonogenic common myeloid progenitor that gives rise to all myeloid lineages. Nature. 404:193–197. 10.1038/35004599 - DOI - PubMed
    1. Ambros V., and Horvitz H.R.. 1984. Heterochronic mutants of the nematode Caenorhabditis elegans. Science. 226:409–416. 10.1126/science.6494891 - DOI - PubMed
    1. Anders S., Pyl P.T., and Huber W.. 2015. HTSeq—a Python framework to work with high-throughput sequencing data. Bioinformatics. 31:166–169. 10.1093/bioinformatics/btu638 - DOI - PMC - PubMed
    1. Bowie M.B., Kent D.G., Dykstra B., McKnight K.D., McCaffrey L., Hoodless P.A., and Eaves C.J.. 2007. Identification of a new intrinsically timed developmental checkpoint that reprograms key hematopoietic stem cell properties. Proc. Natl. Acad. Sci. USA. 104:5878–5882. 10.1073/pnas.0700460104 - DOI - PMC - PubMed
    1. Cavazzana-Calvo M., Payen E., Negre O., Wang G., Hehir K., Fusil F., Down J., Denaro M., Brady T., Westerman K., et al. . 2010. Transfusion independence and HMGA2 activation after gene therapy of human β-thalassaemia. Nature. 467:318–322. 10.1038/nature09328 - DOI - PMC - PubMed

MeSH terms