. 2016 Jul 19;113(29):8236-41.
doi: 10.1073/pnas.1606774113. Epub 2016 Jul 5.

DNA binding triggers tetramerization of the glucocorticoid receptor in live cells

Affiliations

DNA binding triggers tetramerization of the glucocorticoid receptor in live cells

Diego M Presman et al. Proc Natl Acad Sci U S A. .

Abstract

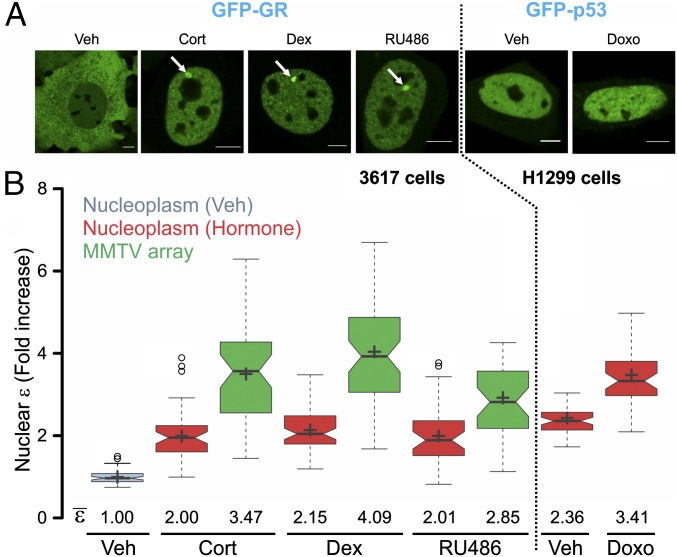
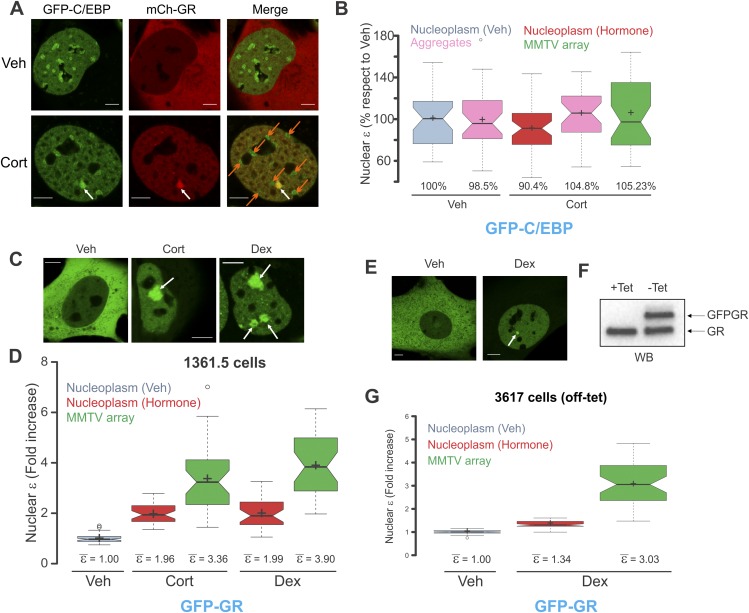
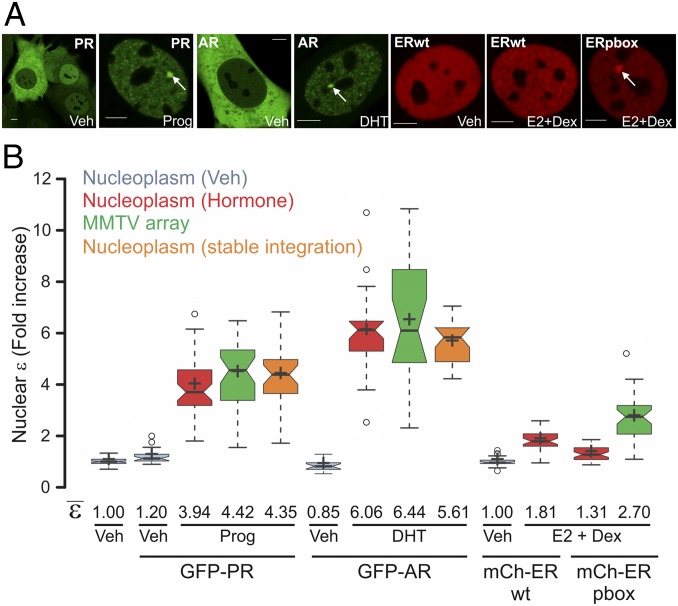
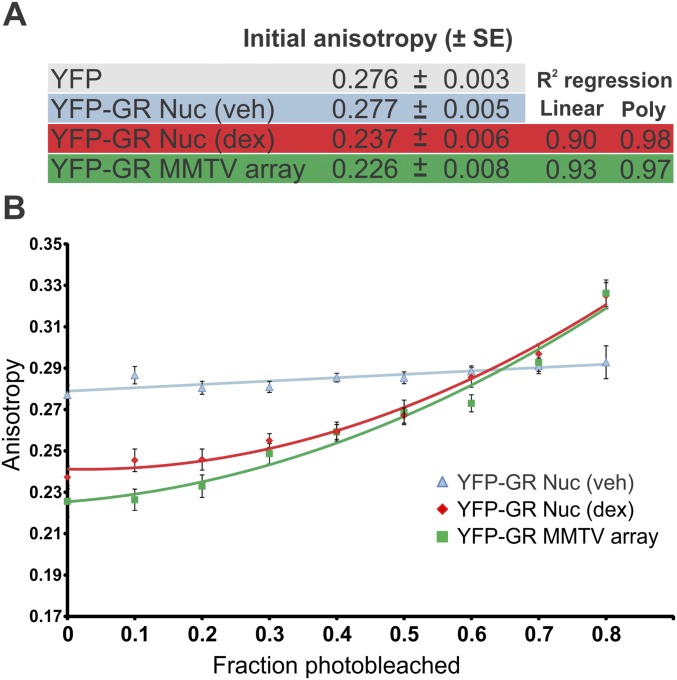
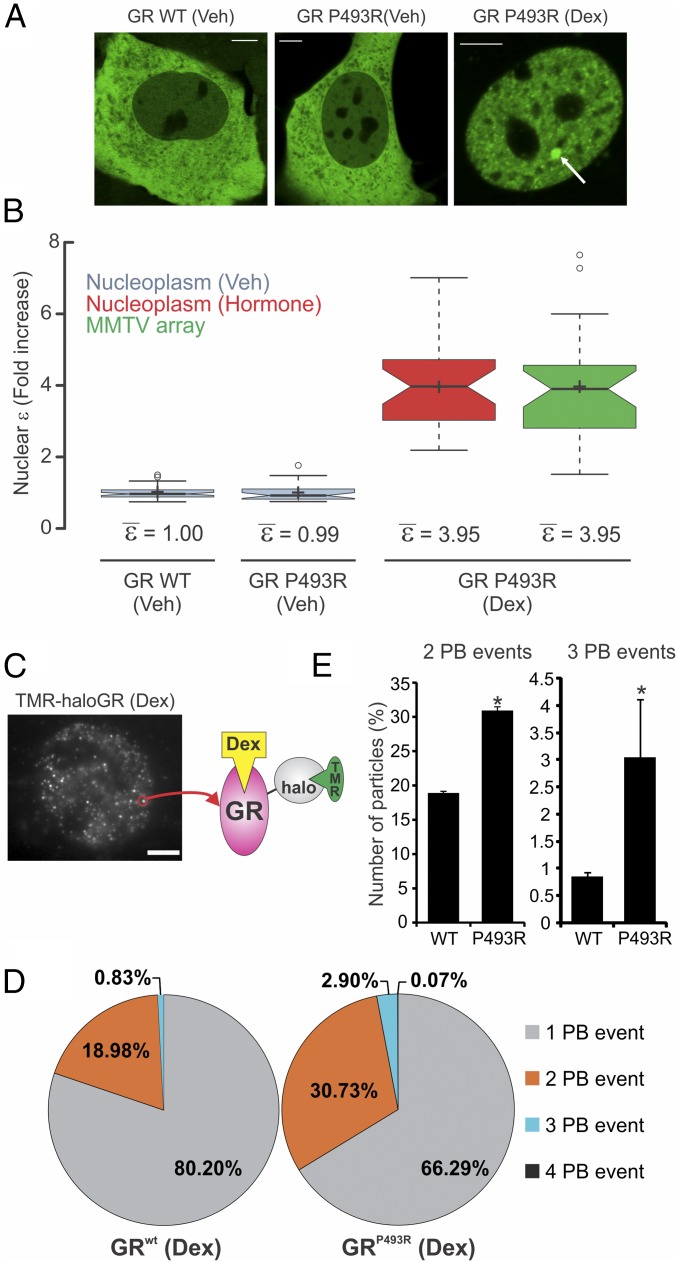
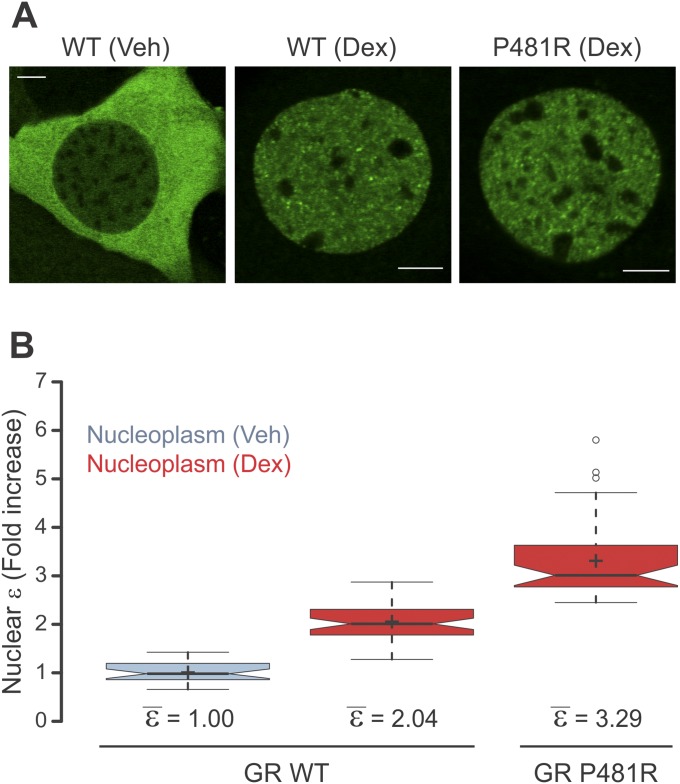
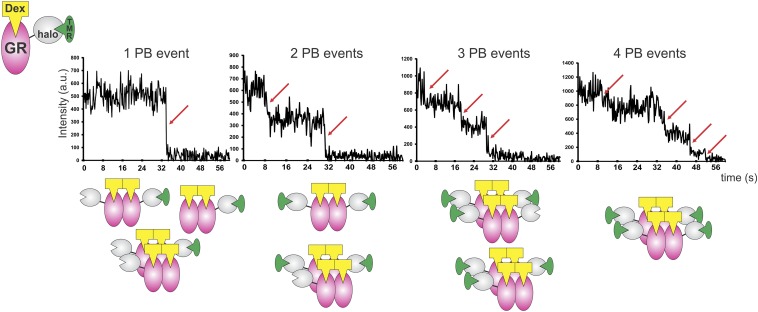
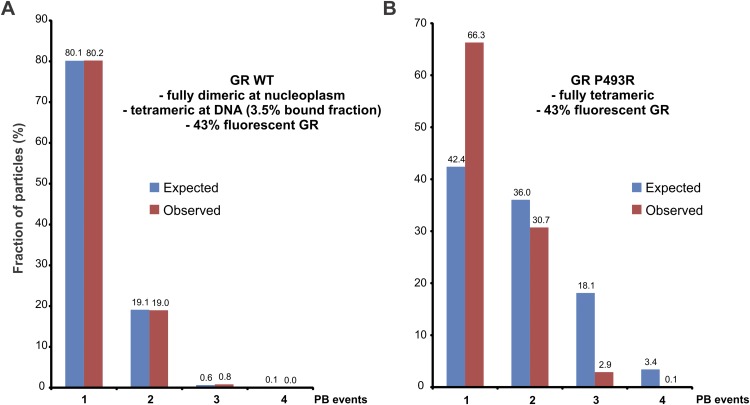
Transcription factors dynamically bind to chromatin and are essential for the regulation of genes. Although a large percentage of these proteins appear to self-associate to form dimers or higher order oligomers, the stoichiometry of DNA-bound transcription factors has been poorly characterized in vivo. The glucocorticoid receptor (GR) is a ligand-regulated transcription factor widely believed to act as a dimer or a monomer. Using a unique set of imaging techniques coupled with a cell line containing an array of DNA binding elements, we show that GR is predominantly a tetramer when bound to its target DNA. We find that DNA binding triggers an interdomain allosteric regulation within the GR, leading to tetramerization. We therefore propose that dynamic changes in GR stoichiometry represent a previously unidentified level of regulation in steroid receptor activation. Quaternary structure analysis of other members of the steroid receptor family (estrogen, androgen, and progesterone receptors) reveals variation in oligomerization states among this family of transcription factors. Because GR's oligomerization state has been implicated in therapy outcome, our findings open new doors to the rational design of novel GR ligands and redefine the quaternary structure of steroid receptors.

Keywords: dimer; glucocorticoid receptor; number and brightness; steroid receptors; tetramer.


Conflict of interest statement

The authors declare no conflict of interest.

Figures

Fig. 1.
Fig. 1.
GR and p53 oligomeric state in living cells. (A) Subcellular localization of transiently transfected GFP-GR in 3617 cells treated with corticosterone (Cort), dexamethasone (Dex), or the mixed antagonist RU486 and in H1299 cells with GFP-p53 treated with the DNA-damaging agent doxorubicin (Doxo). White arrows point to the MMTV array. (Scale bars: 5 μm.) (B) N&B assay. The figure shows the fold increase of the molecular brightness (ε) in the nucleus, relative to the control. Centered lines show the medians; box limits indicate the 25th and 75th percentiles; whiskers extend 1.5-fold the interquartile range from the 25th and 75th percentiles, with outliers represented by dots; and crosses represent sample means [n = 56, 48, 45, 63, 57, 40, 39, 56, and 46 sample points (ε measurement on each cell compartment)]. Veh, vehicle.
Fig. S1.
Fig. S1.
Testing possible artifacts in the N&B assay. (A) Representative confocal images of 3617 cells transiently expressing both GFP-C/EBP and mCherry (mCh)-GR. White arrows point to the array, and orange arrows point to the heterochromatin aggregates. (Scale bars: 5 μm.) (B) Figure shows the molecular brightness (ε) in the nuclear compartment of C/EBP as a percentage relative to the nucleoplasm in the untreated condition. (C) Subcellular localization of transiently transfected 1361.5 NIH/3T3 cells with GFP-GR treated with the indicated hormones. White arrows point to the MMTV array, which is considerably bigger than the one in 3617 cells. Cells usually contain more than one array. (Scale bars: 5 μm.) (D) N&B assay. The figure shows the fold increase of ε relative to the control (n = 36, 38, 37, 32, and 32 cells). (E) Representative confocal images of 3617 cells expressing the Tet-regulated GFP-GR transgene. (F) Western blot (WB) against GR showing similar amounts of GFP-GR and the endogenous GR protein. (G) Figure shows the fold increase of ε relative to the control (n = 29, 46, and 46 cells). Because the ratio of GFPGR/GR molecules is similar, ε is lower than 2 because of the formation of GR/GFP-GR heterodimers that are perceived by the assay as monomers. The same principle applies to the array. Veh, vehicle.
Fig. 2.
Fig. 2.
PR, AR, and ER oligomeric state in living cells. (A) Subcellular localization of 3617 cells transiently expressing GFP-PRB or GFP-AR. For ER visualization, 7438 and 6644 cells were chosen that express mCherry-ERwt or the pbox mutation, respectively, under the Tet-off system. Cells were treated with progesterone (Prog), dihydrotestosterone (DHT), or estradiol (E2) in combination with Dex to assist the loading of ER (23). White arrows point to the MMTV array. (Scale bars: 5 μm.) (B) N&B assay. The figure shows the fold increase of the nuclear ε relative to the control. For PR and AR, stable cell lines derived from 7110 cells expressing GFP-PRB or GFP-AR were also measured (orange plots). Center lines show the medians; box limits indicate the 25th and 75th percentiles as determined by R software; whiskers extend 1.5-fold the interquartile range from the 25th and 75th percentiles, with outliers represented by dots; and crosses represent sample means (n = 70, 27, 46, 39, 31, 31, 41, 47, 41, 16, 30, 22, and 29 cells).
Fig. S2.
Fig. S2.
Homo-FRET measurements reveal higher GR oligomerization in both the nucleus and the MMTV array. (A) Initial steady-state anisotropy values ± SE for the indicated treatments are shown (n = 40 cells). Poly, polynomial. (B) Same cells as in A were sequentially photobleached, and their anisotropy values were measured. Trend lines were fitted to a polynomial or linear regression model (R2 values are indicated in A).
Fig. 3.
Fig. 3.
DNA modulates GR oligomerization state. (A) Subcellular localization of GFP-GRP493R mutant in 3617 cells. WT, wild type. (Scale bars: 5 μm.) (B) N&B assay as shown in Fig. 1 (n = 56, 30, 30, and 30 sample points). (C) Single molecules of TMR-haloGR visualized by HiLO microscopy (maximum projection image). (Scale bar: 5 μm.) (D) PB events distribution (n = 1,328 and n = 1,344 molecules, respectively). (E) Comparison of the two- and three-PB events between WT and P493R (n = 3 independent experiments). The different scale in the y axis should be noted. *P < 0.05 (Student’s t test).
Fig. S3.
Fig. S3.
Overexpression is not entirely accountable for the P481R phenotype. (A) MEF cells were obtained from GR-null mice and immortalized as previously described (3). Next, the established MEF GR knocked-out cell line was transduced with GFP-GR wild type (WT) or P481R. Images show representative cells treated with Dex. (Scale bars: 5 μm.) (B) N&B assay. The figure shows the fold increase in ε relative to the control (n = 29, 51, and 42).
Fig. S4.
Fig. S4.
Representative PB profiles of TMR-haloGR molecules. The red arrow indicates a PB event. Cartoons illustrate the presence of endogenous GR, unlabeled haloGR, and TMR-haloGR in the cells. Several combinations of GR quaternary structures would give the same PB profile.
Fig. S5.
Fig. S5.
Single-molecule PB analysis. This method consists of imaging single molecules and counting the number of observed bleaching steps. However, there is a nonzero probability that any given fluorophore will already be bleached (or otherwise unobserved); thus, less than the highest possible number of fluorescence decreases will be detected. Thus, the resulting observations are drawn from a binomial distribution (45). Moreover, in our case, we also have the presence of both nonfluorescent endogenous GR and unliganded haloGR. To estimate the amount of fluorescent GR inside the cells, we first assumed a complete dimeric population in the WT receptor based on the N&B results. Given the fact that we observed 18.98% of two-PB events, we can estimate the fluorescent population at around ∼43% [(0.43)2 = 0.1849]. (A) For the WT, we calculated two independent binomial distributions, one for a complete dimeric population (i.e., the nucleoplasm) and the other for a complete tetrameric population (DNA-bound GR). Because the GR-bound fraction is 3.5% (26), we weighted the contributions of each binomial model. Our observations fit well to the expected model, suggesting the presence of a small population of higher oligomerization states for GR. (B) By using the same estimation of the fraction for fluorescent GR molecules, the case for a fully tetrameric P493R did not fit the experimental data. This result suggests that a mixture of different oligomerization states, rather than a fully tetrameric population, is the most likely scenario for this mutant.
Fig. 4.
Fig. 4.
Structural domain dependence on GR oligomerization. (A) Cartoon showing the domain structure of GR (NTD, DBD, and LBD) and the mutations used in this study. The figure also shows the mouse sequence of the second zinc finger within GR’s DBD. (B) Subcellular localization of GR mutants. The white arrows point to the array. (Scale bars: 5 μm.) (C) N&B assay as shown in Fig. 1 (n = 70, 69, 57, 24, 25, 28, 27, 52, 50, 21, 17, 51, 51, 61, and 45 sample points). (D) Subcellular localization of GR truncation mutants. (Scale bars: 5 μm.) (E) N&B assay as shown in Fig. 1 (n = 56, 41, 37, 44, 24, 56, 47, 43, 32, 24, and 37 sample points).
Fig. S6.
Fig. S6.
Figure shows cartoon models based on N&B results (Fig. 4) for the quaternary structure of some of the mutants used in this work. For simplicity, only the head-to-head tetramers are shown, but the head-to-tail model is also plausible.
Fig. 5.
Fig. 5.
Proposed model for the modulation of GR quaternary structure. Upon ligand binding, GR forms dimers through LBD–LBD and DBD–DBD interactions. DNA binding triggers an allosteric conformational change in the D-loop within the DBD. Also, the intrinsically disordered NTD may adopt a more defined structure upon DNA binding (6). By as yet unknown mechanisms, the conformational change in the DBD affects the LBD, and the receptor now undergoes a dimer-to-tetramer transition. Both head-to-head (1) and head-to-tail (2) configurations are equally plausible.

Similar articles

Cited by

References

    1. Miranda TB, Morris SA, Hager GL. Complex genomic interactions in the dynamic regulation of transcription by the glucocorticoid receptor. Mol Cell Endocrinol. 2013;380(1-2):16–24. - PMC - PubMed
    1. Clark AR, Belvisi MG. Maps and legends: The quest for dissociated ligands of the glucocorticoid receptor. Pharmacol Ther. 2012;134(1):54–67. - PubMed
    1. Presman DM, et al. Live cell imaging unveils multiple domain requirements for in vivo dimerization of the glucocorticoid receptor. PLoS Biol. 2014;12(3):e1001813. - PMC - PubMed
    1. Ayroldi E, Macchiarulo A, Riccardi C. Targeting glucocorticoid side effects: Selective glucocorticoid receptor modulator or glucocorticoid-induced leucine zipper? A perspective. FASEB J. 2014;28(12):5055–5070. - PubMed
    1. John S, et al. Chromatin accessibility pre-determines glucocorticoid receptor binding patterns. Nat Genet. 2011;43(3):264–268. - PMC - PubMed

Publication types

LinkOut - more resources