. 2016 Aug;22(8):851-60.
doi: 10.1038/nm.4123. Epub 2016 Jul 4.

Targeting focal adhesion kinase renders pancreatic cancers responsive to checkpoint immunotherapy

Affiliations

Targeting focal adhesion kinase renders pancreatic cancers responsive to checkpoint immunotherapy

Hong Jiang et al. Nat Med. 2016 Aug.

Abstract

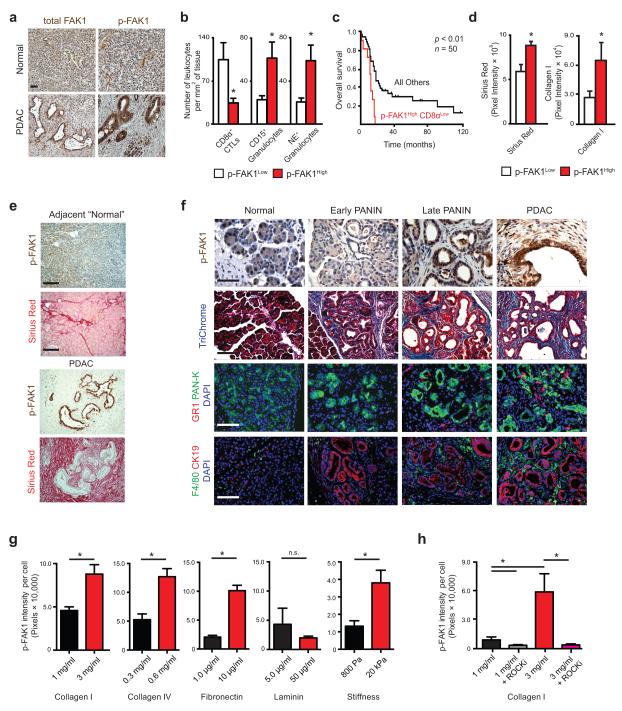
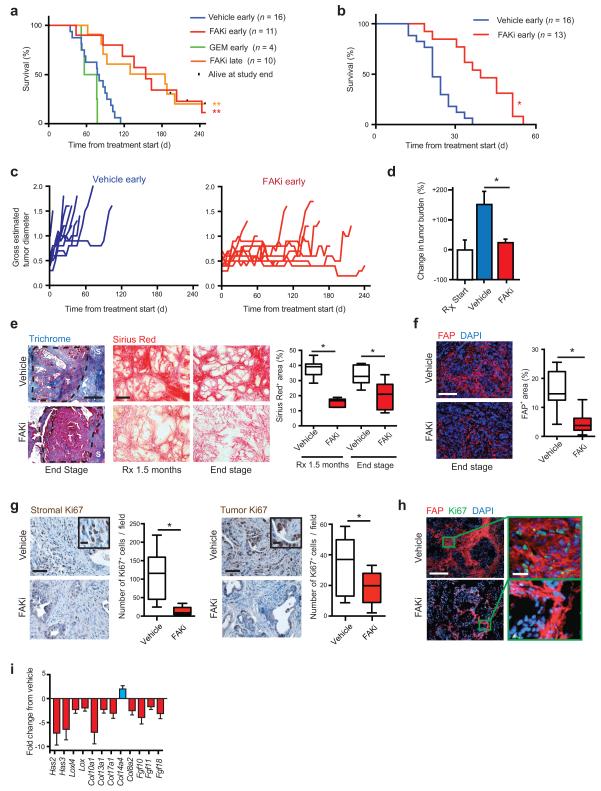
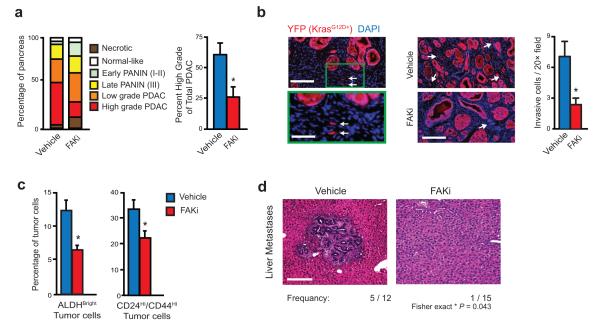
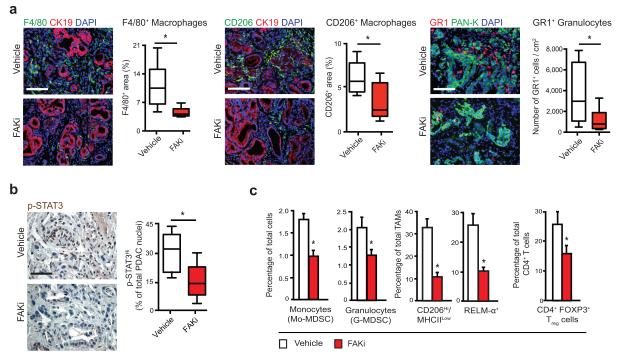
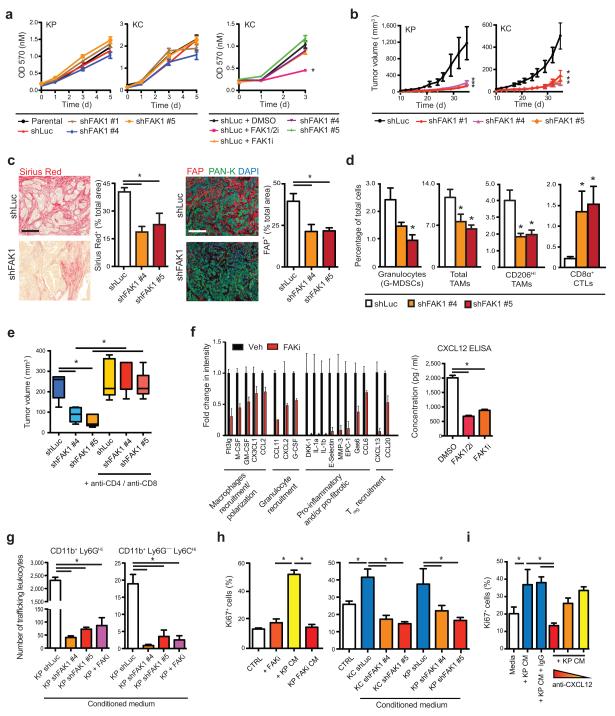
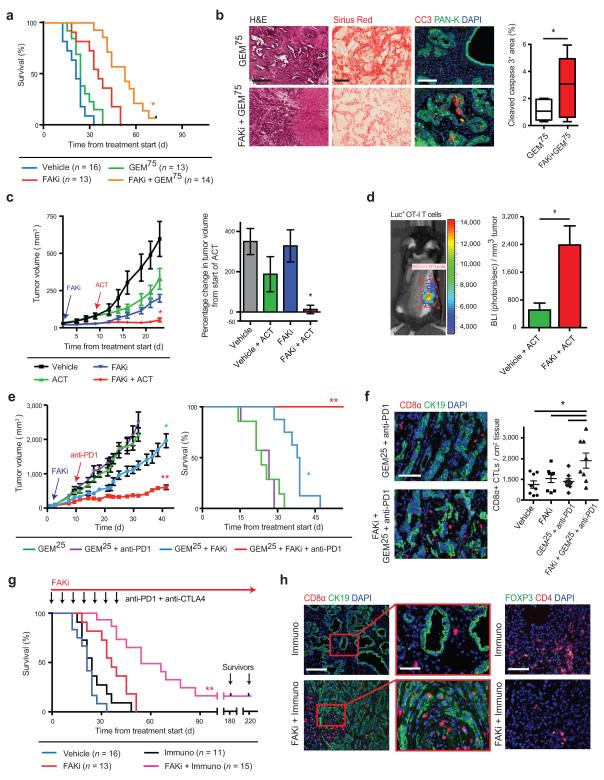
Single-agent immunotherapy has achieved limited clinical benefit to date in patients with pancreatic ductal adenocarcinoma (PDAC). This may be a result of the presence of a uniquely immunosuppressive tumor microenvironment (TME). Critical obstacles to immunotherapy in PDAC tumors include a high number of tumor-associated immunosuppressive cells and a uniquely desmoplastic stroma that functions as a barrier to T cell infiltration. We identified hyperactivated focal adhesion kinase (FAK) activity in neoplastic PDAC cells as an important regulator of the fibrotic and immunosuppressive TME. We found that FAK activity was elevated in human PDAC tissues and correlated with high levels of fibrosis and poor CD8(+) cytotoxic T cell infiltration. Single-agent FAK inhibition using the selective FAK inhibitor VS-4718 substantially limited tumor progression, resulting in a doubling of survival in the p48-Cre;LSL-Kras(G12D);Trp53(flox/+) (KPC) mouse model of human PDAC. This delay in tumor progression was associated with markedly reduced tumor fibrosis and decreased numbers of tumor-infiltrating immunosuppressive cells. We also found that FAK inhibition rendered the previously unresponsive KPC mouse model responsive to T cell immunotherapy and PD-1 antagonists. These data suggest that FAK inhibition increases immune surveillance by overcoming the fibrotic and immunosuppressive PDAC TME and renders tumors responsive to immunotherapy.


Figures

Figure 1
Figure 1
FAK1 is hyperactivated in PDAC. (a) Representative Immunohistochemistry of total and phosphorylated FAK1/FAK (p-FAK1/FAK, Tyr397) in human normal pancreas and PDAC tissues; scale bar, 100 μm. (b) Immunohistochemistry analysis of CD8α+ CTLs, CD15+ and neutrophil elastase+ (NE+) granulocyte numbers in human PDAC patient tissues subdivided into p-FAK1High (n = 33) and p-FAK1Low (n = 23) by mean p-FAK1 expression. (c) Kaplan-Meier survival analysis of PDAC patients stratified by mean p-FAK1 and CD8α+ CTL values (n = 50), with p-FAK1High CD8αLow group displayed vs. all other groups. (d) Quantification of Sirius Red staining (total collagen) or collagen I in human PDAC tumor tissues subdivided into p-FAK1High and p-FAK1Low by mean p-FAK1 expression. (e) Representative Immunohistochemistry for p-FAK1 and staining for Sirius Red in human PDAC and adjacent “normal” tissue; scale bar, 400 μm. (f) Representative immunohistochemistry for p-FAK1, Trichrome (total collagen), GR1+ granulocytes and F4/80+ TAMs in normal pancreatic tissue, early PANIN, late PANIN and PDAC tumor from KPC mice. Cytokeratin 19 (“CK19”) and Pan-Keratin (“PAN-K”) mark pancreatic epithelial cells. Scale bars: p-FAK1, 100 μm; Trichrome, GR-1 and F4/80, 200 μm. (g) Immunofluorescence analysis of p-FAK1 expression in KP cells cultured on collagen I gel, collagen IV-coated plates, fibronectin (FN1)-coated or laminin-coated polyacrylamide gels and FN1-coated compliant (800 Pa) / rigid (20 kPa) polyacrylamide gels. (h) Immunofluorescence analysis of p-FAK1 expression in KP cells cultured on collagen I gel and treated with vehicle or ROCKi (Y-27632). Error bars, mean ± s.e.m; * indicates P < 0.05 by unpaired two-sided Student’s t-test (b,d and g), log-rank test (c) or one-way ANOVA with Tukey’s method for multiple comparisons (h).
Figure 2
Figure 2
Inhibition of FAK reduces tumor fibrosis and suppresses tumor progression. (a, b) Kaplan-Meier survival analysis of (a) KPC and (b) KPPC mice treated with vehicle, FAK inhibitor (FAKi; VS-4718), or Gemcitabine (GEM). Treatment started at 3.5 months (“early”) or at overt disease (“late”) in a, and at 1.5 months in b. (c) Measurement of maximal tumor diameter in KPC mice since start of treatment as described in a. (d) Change in tumor burden in mice bearing established (> 0.5 cm) orthotopic KI tumors treated with vehicle or FAKi (n = 8–9 mice/group). (e) Representative Trichrome (Blue) and Sirius Red (Red) staining in PDAC tissue from KPC mice treated with either vehicle or FAKi; scale bars, 400 μm. Right panel depicts percentage of Sirius Red+ area for each treatment group and time point (n = 6–9 mice/group). (f) Representative immunofluorescence staining for FAP in PDAC tissue from vehicle- and FAKi- treated KPC mice; scale bar, 400 μm. Right panel depicts percentage of FAP+ area for each treatment group (n = 11–13 mice/group). (g) Representative immunohistochemistry and quantification for stromal and tumor Ki67+ cells from vehicle- and FAKi-treated KPC mice; scale bars, 200 μm (inset, 50 μm) (n = 8–11 mice/group). (h) Representative immunofluorescence staining for FAP and Ki67 in PDAC tissue from vehicle- and FAKi-treated KPC mice; scale bars, 400 μm (magnified field, 50 μm). (i) mRNA expression analysis from gene array of orthotopic KP tumors following 14-days treatment with vehicle or FAKi. (n = 6–7 mice/group). Error bars, mean ± s.e.m.; * indicates P < 0.05, ** indicates P < 0.01 by log-rank test (a,b), or unpaired two-sided Student’s t-test (d,e,f,g).
Figure 3
Figure 3
FAK inhibitor suppresses tumor progression and metastasis. (a) Tumor grading analysis on pancreas tissue from end-stage vehicle- and FAKi-treated KPC mice for each disease stage (left, n = 16–17 mice/group) and percentage of high-grade PDAC in total PDAC area (right, n = 5 mice/group). (b) Immunohistochemistry analysis and quantification of YFP+ invasive tumor cells in PDAC tissue from KPC-Y mice treated for 1 month with vehicle or FAKi; scale bars, 200 μm for left panel (magnified field, 100 μm) and 260 μm for right panel. Arrowheads indicate single invading tumor cells (n = 5 mice/group). (c) Flow cytometry analysis of % ALDHBright and % CD24Hi CD44Hi tumor cells in KI orthotopic tumors treated for 10 days with vehicle or FAKi (n = 6–7 mice/group). (d) Histology analysis for frequency of liver metastases from KPC mice treated with vehicle or FAKi; scale bar, 200 μm. Error bars, mean ± s.e.m.; * indicates P < 0.05 by Student’s t-test (a-c), or Fisher’s exact test (d).
Figure 4
Figure 4
FAK inhibition decreases immunosuppressive cell populations in tumors. (a) Representative immunofluorescence and quantification for F4/80+ or CD206+ macrophages and GR1+ granulocytes in PDAC tissue from KPC mice treated for 1.5 months with vehicle or FAKi; scale bars, 200 μm. Graphs depict percentage of marker+ area (for F4/80 and CD206) or cells/cm2 tissue (for GR1). CK19 and PAN-K mark epithelial-origin tumor cells. (n = 6–11 mice/group). (b) Representative immunohistochemistry and quantification for p-STAT3 in PDAC tissue from KPC mice treated for 1.5 months with vehicle or FAKi. Graph depicts percentage of p-STAT3High/PDAC cell nuclei (n = 9 mice/group). (c) Flow cytometry analyses of monocytes, granulocytes, TAMs and Tregs in PDAC tissue from mice bearing orthotopic KI tumors treated for 10 days with vehicle or FAKi (n = 6–7 mice/group). Error bars, mean ± s.e.m.; * indicates P < 0.05 by Student’s t-test (a,b,c).
Figure 5
Figure 5
FAK1 in PDAC cells drives fibrosis and immunosuppression. (a) In vitro growth analysis for KP or KC cells expressing shLuc or shFAK1 constructs, or treated with FAK1/2i (VS-4718) or FAK1i (VS-116). (b) Syngeneic tumor growth of KP or KC cells stably expressing shLuc or shFAK1. (c) Representative staining and quantification for Sirius Red (left) and FAP (right) in KP tumors expressing shLuc or shFAK1; scale bars, 400 μm. (d) Flow cytometry analysis of granulocytes, TAMs and CD8+ T cells in KP tumors expressing shLuc or shFAK1. (e) In vivo subcutaneous tumor burden 25 days after injection with KP cells expressing shLuc or shFAK1. A subset of mice was also treated with CD4- and CD8-depleting IgG starting 1 day before tumor cell injection. (f) Cytokine profile of CM from KP cells treated with vehicle or FAKi for 24 hours (left) and ELISA for CXCL12 protein expression in CM from KP cells treated with DMSO, FAK1/2i or FAK1i for 24 hours (right). (g) Flow cytometry analysis of CD11b+ Ly6G+ and CD11b+ Ly6G Ly6C+ leukocyte trafficking in trans-well system containing different CM. (h) Immunofluorescence staining for Ki67 in normal murine pancreas fibroblasts following 24-hour treatment with DMSO or FAKi, with CM from parental KP cells +/− DMSO or FAKi (left panel), or CM from KP or KC cells expressing shLuc or shFAK1 (right panel). (i) Immunofluorescence staining for Ki67 in normal murine pancreas fibroblasts following treatment with CM from KP cells cultured on BME +/− neutralizing antibodies against CXCL12. All in vitro assays are representative of 3 independent and agreeing replicate experiments. All animal experiments included 5–7 mice/group unless otherwise specified. Error bars, mean ± s.e.m.; * indicates P < 0.05 by one-way ANOVA with Dunnett’s Multiple Comparison Test (a,b,c,d,f,g) or Student’s t-test (e,h,i).
Figure 6
Figure 6
FAK inhibition renders PDAC tumors responsive to chemo- and immunotherapy. (a) Kaplan-Meier survival analysis of KPPC mice treated with vehicle or FAKi (VS-4718) +/− 75 mg/kg Gemcitabine (“GEM75”). (b) Representative Hematoxylin and Eosin (H&E), Sirius Red and immunofluorescence staining for cleaved caspase-3 (CC3) and Pan-Keratin (Pan-K) in end-stage tumor tissue from KPPC mice treated with GEM75 or FAKi+GEM75; scale bar, 400 μm for H&E and Sirius Red, 200 μm for CC3. (c) Tumor growth curve of KP-OVA-bearing mice treated with vehicle or FAKi followed by adoptive cell transfer (ACT) of OT-I T cells. Right panel shows percentage change in tumor volume 11 days after ACT. (d) In vivo bioluminescence imaging (BLI) of luciferase+ OT-I CD8α+ T cells in KP-OVA-bearing mice 11 days after ACT, with quantification of mean photon flux/tumor volume. (e) Tumor growth curve (left) and Kaplan-Meier survival analysis (right) of KP tumor-bearing mice treated as described. (f) Representative immunofluorescence staining and quantification for CD8α+ CTLs and cytokeratin 19 (CK19) in tumor tissues from selected treatment groups; scale bar, 100 μm. (g) Kaplan-Meier survival analysis of KPPC mice treated with vehicle, FAKi, “Immuno” (i.e. GEM25 + anti-PD1/anti-CTLA4), vehicle + Immuno or FAKi + Immuno. Black notches indicate animals alive without detectable disease progression after 6 months. (h) Representative immunofluorescence staining for CD8α+ CTLs (left) or CD4+ FOXP3+ Tregs (right) in end-stage tumor tissue from KPPC mice; scale bars, 200 μm for CD8α and CD4 (magnified field, 100 μm). All values are depicted as mean ± s.e.m.; * indicates P < 0.05, ** denotes P < 0.01 by log-rank test (a,e,g), unpaired two-sided Student’s t-tests (b,d) or one-way ANOVA with Tukey’s method for multiple comparisons (c,e,f). All animal experiments include >7 mice/group unless otherwise specified.

Comment in

Similar articles

Cited by

References

    1. Royal RE, et al. Phase 2 trial of single agent Ipilimumab (anti-CTLA-4) for locally advanced or metastatic pancreatic adenocarcinoma. Journal of immunotherapy. 2010;33:828–833. - PMC - PubMed
    1. Zhu Y, et al. CSF1/CSF1R Blockade Reprograms Tumor-Infiltrating Macrophages and Improves Response to T Cell Checkpoint Immunotherapy in Pancreatic Cancer Models. Cancer Res. 2014 - PMC - PubMed
    1. Panni RZ, Linehan DC, DeNardo DG. Targeting Tumor-Infiltrating Macrophages to Combat Cancer. Immunotherapy. 2013 In-Press. - PMC - PubMed
    1. Mitchem JB, et al. Targeting Tumor-Infiltrating Macrophages Decreases Tumor-Initiating Cells, Relieves Immunosuppression, and Improves Chemotherapeutic Responses. Cancer Res. 2013 - PMC - PubMed
    1. Goedegebuure P, et al. Myeloid-derived suppressor cells: general characteristics and relevance to clinical management of pancreatic cancer. Curr Cancer Drug Targets. 2011;11:734–751. - PMC - PubMed

Publication types

MeSH terms