. 2016 Jun 28:6:28990.
doi: 10.1038/srep28990.

High Fat Diets Induce Colonic Epithelial Cell Stress and Inflammation that is Reversed by IL-22

Affiliations

High Fat Diets Induce Colonic Epithelial Cell Stress and Inflammation that is Reversed by IL-22

Max Gulhane et al. Sci Rep. .

Abstract

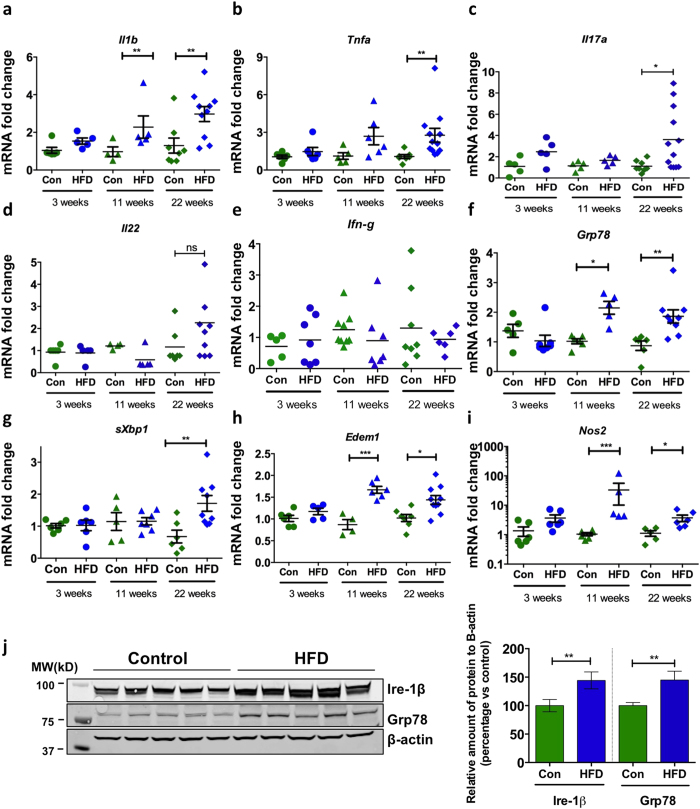
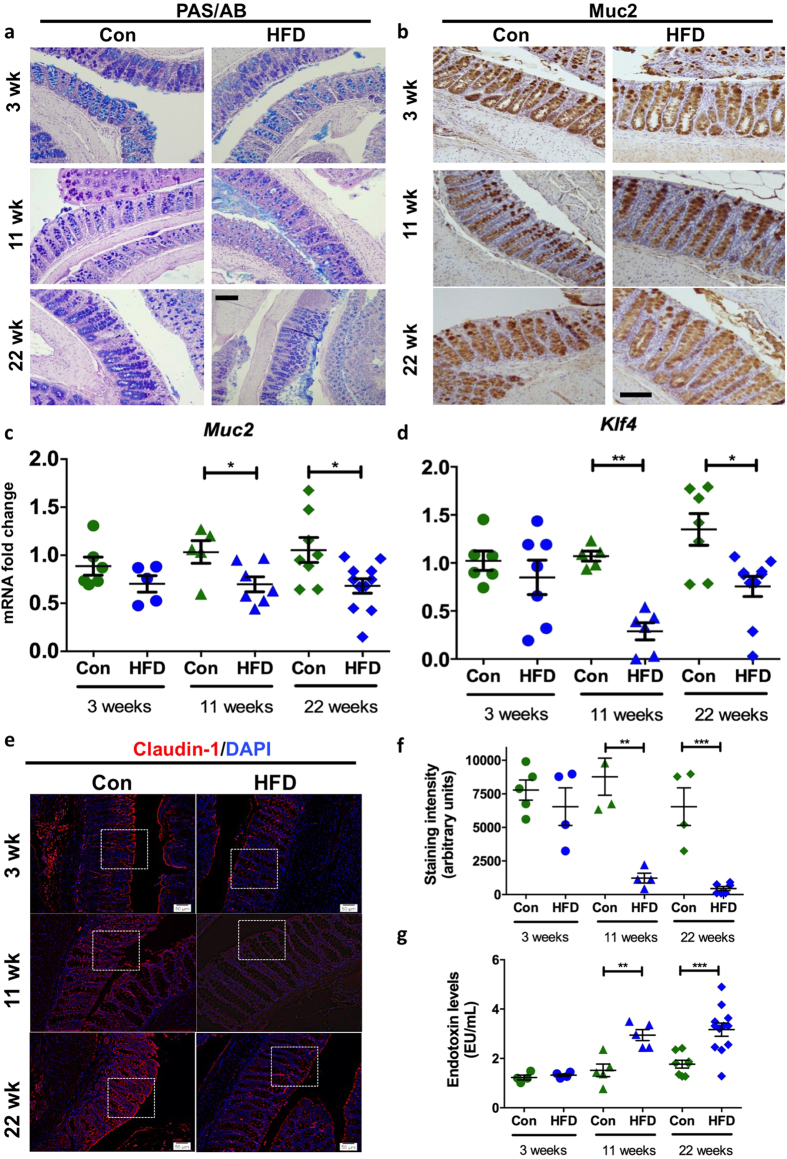
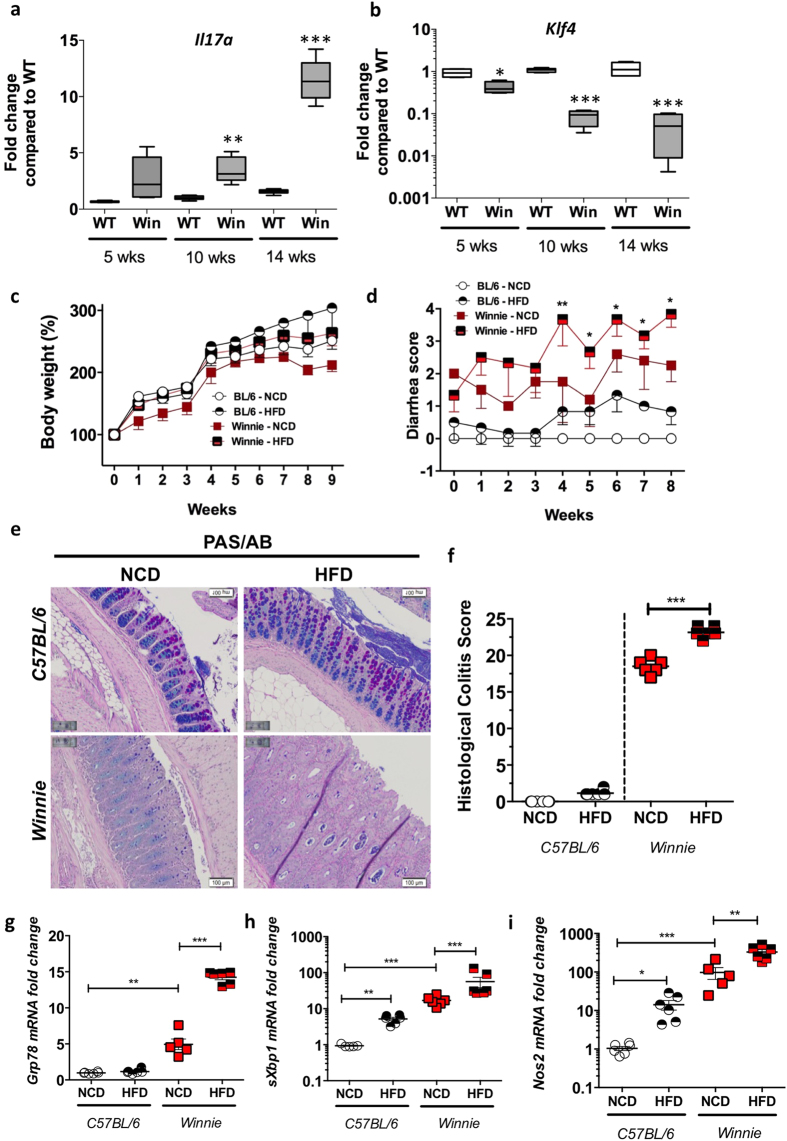
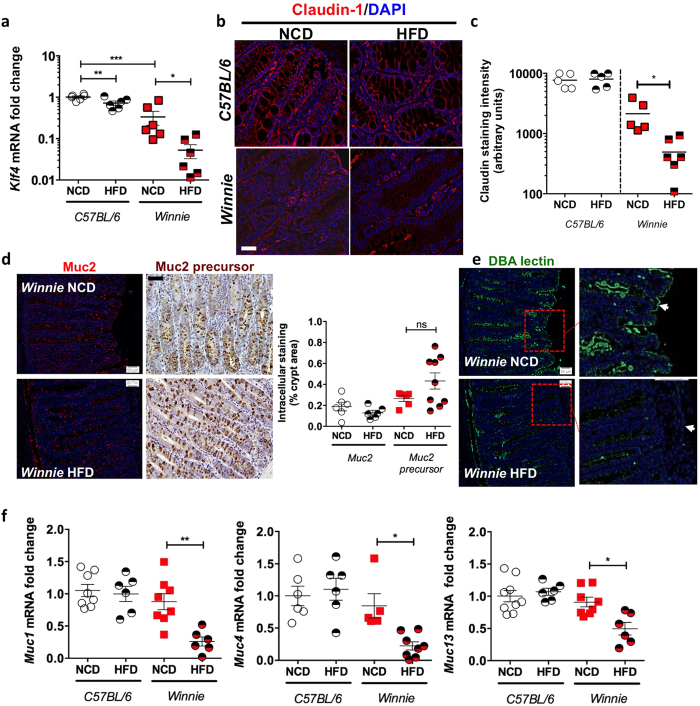
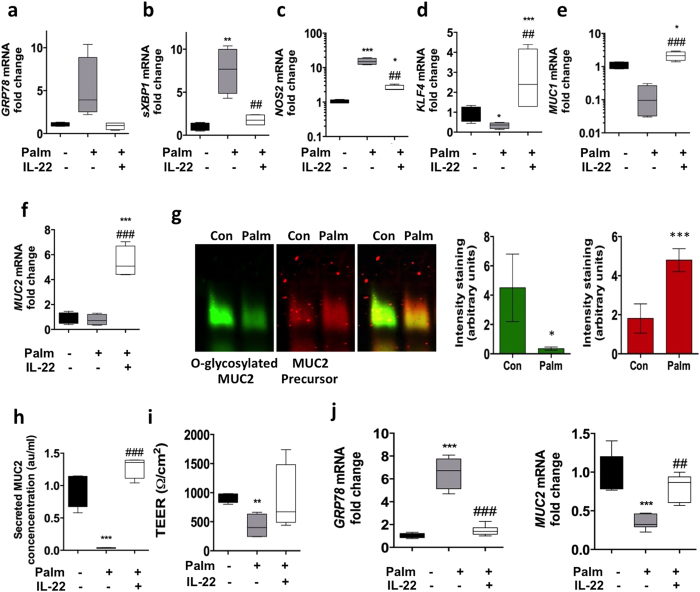
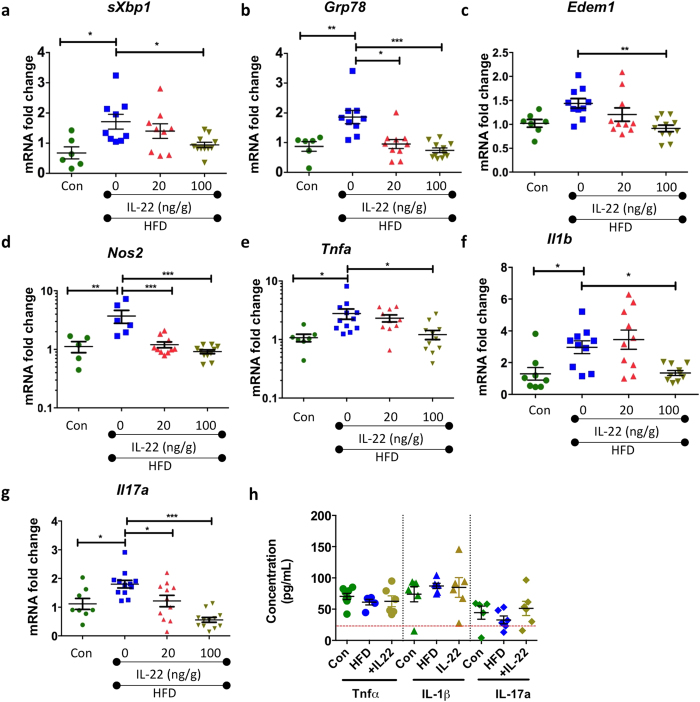
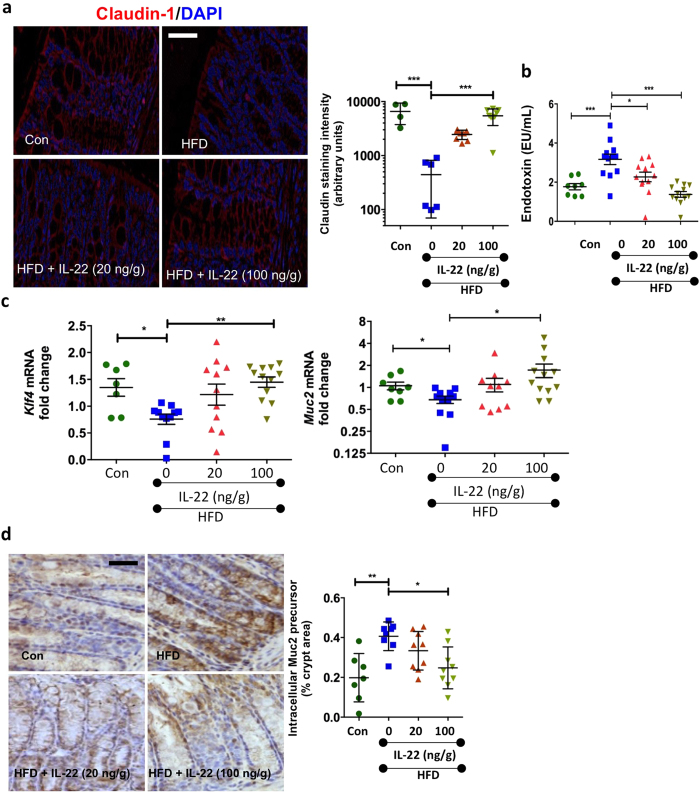
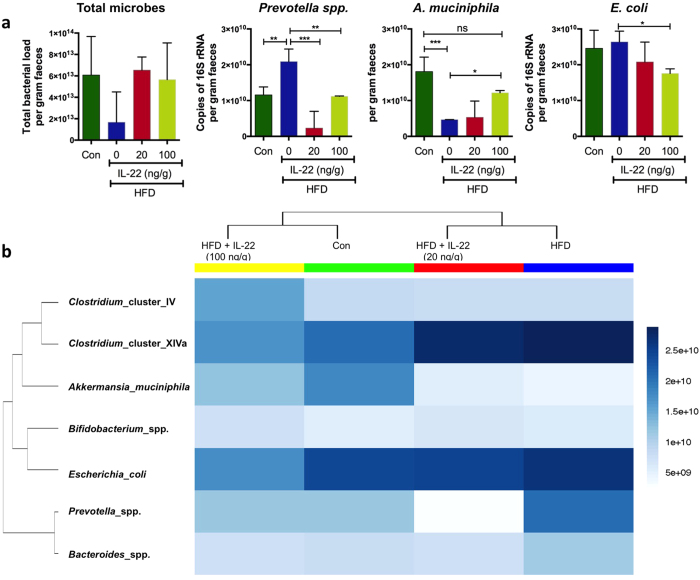
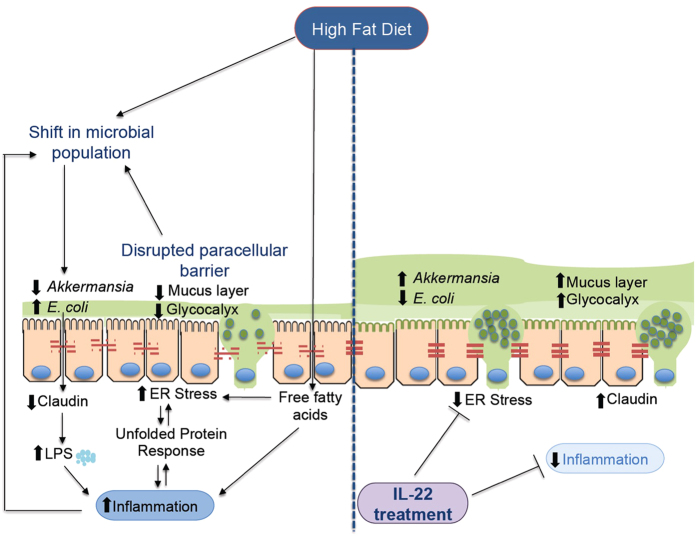
Prolonged high fat diets (HFD) induce low-grade chronic intestinal inflammation in mice, and diets high in saturated fat are a risk factor for the development of human inflammatory bowel diseases. We hypothesized that HFD-induced endoplasmic reticulum (ER)/oxidative stress occur in intestinal secretory goblet cells, triggering inflammatory signaling and reducing synthesis/secretion of proteins that form the protective mucus barrier. In cultured intestinal cells non-esterified long-chain saturated fatty acids directly increased oxidative/ER stress leading to protein misfolding. A prolonged HFD elevated the intestinal inflammatory cytokine signature, alongside compromised mucosal barrier integrity with a decrease in goblet cell differentiation and Muc2, a loss in the tight junction protein, claudin-1 and increased serum endotoxin levels. In Winnie mice, that develop spontaneous colitis, HFD-feeding increased ER stress, further compromised the mucosal barrier and increased the severity of colitis. In obese mice IL-22 reduced ER/oxidative stress and improved the integrity of the mucosal barrier, and reversed microbial changes associated with obesity with an increase in Akkermansia muciniphila. Consistent with epidemiological studies, our experiments suggest that HFDs are likely to impair intestinal barrier function, particularly in early life, which partially involves direct effects of free-fatty acids on intestinal cells, and this can be reversed by IL-22 therapy.


Figures

Figure 1
Figure 1. Wild-type C57BL/6 mice were fed a high fat diet (HFD) or normal chow diet (Con) for 3 weeks (n = 6–7 per group), 11 weeks (n = 5–6 per group) or 22 weeks (n = 8–12 per group).
Colonic mRNA level of cytokines (a) Il1b, (b) Tnfα, (c) Il17a, (d) Il22 and, (e) Ifn-g, ER stress markers (f) Grp78, (g) spliced-Xbp1 and (h) Edem1, and oxidative stress marker (i) Nos2, was determined by qRT-PCR in the colon. Normalised to mean expression of β-actin and expressed as a fold change compared to in respective control mice. (j) SDS-PAGE analysis of epithelial cells isolated from the distal colon of control and HFD mice, immunoblotted with ER stress marker antibodies for Ire-1β and Grp78; β-actin is shown as a loading control. Densitometry shows the quantification as relative amounts of protein of interest normalized against β-actin and presented as a percentage of control samples. n = 5. Mean ± SEM. Unpaired student t test Con versus HFD for each respective experiment duration. *p < 0.05 **p < 0.01 ***p < 0.001.
Figure 2
Figure 2. Wild-type C57BL/6 mice were fed a high fat diet (HFD) or normal chow diet (Con) for 3 weeks (n = 6–7 per group), 11 weeks (n = 5–6 per group) or 22 weeks (n = 8–12 per group).
(a) Periodic Acid Schiff’s-Alcian Blue and (b) mature Muc2 immunohistochemical staining shows glycoproteins within the colon in HFD versus Con mice. qRT-PCR was used to determine the colonic mRNA levels of (c) Muc2 and (d) Klf4. Normalised to mean expression of β-actin and expressed as a fold change compared to in respective control mice. (e) Immu-nofluorescence was used to determine the levels of claudin-1 (boxes highlight high-powered images shown in Supplementary Fig. 2j), (f) shows the staining intensity. (g) Serum endotoxin levels (EU/mL). Mean ± SEM. Unpaired student t test Con versus HFD for each respective experiment duration. *p < 0.05 **p < 0.01. Scale bars = 50 μM.
Figure 3
Figure 3
qRT-PCR was used to determine the levels of (a) Il17a and (b) Klf4 in wild-type C57BL/6 (Con) or Winnie (Win) mice with age. (c) Con or Winnie mice were fed a high fat diet (HFD) or regular control diet (NCD) for 9 weeks following weaning (3 weeks of age); body weight changes across the duration of experiment. (d) Diarrhea score during the course of the experiment. (e) Periodic Acid-Schiff’s-Alcian Blue staining and (f) histological score in wild-type and Winnie mice on NCD or HFD. qRT-PCR was used to determine the levels of ER stress markers (g) Grp78 and (h) sXbp1 and oxidative stress marker (i) Nos2. n = 5–8 per group. qRT-PCR data is normalised to mean expression of β-actin and expressed as a fold change compared to in respective control mice. Mean ± SEM or box plots with whiskers show median, Q1, Q3 and min/max One way ANOVA with Bonferroni post-test Con versus HFD, Con versus Win, Con versus Win HFD and Win versus Win HFD. *p < 0.05 **p < 0.01 ***p < 0.001. Scale bars = 100 μM.
Figure 4
Figure 4
qRT-PCR was used to determine the levels of (a) Klf4 in Con or Winnie mice fed a high fat diet (HFD) or regular control diet (NCD) for 9 weeks following weaning (3 weeks of age). (b) Immunofluorescence staining with claudin-1 antibody and (c) staining intensity as determined by ImageJ analysis. (d) Immunofluorescence/immunohistochemical staining was used to determine the levels of mature Muc2 and Muc2 precursor respectively in Winnie mice on control and high fat diet; % of intracellular staining per crypt area is shown as box and whisker plots. (e) DBA lectin staining was used to determine the changes in the glycocalyx in Winnie mice on a HFD. (f) qRT-PCR was used to determine the mRNA expression of genes encoding cell-surface mucins, Muc1, Muc4 and Muc13. n = 5–7 per group. Normalised to mean expression of β-actin and expressed as a fold change compared to in respective control mice. Mean ± SEM. One way ANOVA with Bonferroni post-test Con versus HFD, Con versus Win, Con versus Win HFD and Win versus Win HFD. *p < 0.05 **p < 0.01 ***p < 0.001. Scale bars = 50 μM.
Figure 5
Figure 5. LS174T cells were treated with control BSA, 0.5 mM palmitate or 0.5 mM palmitate and 50 ng/mL of IL-22 for 24 hours.
mRNA levels of ER/oxidative stress markers (a) GRP78, (b) spliced XBP1 (c) NOS2, (d) goblet cell differentiation factor KLF4, (e) component of the glycocalyx cell surface MUC1, (f) major secretory product of goblet cells MUC2 were determined by qRT-PCR. Normalized to expression of β-Actin and expressed as a fold change of the mean of BSA controls. Statistics: n = 8 per group (2 individual experiments). Data presented as box plots with whiskers show median, Q1, Q3 and min/max. One-way ANOVA with Bonferroni post-test Con versus treatments. *P < 0.05 **P < 0.01 ***P < 0.001. (g) Identification of the MUC2 precursor and mature glycosylated proteins in cell lysates analyzed under reducing conditions by agarose gel electrophoresis and Western blotting with the human MUC2 antibody reactive with glycosylated MUC2 and 4F1 MUC2 nonglycosylated precursor antibody, densitometry shows n = 4–6 from 2 independent experiments, mean ± SEM. Unpaired student t test Con versus treatments; *P < 0.05 ***P < 0.001. Secreted MUC2 concentration shown as arbitrary units/mL were determined using an ELISA. n = 8. (i) Transepithelial electrical resistance was measured in control and treated cells after 24 h. qRT-PCR was used to determine the changes in the mRNA levels of ER stress marker (j) GRP78 and secreted gel-forming MUCIN-2 in human intestinal primary organoid cultures treated with control BSA, 0.5 mM palmitate or 0.5 mM palmitate and 50 ng/mL of IL-22 for 24 hours. n = 6. Data presented as box plots with whiskers show median, Q1, Q3 and min/max. One-way ANOVA with Bonferroni post-test Con versus treatments. *p < 0.05 **p < 0.01 ***p < 0.001.
Figure 6
Figure 6. Wild-type C57BL/6 mice were fed a high fat diet (HFD) or normal chow diet (Con) for 22 weeks.
After 18 weeks, recombinant IL-22 was administered at 20 ng/g or 100 ng/g i.p twice weekly for 4 weeks. Expression of genes, using qRT-PCR, encoding ER stress markers (a) sXbp1, (b) Grp78 and (c) Edem1, (d) oxidative stress marker Nos2. Gene expression of proinflammatory cytokines (e) Tnfa (f) Il1b and, (g) Il17a was determined by qRT-PCR and ELISA was used to determine cytokine protein levels of TNF-α, IL-1β and IL17-a secreted by anti-CD3/anti-CD45–stimulated leukocytes isolated from mesenteric lymph nodes. qRT-PCR data is normalized to expression of β-Actin and expressed as a fold change of the mean of control. Mean ± SEM. N = 8–12 animals per group. One-Way ANOVA with Bonferroni post-test Con versus HFD and HFD versus IL-22 treatment. *p < 0.05 **p < 0.01 ***p < 0.001.
Figure 7
Figure 7
Immunofluorescent staining with (a) the claudin-1 antibody in wild-type C57BL/6 mice fed a high fat diet (HFD) or normal chow diet (Con) for 22 weeks and treated with recombinant IL-22 20 ng/g or 100 ng/g i.p twice weekly) for the last 4 weeks; staining intensity as determined by ImageJ analysis. (b) Endotoxin levels (EU/mL) in the serum collected from mice at the end of the experiment. (c) Levels of goblet cell transcription factor Klf4 and goblet cell mucin Muc2 were determined by qRT-PCR. Normalized to expression of β-Actin and expressed as a fold change of the mean of control. (d) Immunohistochemical staining for Muc2 precursor and quantification as a percentage of total crypt area using ImageJ software. Data presented are mean ± SEM. N = 8–12 animals per group. One-Way ANOVA with Bonferroni post-test Con versus HFD and HFD versus IL-22 treatment. *p < 0.05 **p < 0.01 ***p < 0.001. Scale bars = 50 μM.
Figure 8
Figure 8. Faecal samples were collected from wild-type C57BL/6 mice fed a HFD or normal chow diet (Con) for 22 weeks and treated with recombinant IL-22 (20 ng/g or 100 ng/g dose) for 4 weeks.
(a) Levels of total microbial (16S rRNA), Prevotella spp, A. muciniphila and E. coli were determined in the DNA extracted from faecal samples. n = 4 per group. Data presented as mean ± SD. One-way ANOVA with Bonferroni post-test multiple comparisons. *p < 0.05 **p < 0.01 ***p < 0.001. (b) Bray-Ward phylocluster analysis was used to determine the overall shifts in microbial population in Con, HFD and HFD mice treated with IL-22. Mean of n = 4 per group.
Figure 9
Figure 9. Schematic of the proposed events leading to cellular stress induced by high fat diets and the protective effect of IL-22.

Similar articles

Cited by

References

    1. McGuckin M. A. et al.. Mucin dynamics and enteric pathogens. Nat Rev Microbiol 9, 265 (2011). - PubMed
    1. Walter P. et al.. The unfolded protein response: from stress pathway to homeostatic regulation. Science 334, 1081 (2011). - PubMed
    1. Brandl K. et al.. Enhanced sensitivity to DSS colitis caused by a hypomorphic Mbtps1 mutation disrupting the ATF6-driven unfolded protein response. Proceedings of the National Academy of Sciences of the United States of America 106, 3300 (2009). - PMC - PubMed
    1. Kaser A. et al.. XBP1 links ER stress to intestinal inflammation and confers genetic risk for human inflammatory bowel disease. Cell 134, 743 (2008). - PMC - PubMed
    1. Park S. W. et al.. The protein disulfide isomerase AGR2 is essential for production of intestinal mucus. Proceedings of the National Academy of Sciences of the United States of America 106, 6950 (2009). - PMC - PubMed

Publication types