Multiple sclerosis patients have a distinct gut microbiota compared to healthy controls
- PMID: 27346372
- PMCID: PMC4921909
- DOI: 10.1038/srep28484
Multiple sclerosis patients have a distinct gut microbiota compared to healthy controls
Abstract
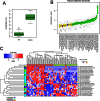
Multiple sclerosis (MS) is an immune-mediated disease, the etiology of which involves both genetic and environmental factors. The exact nature of the environmental factors responsible for predisposition to MS remains elusive; however, it's hypothesized that gastrointestinal microbiota might play an important role in pathogenesis of MS. Therefore, this study was designed to investigate whether gut microbiota are altered in MS by comparing the fecal microbiota in relapsing remitting MS (RRMS) (n = 31) patients to that of age- and gender-matched healthy controls (n = 36). Phylotype profiles of the gut microbial populations were generated using hypervariable tag sequencing of the V3-V5 region of the 16S ribosomal RNA gene. Detailed fecal microbiome analyses revealed that MS patients had distinct microbial community profile compared to healthy controls. We observed an increased abundance of Psuedomonas, Mycoplana, Haemophilus, Blautia, and Dorea genera in MS patients, whereas control group showed increased abundance of Parabacteroides, Adlercreutzia and Prevotella genera. Thus our study is consistent with the hypothesis that MS patients have gut microbial dysbiosis and further study is needed to better understand their role in the etiopathogenesis of MS.
Conflict of interest statement
The authors declare no competing financial interests.
Figures


Similar articles
-
Dysbiosis in the Gut Microbiota of Patients with Multiple Sclerosis, with a Striking Depletion of Species Belonging to Clostridia XIVa and IV Clusters.PLoS One. 2015 Sep 14;10(9):e0137429. doi: 10.1371/journal.pone.0137429. eCollection 2015. PLoS One. 2015. PMID: 26367776 Free PMC article. Clinical Trial.
-
The Gut Microbiota in Multiple Sclerosis: An Overview of Clinical Trials.Cell Transplant. 2019 Dec;28(12):1507-1527. doi: 10.1177/0963689719873890. Epub 2019 Sep 12. Cell Transplant. 2019. PMID: 31512505 Free PMC article.
-
Gut Microbiota as a Potential Predictive Biomarker in Relapsing-Remitting Multiple Sclerosis.Genes (Basel). 2022 May 23;13(5):930. doi: 10.3390/genes13050930. Genes (Basel). 2022. PMID: 35627315 Free PMC article.
-
Gut microbiome in multiple sclerosis: The players involved and the roles they play.Gut Microbes. 2017 Nov 2;8(6):607-615. doi: 10.1080/19490976.2017.1349041. Epub 2017 Aug 3. Gut Microbes. 2017. PMID: 28696139 Free PMC article. Review.
-
Gut Microbiota in Multiple Sclerosis and Experimental Autoimmune Encephalomyelitis: Current Applications and Future Perspectives.Mediators Inflamm. 2018 Apr 2;2018:8168717. doi: 10.1155/2018/8168717. eCollection 2018. Mediators Inflamm. 2018. PMID: 29805314 Free PMC article. Review.
Cited by
-
Lactobacillaceae differentially impact butyrate-producing gut microbiota to drive CNS autoimmunity.Gut Microbes. 2024 Jan-Dec;16(1):2418415. doi: 10.1080/19490976.2024.2418415. Epub 2024 Oct 27. Gut Microbes. 2024. PMID: 39462277 Free PMC article.
-
The Potential Role of Boron in the Modulation of Gut Microbiota Composition: An In Vivo Pilot Study.Pharmaceuticals (Basel). 2024 Oct 6;17(10):1334. doi: 10.3390/ph17101334. Pharmaceuticals (Basel). 2024. PMID: 39458975 Free PMC article.
-
The Association of the Oral Microbiota with Cognitive Functioning in Adolescence.Genes (Basel). 2024 Sep 27;15(10):1263. doi: 10.3390/genes15101263. Genes (Basel). 2024. PMID: 39457387 Free PMC article.
-
Review of evidence linking exposure to environmental stressors and associated alterations in the dynamics of immunosenescence (ISC) with the global increase in multiple sclerosis (MS).Immun Ageing. 2024 Oct 22;21(1):73. doi: 10.1186/s12979-024-00473-w. Immun Ageing. 2024. PMID: 39438909 Free PMC article. Review.
-
Mycobacterium avium subspecies paratuberculosis (MAP) infection, and its impact on gut microbiome of individuals with multiple sclerosis.Sci Rep. 2024 Oct 14;14(1):24027. doi: 10.1038/s41598-024-74975-4. Sci Rep. 2024. PMID: 39402079 Free PMC article.
References
-
- Sospedra M. & Martin R. Immunology of multiple sclerosis. Annu Rev Immunol 23, 683–747 (2005). - PubMed
-
- Ascherio A. Environmental factors in multiple sclerosis. Expert Rev Neurother 13, 3–9 (2013). - PubMed
-
- Oksenberg J. R. Decoding multiple sclerosis: an update on genomics and future directions. Expert Rev Neurother 13, 11–19 (2013). - PubMed
-
- Fleming J. & Fabry Z. The hygiene hypothesis and multiple sclerosis. Annals of neurology 61, 85–89 (2007). - PubMed
-
- Rook G. A. Hygiene hypothesis and autoimmune diseases. Clinical reviews in allergy & immunology 42, 5–15 (2012). - PubMed
Publication types
MeSH terms
Substances
LinkOut - more resources
Full Text Sources
Other Literature Sources
Medical

