. 2016 Aug 4;19(2):266-277.
doi: 10.1016/j.stem.2016.05.010. Epub 2016 Jun 23.

De Novo Prediction of Stem Cell Identity using Single-Cell Transcriptome Data

Affiliations

De Novo Prediction of Stem Cell Identity using Single-Cell Transcriptome Data

Dominic Grün et al. Cell Stem Cell. .

Abstract

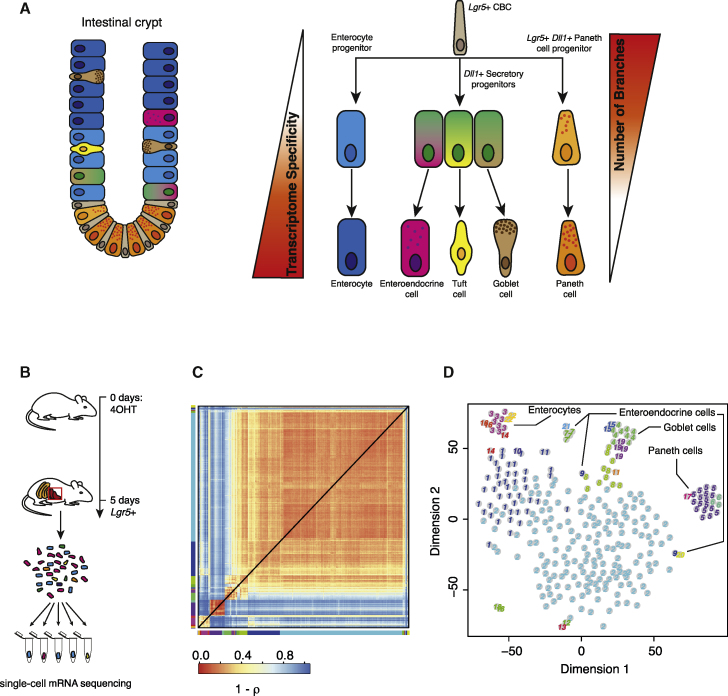
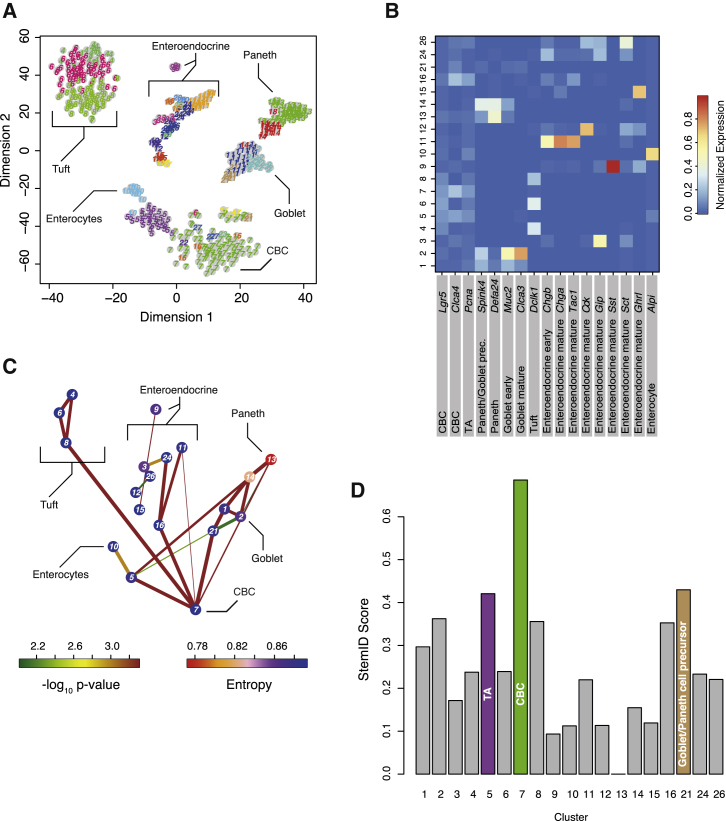
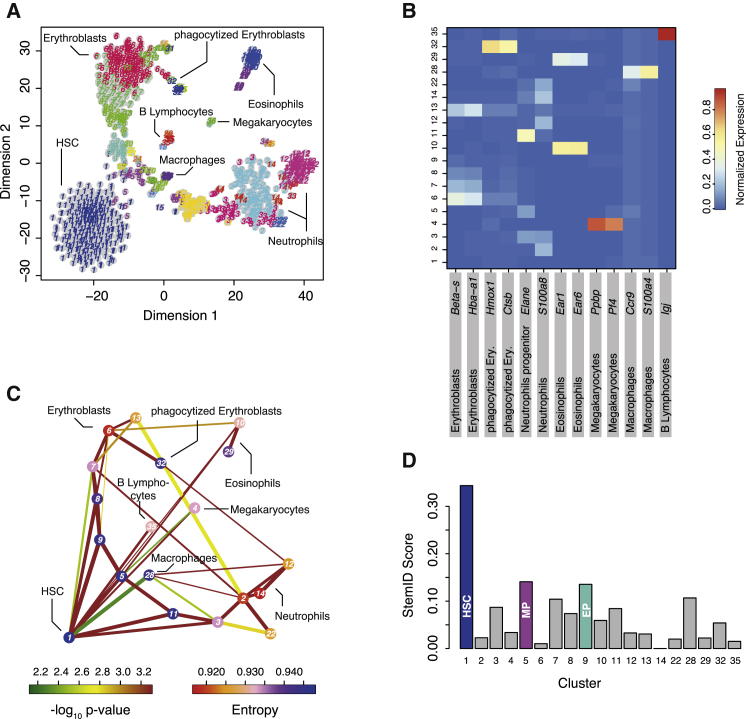
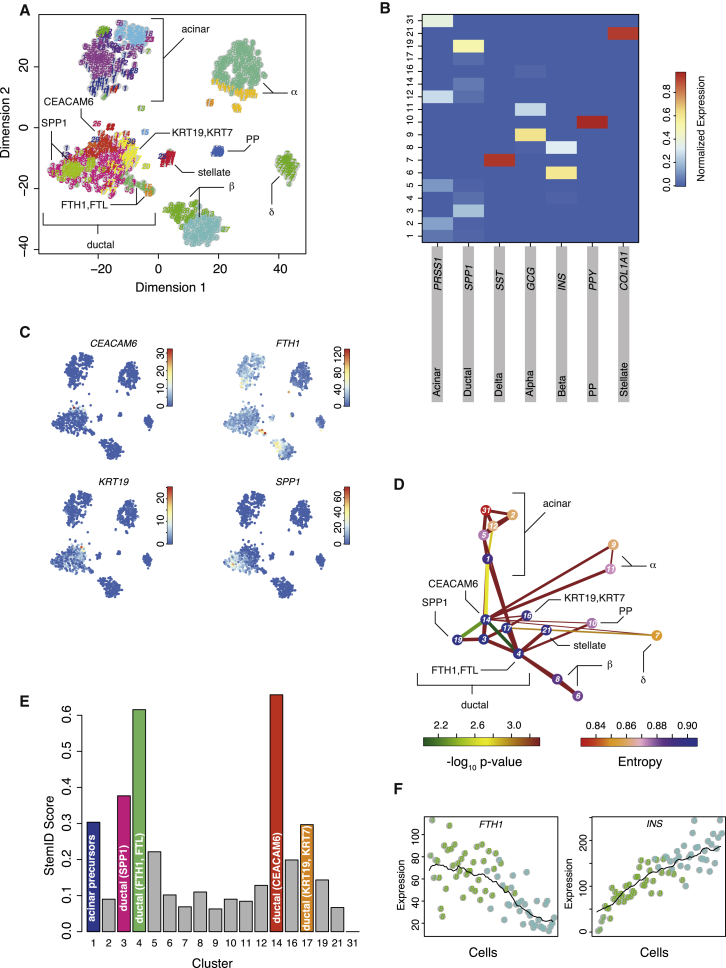
Adult mitotic tissues like the intestine, skin, and blood undergo constant turnover throughout the life of an organism. Knowing the identity of the stem cell is crucial to understanding tissue homeostasis and its aberrations upon disease. Here we present a computational method for the derivation of a lineage tree from single-cell transcriptome data. By exploiting the tree topology and the transcriptome composition, we establish StemID, an algorithm for identifying stem cells among all detectable cell types within a population. We demonstrate that StemID recovers two known adult stem cell populations, Lgr5+ cells in the small intestine and hematopoietic stem cells in the bone marrow. We apply StemID to predict candidate multipotent cell populations in the human pancreas, a tissue with largely uncharacterized turnover dynamics. We hope that StemID will accelerate the search for novel stem cells by providing concrete markers for biological follow-up and validation.


Figures

None
Graphical abstract
Figure 1
Figure 1
RaceID2 Recovers Intestinal Cell Types (A) The intestinal epithelium is a well characterized differentiation system. Lgr5-positive stem cells give rise to secretory and absorptive precursors by WNT and NOTCH signaling that further differentiate into mature intestinal cell types. (B) Summary of the lineage-tracing experiment performed to sequence single 5-day-old progeny of Lgr5-positive cells. (C) Heatmap of cell-to-cell transcriptome distances measured by 1 – Pearson’s correlation coefficient (ρ). RaceID2 clusters are color-coded along the boundaries. (D) t-distributed stochastic neighbor embedding (t-SNE) map representation of transcriptome similarities between individual cells. The clusters identified in (C) are highlighted with different numbers and colors, and the corresponding intestinal cell types identified based on known marker genes are indicated. See also Figure S1.
Figure 2
Figure 2
Lineage Tree Inference for Intestinal Stem Cell Progeny (A) Schematic of the method used to infer differentiation trajectories (see main text and Experimental Procedures). (B) Outline of the method visualized in the t-SNE-embedded space. All RaceID2 clusters with more than two cells (top) are connected by links, and, for each cell, the link with the maximum projection is determined as shown in (A). Only populated links are shown (center). Cluster centers are circled in black. Significant links are inferred by comparison with the background distribution with randomized cell positions (Experimental Procedures). Only significant links are shown (p < 0.01). The color of the link indicates the −log10p value. The color of the vertices indicates the entropy. The thickness indicates the link score, reflecting how densely a link is covered with cells (Experimental Procedures). (C) Transcript counts (color legend) of the intestinal stem cell markers Lgr5, Clca4, and Ascl2 are highlighted in the t-SNE map. Expression of these genes is restricted to cluster 2 and clusters 5 and 6. Clusters 5 and 6 comprise Paneth cells, which were shown to co-express Lgr5 (Grün et al., 2015). Accumulated transcript counts across all Defensin genes, which are markers of Paneth cells, are shown at the bottom right. (D) Barplot of StemID scores for all clusters. The median transcriptome entropy of each cell type was computed across all cells in a cluster (left). The lowest entropy across all cell types was subtracted for each cell types because absolute differences were only small. This Δentropy was multiplied by the number of significant links for each cluster (center), yielding the StemID score (right). See also Figure S2.
Figure 3
Figure 3
StemID Identifies Stem Cells in Complex with Non-random Mixtures of Intestinal Cells (A) t-SNE map of transcriptome similarities of intestinal cells from a variety of single-cell mRNA sequencing experiments (main text and Figure S3). RaceID2 clusters are highlighted with different numbers and colors. Cell types identified based on marker gene expression are shown. (B) Heatmap showing the average expression of known cell type markers across all clusters with more than five cells. For each gene, the sum of expression values over all clusters is normalized to one. (C) Inferred intestinal lineage tree. Only significant links are shown (p < 0.01). The color of the link indicates the −log10 p value. The color of the vertices indicates the entropy. The thickness indicates the link score, reflecting how densely a link is covered with cells (Experimental Procedures). (D) Barplot of StemID scores for intestinal clusters. In (B)–(D), only clusters with more than five cells were analyzed. See also Figures S3, S6, and S7.
Figure 4
Figure 4
StemID Identifies Hematopoietic Stem Cells in Non-random Mixtures of Bone Marrow Cells (A) t-SNE map of transcriptome similarities of hematopoietic cells sampled from physically interacting doublets or multiplets (main text and Figure S4). RaceID2 clusters are highlighted with different numbers and colors. Cell types identified based on marker gene expression are shown. (B) Heatmap showing the average expression of known cell type markers across all clusters with more than five cells. For each gene, the sum of expression values over all clusters is normalized to one. (C) Inferred hematopoietic lineage tree. Only significant links are shown (p < 0.01). The color of the link indicates the −log10 p value. The color of the vertices indicates the entropy. The thickness indicates the link score, reflecting how densely a link is covered with cells (Experimental Procedures). (D) Barplot of StemID scores for hematopoietic clusters. MP, myeloid progenitor; EP, erythroblast progenitor. See also Figures S4, S6, and S7.
Figure 5
Figure 5
The Multipotency of HSCs Is Reflected by High Transcriptome Entropy (A) Boxplot of the transcriptome entropy for all RaceID2-derived bone marrow cell types with more than five cells. The boundaries of the box represent the 25% and 75% quantiles, the thick line corresponds to the median, and whiskers extend to the 5% and 95% quantiles. The broken red line indicated the 25% quantile for HSCs (cluster 1). (B) Two-dimensional clustering of lineage markers in all HSCs (cluster 1). The heatmap shows logarithmic expression. (C) Self-organizing map (SOM) of Z-score-transformed, pseudo-temporal expression profiles along the neutrophil differentiation trajectory (clusters 1, 11, 3, 2, and 12), indicated by the red arrow superimposed on the lineage tree (Experimental Procedures). The pseudo-temporal order was inferred from the projection coordinates of all cells. The color-coding on the left indicates the cluster of origin. The SOM identified five different modules of co-regulated genes. Examples are shown at the bottom. The clusters of origin are indicated as colors and numbers. The black line represents a moving average (window size 25). In (A)–(C), only clusters with more than five cells were analyzed.
Figure 6
Figure 6
StemID Predicts Human Pancreatic Pluripotent Cells (A) t-SNE map of transcriptome similarities of human pancreatic cells. RaceID2 clusters are highlighted with different numbers and colors. Cell types identified based on marker gene expression are shown. For ductal cells, marker genes of sub-populations are shown. (B) Heatmap showing the average expression of known cell type markers across all clusters with more than five cells. For each gene, the sum of expression values over all clusters is normalized to one. (C) Transcript counts (color legend) of the ductal sub-type markers CEACAM6, FTH1, KRT19, and SPP1 are highlighted in the t-SNE map. (D) Inferred pancreatic lineage tree. Only significant links are shown (p < 0.01). The color of the link indicates the −log10 p value. The color of the vertices indicates the entropy. The thickness indicates the link score reflecting how densely a link is covered with cells (Experimental Procedures). (E) Barplot of StemID scores for pancreatic clusters. (F) Pseudo-temporal expression profiles for INS and FTH1. The transcript count is plotted for cells on the link, connecting clusters 4, 8, and 6. Cells are ordered by the projection coordinate. In (B), (D), and (E), only clusters with more than five cells were analyzed. See also Figure S5.
Figure 7
Figure 7
Validation of Putative Endocrine Precursor Cells in Ductal Subpopulations by Antibody Staining (A and B) Antibody staining for INS and FTH1 in human pancreatic showing a single cell positive for INS and FTH1 residing in the lining of the duct (arrow). (B) Antibody staining for INS, FTH1, and GCG in human pancreatic tissue. Shown is a single cell positive for INS and FTH1 residing in the lining of the duct (arrow) next to a GCG-expressing cell (arrowhead). Another GCG-expressing cell is found nearby (arrowhead). Both GCG-expressing cells are FTH1-negative.

Similar articles

Cited by

References

    1. Anavy L., Levin M., Khair S., Nakanishi N., Fernandez-Valverde S.L., Degnan B.M., Yanai I. BLIND ordering of large-scale transcriptomic developmental timecourses. Development. 2014;141:1161–1166. - PubMed
    1. Banerji C.R.S., Miranda-Saavedra D., Severini S., Widschwendter M., Enver T., Zhou J.X., Teschendorff A.E. Cellular network entropy as the energy potential in Waddington’s differentiation landscape. Sci. Rep. 2013;3:3039. - PMC - PubMed
    1. Barker N. Adult intestinal stem cells: critical drivers of epithelial homeostasis and regeneration. Nat. Rev. Mol. Cell Biol. 2014;15:19–33. - PubMed
    1. Barker N., van Es J.H., Kuipers J., Kujala P., van den Born M., Cozijnsen M., Haegebarth A., Korving J., Begthel H., Peters P.J., Clevers H. Identification of stem cells in small intestine and colon by marker gene Lgr5. Nature. 2007;449:1003–1007. - PubMed
    1. Bendall S.C., Davis K.L., Amir A.D., Tadmor M.D., Simonds E.F., Chen T.J., Shenfeld D.K., Nolan G.P., Pe’er D. Single-cell trajectory detection uncovers progression and regulatory coordination in human B cell development. Cell. 2014;157:714–725. - PMC - PubMed

Publication types

MeSH terms