. 2016 Jul 11;30(1):92-107.
doi: 10.1016/j.ccell.2016.05.008. Epub 2016 Jun 23.

Epigenetic Perturbations by Arg882-Mutated DNMT3A Potentiate Aberrant Stem Cell Gene-Expression Program and Acute Leukemia Development

Affiliations

Epigenetic Perturbations by Arg882-Mutated DNMT3A Potentiate Aberrant Stem Cell Gene-Expression Program and Acute Leukemia Development

Rui Lu et al. Cancer Cell. .

Abstract

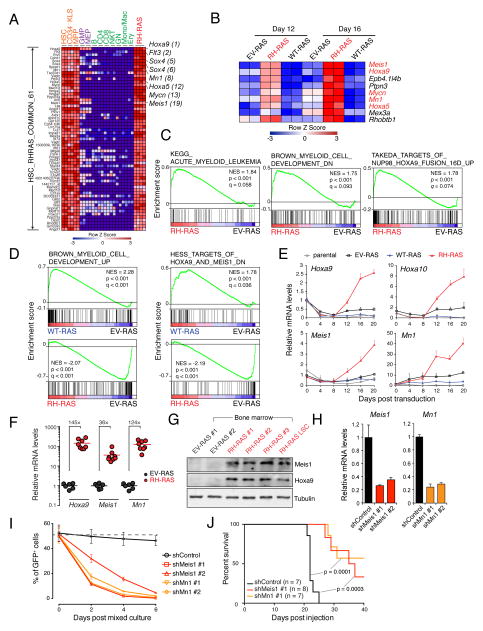
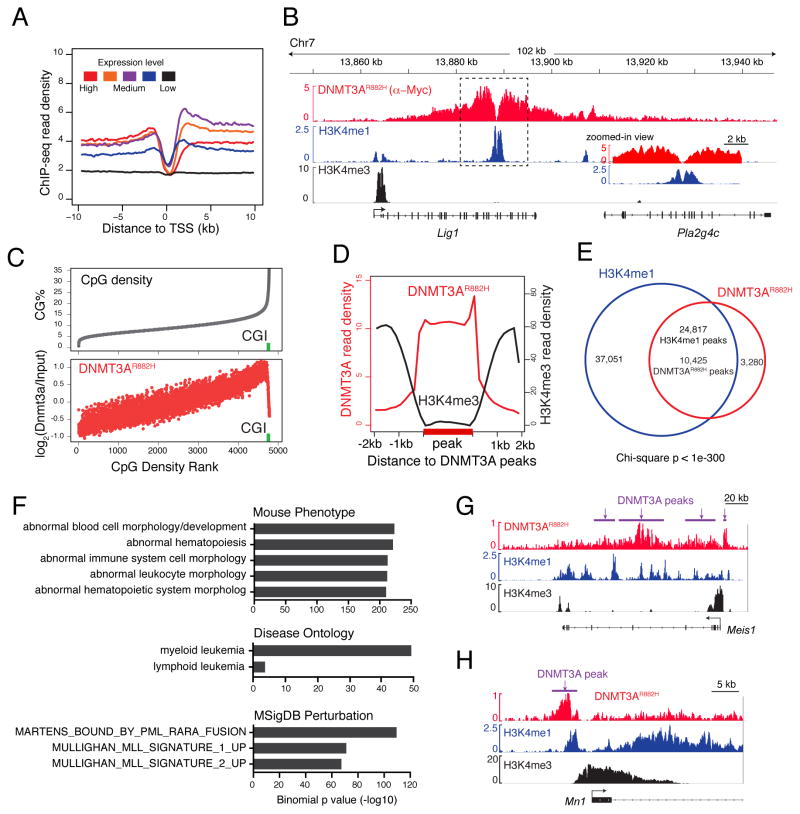
DNA methyltransferase 3A (DNMT3A) is frequently mutated in hematological cancers; however, the underlying oncogenic mechanism remains elusive. Here, we report that the DNMT3A mutational hotspot at Arg882 (DNMT3A(R882H)) cooperates with NRAS mutation to transform hematopoietic stem/progenitor cells and induce acute leukemia development. Mechanistically, DNMT3A(R882H) directly binds to and potentiates transactivation of stemness genes critical for leukemogenicity including Meis1, Mn1, and Hoxa gene cluster. DNMT3A(R882H) induces focal epigenetic alterations, including CpG hypomethylation and concurrent gain of active histone modifications, at cis-regulatory elements such as enhancers to facilitate gene transcription. CRISPR/Cas9-mediated ablation of a putative Meis1 enhancer carrying DNMT3A(R882H)-induced DNA hypomethylation impairs Meis1 expression. Importantly, DNMT3A(R882H)-induced gene-expression programs can be repressed through Dot1l inhibition, providing an attractive therapeutic strategy for DNMT3A-mutated leukemias.


Figures

Figure 1
Figure 1. DNMT3AR882H acts in concert with mutant RAS to transform murine HSPCs ex vivo and induce AMLs in vivo
(A) Colony-forming unit (CFU) assay using murine HSPCs expressing empty control (EV), wild-type (WT) or R882H mutant (RH) DNMT3A in combination with GFP or NRASG12D (RAS) Insert, a typical colony expressing RH-RAS at the 4th replating. Scale bar, 1 mm. (B) Images of CFU assay at the 4th replating. (C) Immunoblot of DNMT3A (Myc-tagged) and NRAS (Flag-tagged) in HSPCs post-infection. (D) Microscopic image and Wright-Giemsa staining of RH-RAS-coexpressing cells derived from the 4th replating after long-term culture with the SCF cytokine in vitro. Scale bar, 10 μm. (E) Kaplan-Meier survival curve of mice after bone marrow transplantation (BMT) of HSPCs freshly transduced with indicated genes. The p values were calculated by log-rank test. (F–G) Spleen size (panel F, n = 3) and weight (panel G, n = 4–7) of indicated cohorts 3–4 weeks post-BMT. The p values were calculated by Student’s t-test. (H) Wright–Giemsa staining of bone marrow (upper) and H&E staining of spleen (bottom) of indicated cohorts 4 weeks post-BMT. Scale bar, 10 μm (upper) and 200 μm (bottom). (I) White blood cell (WBC) counts in peripheral blood of indicated cohorts (n = 6–13) 4 weeks post-BMT. The p values were calculated by Student’s t-test. (J) Immunoblot of DNMT3A (Myc) and NRAS (Flag) proteins in bone marrow (BM) and spleen (SP) cells from mice with leukemia induced by RH-RAS coexpression. The first 2 lanes were loaded with samples of in vitro infected HSPCs. (K) FACS analysis of Mac-1 and c-Kit with bone marrow and spleen cells of indicated cohorts 4 weeks post-BMT. Error bar, +/− SD; ***, p < 0.001; ****, p < 0.0001. See also Figure S1 and Table S1.
Figure 2
Figure 2. R882-mutated DNMT3A establishes leukemia-initiating stem cells (LSCs) ex vivo in the presence of activated RAS
(A) FACS analysis of in vitro immortalized progenitors by RH-RAS using a liquid culture system. (B) Wright–Giemsa staining (upper) and FACS analysis of RH-RAS-immortalized progenitors 14 days post-cultivation with indicated cytokines. FACS control, non-specific IgG (grey, open); Scale bar, 10 μm. (C) Kaplan-Meier curve of mice receiving primary or secondary BMT with RH-RAS induced leukemia. (D) Kaplan-Meier curve of mice (n = 5–6) receiving BMT of the indicated numbers of RH-RAS immortalized cells. (E) Hierarchical clustering of genome-wide H3K4me1 profiles of LSCsRH-RAS, AML-causing LSC lines produced by overexpressed HOXA9 plus MEIS1 (HOXA9-MEIS1), and various normal blood cell types. LT-HSC, long-term HSC; ST-HSC, short-term HSC; MPP, multipotent progenitor; CMP, common myeloid progenitor; CLP, common lymphoid progenitor; GMP, granulocyte-monocyte progenitor; MEP, megakaryocyte-erythroid progenitor; Mac, macrophage; Mono, monocyte; GN, granulocyte; B, B220+/CD19+ B-cell; CD4/8, CD4/8+ T-cell; NK, natural killer cell; EryA and EryB, Ter119+/CD71+ erythroid cell with high and low forward scatter, respectively. (F) Principal component (PC) analysis of transcriptome profiles of LSCsRH-RAS and various normal blood cell types. Besides what is described in panel E, CD34KLS, Cd34/c-Kit+/Lin/ScaI+ HSC; MPP1, Flk2 multipotent progenitor; MPP2, Flk2+ multipotent progenitor; NKT, natural killer T-cell; Ery, erythroid cell. See also Figure S2.
Figure 3
Figure 3. DNMT3AR882H potentiates aberrant activation of stemness genes including a critical Meis1-Mn1-Hoxa regulatory node
(A) Heatmap of 61 probes (54 genes) showing unique expression in both self-renewing HSPCs (HSC, Cd34KLS and MPP) and LSCsRH-RAS but not in differentiating (purple) or mature (green) blood cell types. Probes are ranked by higher expression in LSCsRH-RAS relative to differentiating and mature cells. Example genes are highlighted along with their respective rankings. (B) Of the 54 self-renewal genes, genes showing consistently higher expression in HSPCs 12 and 16 days post-transduction of RH-RAS relative to EV-RAS. (C) GSEA shows enrichment of AML-associated genes (left), genes downregulated upon myeloid differentiation (middle) and NUP98-HOXA9 targets (right) in HSPCs with RH-RAS versus EV-RAS. (D) GSEA shows enrichment of differentiation gene sets in WT-RAS or RH-RAS HSPCs relative to EV-RAS. Left, myeloid differentiation genes; right, genes downregulated upon activation of HOXA9 and MEIS1. (E) RT-qPCR of indicated genes in murine HSPCs post-transduction of EV-RAS, WT-RAS or RH-RAS. (F) RT-qPCR of indicated genes in mouse bone marrow 21 days post-BMT of HSPCs with EV-RAS (n = 6) or RH-RAS (n = 8). (G) Immunoblot of Meis1 and Hoxa9 in bone marrow of mice 21 days post-BMT of HSPCs with EV-RAS or RH-RAS. The last lane was loaded with LSCRH-RAS samples. (H) RT-qPCR showing shRNA-mediated Meis1 or Mn1 knockdown in LSCsRH-RAS. (I) Relative proliferation of indicated shRNA-expressing LSCsRH-RAS (GFP+) versus parental cells (GFP). These GFP and GFP+ cells were mixed in a 1:1 ratio at day 0, followed by measurement of % of GFP+ cells. (J) Kaplan-Meier curve of mice engrafted with indicated shRNA-expressing LSCsRH-RAS. The p values were calculated by log-rank test. Error bar, +/− SD. See also Figure S3 and Table S2.
Figure 4
Figure 4. ChIP-Seq reveals chromatin context-dependent binding of R882-mutated DNMT3A to genomic regions, including stemness genes such as a Meis1-Mn1-Hoxa node
(A) DNMT3AR882H ChIP-Seq profiles across transcription start site (TSS) of genes with different expression levels in LSCsRH-RAS. (B) Example ChIP-Seq profiles for DNMT3AR882H, H3K4me1 and H3K4me3 at the Lig1 gene. Box, a zoomed-in view of dashed box region showing overlap of DNMT3AR882H and H3K4me1 peaks. (C) Correlation of DNMT3AR882H binding and CpG density. Shown is % of CpG density (grey) and DNMT3AR882H ChIP-Seq reads (red) at 1-kb windows of the entire genome ranked by CpG density. Green square, CpG island (CGI). (D) Plot of averaged DNMT3AR882H (red) and H3K4me3 (black) ChIP-Seq signals at DNMT3AR882H peaks (labeled in bold on x-axis) and surrounding regions (+/−2 kb). (E) Venn diagram shows significant overlap of DNMT3AR882H and H3K4me1 peaks in LSCsRH-RAS. (F) Genomic Regions Enrichment of Annotations Tool (GREAT) analysis shows enrichment of indicated gene signatures among DNMT3AR882H peaks. (G–H) ChIP-Seq profiles of DNMT3AR882H, H3K4me1 and H3K4me3 at Meis1 (panel G) and Mn1 (panel H). Purple bars, DNMT3AR882H peak calls. See also Figure S4 and Table S3.
Figure 5
Figure 5. DNMT3AR882H induces focal CpG hypomethylations enriched at H3K4me1-demarcated, gene-regulatory sites in HSPCs
(A) Distribution of DMCs in the genome of murine HSPCs transduced with RH-RAS or WT-RAS, relative to EV-RAS. (B) Heatmap showing enrichment of DNMT3AR882H-associated DMCs at indicated genomic regions or ChIP-Seq peaks in comparison to genome average. The enrichment value was calculated as log2(observed/expected) of the DMC numbers. CGI, CpG island; CGS, CpG shore. (C) Distribution of DNMT3AR882H-associated DMCs across DNMT3AR882H ChIP-Seq peaks (shown in a bold bar on x-axis). Y-axis shows % of DMCs located at 100-bp window of genomic regions centered on DNMT3AR882H peaks. (D) Enrichment of indicated TF binding motifs in DNMT3AR882H-associated hypo-DMCs and hyper-DMCs. (E) Summary of DMRs identified in the HSPCs with RH-RAS or WT-RAS, relative to EV-RAS. (F) Venn diagram showing overlap of DNMT3AR882H and DNMT3AWT-associated DMRs. (G) GREAT annotation of DNMT3AR882H-associated hypo-DMRs. (H) H3K4me1 profiles at DNMT3AR882H-associated hypo-DMRs, hyper-DMRs, and random control regions. Plotted across DMRs (labeled in a bold line on x-axis) were averaged H3K4me1 ChIP-Seq read densities in EV-RAS cells. (I) Scatter plots showing methylation changes of selected CpGs in human AMLs with DNMT3A R882 mutation relative to DNMT3A WT AMLs. Mean methylation differences (y-axis) and p value (x-axis) for each CpG between two AML patient groups were plotted. Left, CpGs in the human genome homologous to DNMT3AR882H-associated hypo-DMRs identified in murine HSPCs; right, randomly picked CpG controls. (J) DNA methylation profiles of Meis1 in indicated murine HSPCs and MEIS1 in human AMLs with WT (n = 50) or R882-mutated (n = 20) DNMT3A. Faded points show individual CpG methylation beta values and connected lines indicate the mean methylation levels at each CpG site. Grey box, a hypo-DMR in intron 6. (K) Bisulfite sequencing of the Meis1 intron 6 DMR in indicated murine HSPC samples. (L) Box plots of methylation beta values of all CpGs (shown as dots in boxplot) at MEIS1 intron 6 in human AMLs with R882-mutated DNMT3A (n = 20) relative to AMLs with either non-R882 mutated (n = 15) or WT (n = 50) DNMT3A. Horizontal line, median; box, interquartile range; whiskers extend to 1.5× the interquartile range. The p values were calculated by Mann-Whitney U test. See also Figure S5 and Table S4 and S5.
Figure 6
Figure 6. DNMT3AR882H-associated hypo-DMRs gain epigenetic alterations associated with gene activation
(A–B) H3K27ac (panel A) and H3K4me1 (panel B) profiles at DNMT3AR882H-associated DMRs (bold on x-axis) and the surrounding regions. Averaged ChIP-Seq read densities in HSPCs with EV-RAS, RH-RAS or WT-RAS were plotted. (C) H3K27ac and H3K4me1 profiles at Meis1 intron 6 in indicated HSPCs. Green bar, hypo-DMR. (D–E) ChIP-qPCR of H3K27ac (panel D) and p300 binding (panel E) at hypo-DMRs in indicated HSPCs. (F) Percentage of DNMT3AR882H-associated hypo-DMRs showing indicated H3K27ac changes in HSPCs with RH-RAS versus EV-RAS. Gain, increased H3K27ac; Loss, reduced H3K27ac; NC, no significant H3K27ac change. The total DMRs used for calculation were hypo-DMRs carrying H3K27ac (left) or H3K4me1 (right) in at least one cell condition. (G) Percentage of DNMT3AR882H-associated hypo-DMRs (n = 1,199) showing H3K27ac gain in HSPCs with RH-RAS versus EV-RAS, when these hypo-DMRs are divided based on degree of DNA methylation reduction (x-axis) shown in the same samples. (H) GSEA shows that genes with gain of H3K27ac at hypo-DMRs are enriched in HSPCs 16 days post-transduction of RH-RAS, relative to EV-RAS. (I) Heatmap shows expression of genes in panel H ranked by higher expression in HSPCs with RH-RAS, relative to EV-RAS. The significantly upregulated genes in RH-RAS HSPCs are defined as “DNMT3AR882H signature genes” (n = 57), with selected ones listed along with their respective rankings (bottom). (J) Quantification of expression-enhancing activity of DNMT3AR882H-associated hypo-DMRs with the embedded CpGs either non-methylated (CpG) or methylated (mCpG) using a CpG-free luciferase reporter system. The reporter without any DMR insertion was used as control. The p values were calculated by Student’s t-test. (K) 3C assay shows looping interaction of the Meis1 intron 6 hypo-DMR (P4) to gene promoter (P0), relative to other tested sites. (L–M) Scheme (panel L) and PCR validation (panel M) of CRISPR/Cas9-mediated deletion of the Meis1 intron 6 DMR. MOCK, parental LSCRH-RAS; Control, no sgRNA; sgMeis1, a pair of sgRNAs that target the DMR boundaries. (N) Sequencing of the genomic PCR products from F2/R2 primers shows CRISPR/Cas9-induced deletion of the Meis1 intron 6 DMR. (O) Expression levels of Meis1 in LSCRH-RAS lines shown in panel M. The p values were calculated by Student’s t-test by comparing to MOCK. (P) Impact of DNA methylation levels in MEIS1 intron 6 in cytogenetically normal human AMLs grouped by DNMT3A WT (n = 45), non-R882 (n = 13) and R882 mutations (n =16). Plotted were mean methylation beta values of CpGs at MEIS1 intron 6 and log2-transformed expression values of RNA-Seq by Expectation-Maximization (RSEM). R2 and p values shown were determined with data of R882-mutant AMLs. Error bar, +/− SD; **, p < 0.01; ***, p < 0.001; NS, not significant. See also Figure S6 and Table S4 and S6.
Figure 7
Figure 7. Dot1l inhibition reverses DNMT3AR882H-mediated aberrant transactivation of stem cell genes, thereby suppressing acute leukemogenicity
(A) Averaged H3K79me2 ChIP-Seq signals at DNMT3AR882H-associated hypo-DMRs and hyper-DMRs in HSPCs with RH-RAS or EV-RAS. (B) H3K79me2 profiles at Meis1 and Hoxa in indicated HSPCs. (C) GSEA shows downregulation of DNMT3AR882H signature genes in LSCsRH-RAS post-treatment with 1 μM SGC0946 for 4 days. (D) Heatmap shows downregulation of DNMT3AR882H signature genes and upregulation of myeloid differentiation genes in SGC0946-treated LSCsRH-RAS versus mock-treated. (E) Boxplots show relative expression of DNMT3A signature genes (n = 54), MLL-AF9 gene targets (n = 129) and all genes in the genome in SGC0946-treated LSCsRH-RAS, relative to mock-treated. Horizontal line, median; box, interquartile range; whiskers, 10 to 90 percentiles. The p values were calculated by Mann-Whitney U test. (F–G) RT-qPCR (panel F) and immunoblot (panel G) of indicated genes and proteins in LSCsRH-RAS 6 days post-treatment with SGC0946. (H) Expression of indicated genes in LSCsRH-RAS transduced with Dot1l shRNAs or vector control. (I) Relative growth of LSCsRH-RAS and other AML lines established by MLL-AF9, Hoxa9 plus Meis1 (A9M), A9M plus NRASG12D (A9M-RAS), and Hoxb8 plus Meis2 (WEHI3B) after a 12-day treatment with SGC0946 versus DMSO. (J–K) Wright–Giemsa staining (panel J) and FACS analysis (panel K) of LSCsRH-RAS 6 days post-treatment with DMSO or 1 μM SGC0946. Scale bar, 10 μm. (L) Effect of SGC0946 on growth of LSCsRH-RAS transduced with vector or Hoxa9 plus Meis1 (A9M). Relative proliferation was normalized to DMSO-treated cells. (M) Survival of mice engrafted with LSCsRH-RAS, either mock-treated, stably transduced with a Dot1l shRNA, or pre-treated with 1 μM SGC0946 ex vivo for 6 days. The p values were calculated by log-rank test. Error bar, +/− SD. See also Figure S7 and Table S6.

Comment in

Similar articles

Cited by

References

    1. Abramovich C, Pineault N, Ohta H, Humphries RK. Hox genes: from leukemia to hematopoietic stem cell expansion. Annals of the New York Academy of Sciences. 2005;1044:109–116. - PubMed
    1. Argiropoulos B, Humphries RK. Hox genes in hematopoiesis and leukemogenesis. Oncogene. 2007;26:6766–6776. - PubMed
    1. Baubec T, Schubeler D. Genomic patterns and context specific interpretation of DNA methylation. Current opinion in genetics & development. 2014;25:85–92. - PubMed
    1. Bernt KM, Zhu N, Sinha AU, Vempati S, Faber J, Krivtsov AV, Feng Z, Punt N, Daigle A, Bullinger L, et al. MLL-rearranged leukemia is dependent on aberrant H3K79 methylation by DOT1L. Cancer cell. 2011;20:66–78. - PMC - PubMed
    1. Campisi J, d’Adda di Fagagna F. Cellular senescence: when bad things happen to good cells. Nat Rev Mol Cell Biol. 2007;8:729–740. - PubMed

Publication types

MeSH terms