. 2016 Jul:9:45-60.
doi: 10.1016/j.ebiom.2016.05.028. Epub 2016 May 26.

Retromer in Osteoblasts Interacts With Protein Phosphatase 1 Regulator Subunit 14C, Terminates Parathyroid Hormone's Signaling, and Promotes Its Catabolic Response

Affiliations

Retromer in Osteoblasts Interacts With Protein Phosphatase 1 Regulator Subunit 14C, Terminates Parathyroid Hormone's Signaling, and Promotes Its Catabolic Response

Lei Xiong et al. EBioMedicine. 2016 Jul.

Abstract

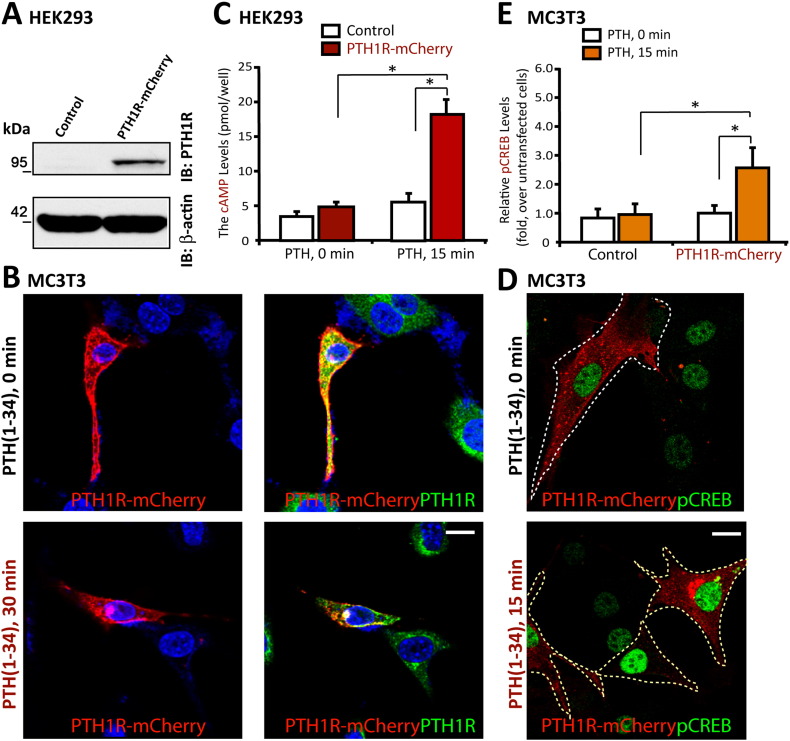
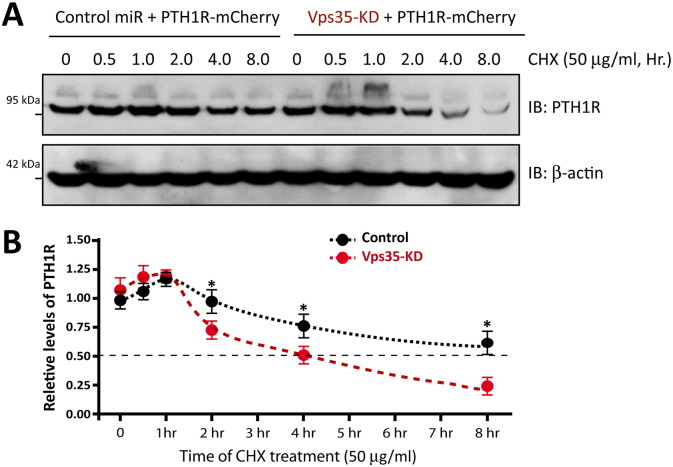
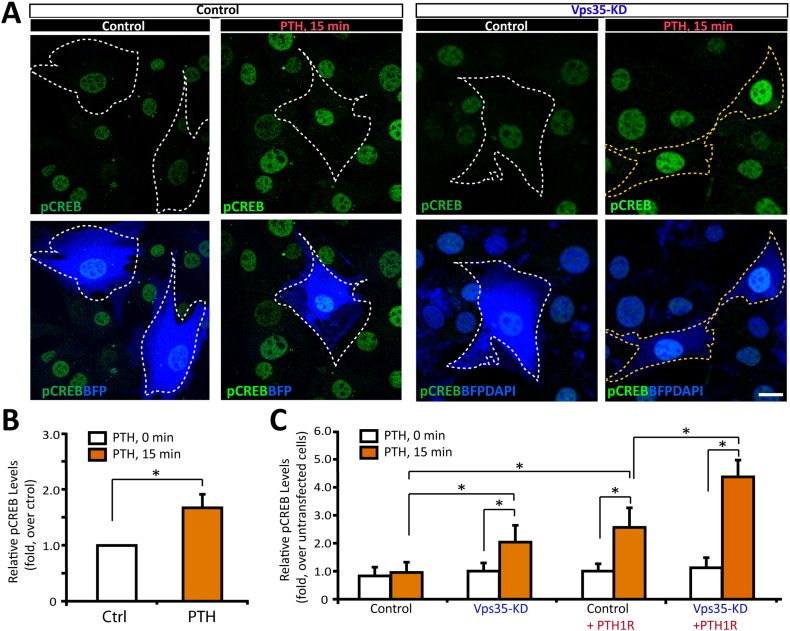
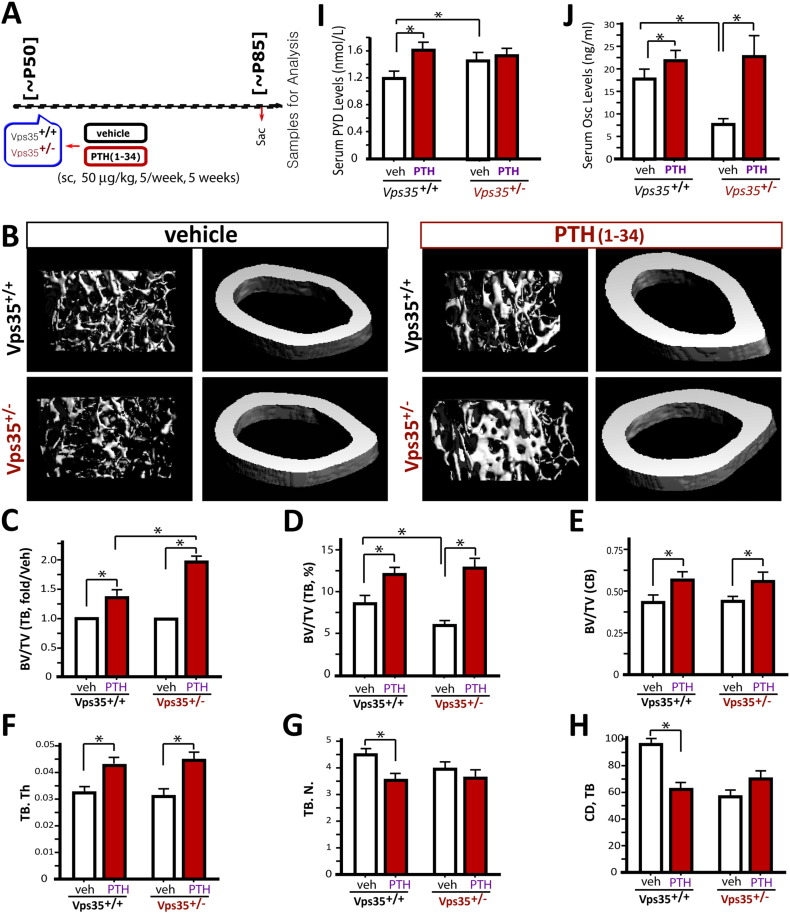
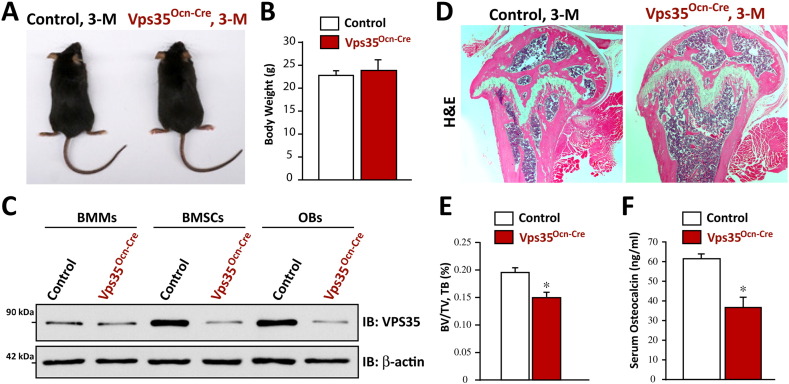
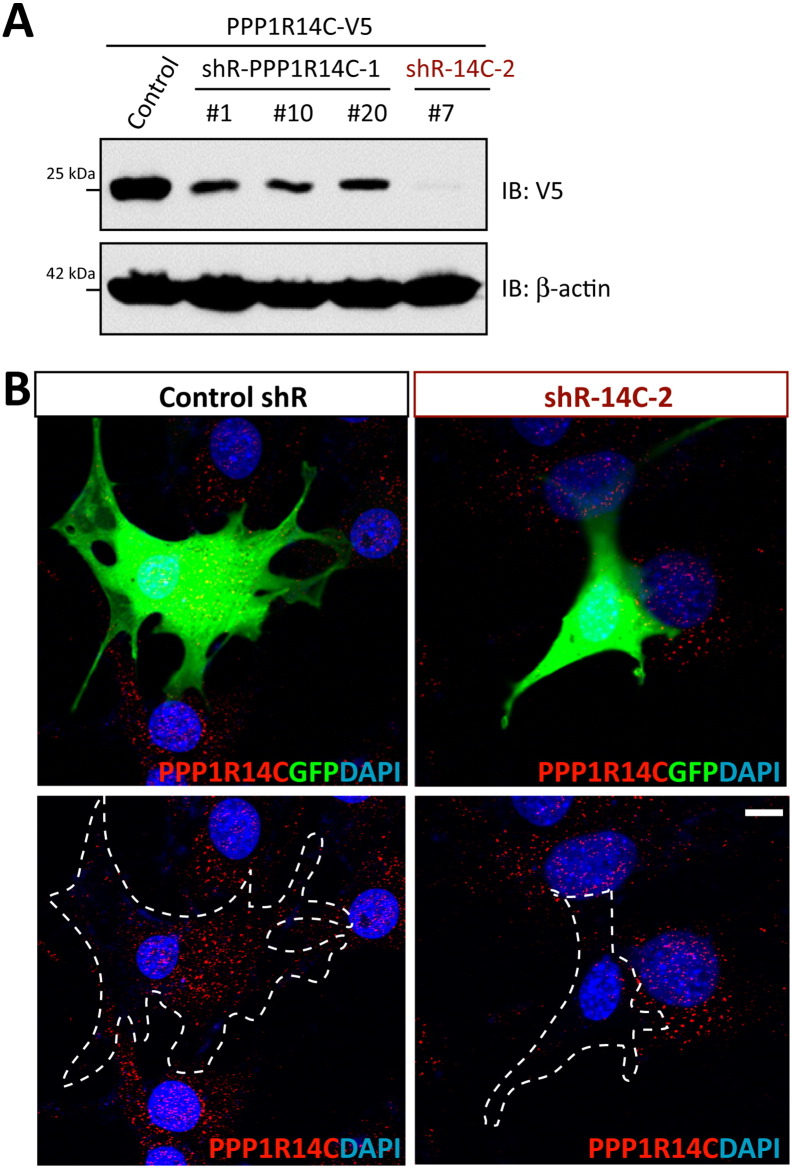
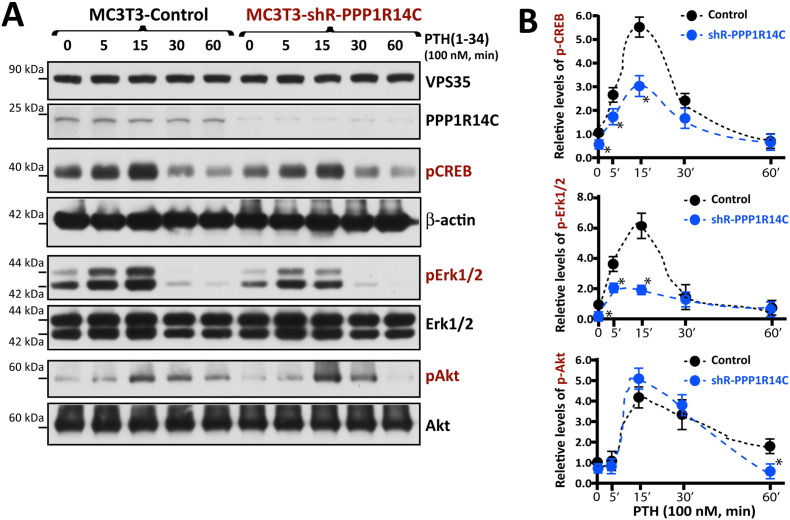
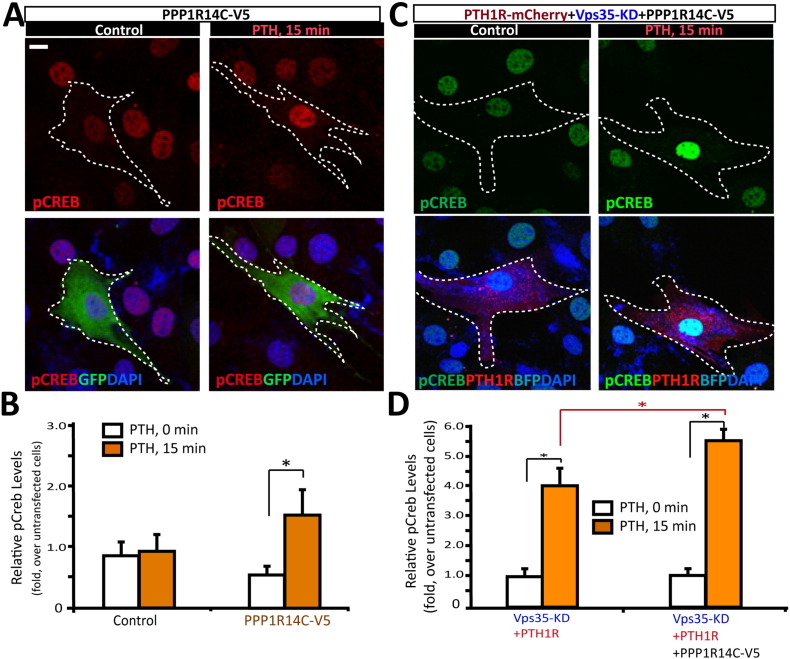
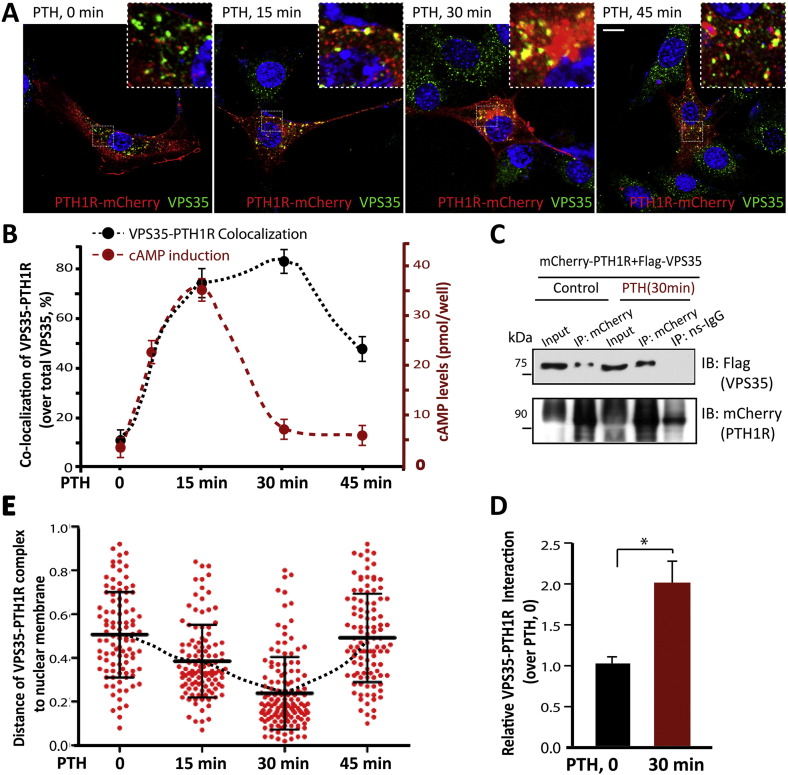
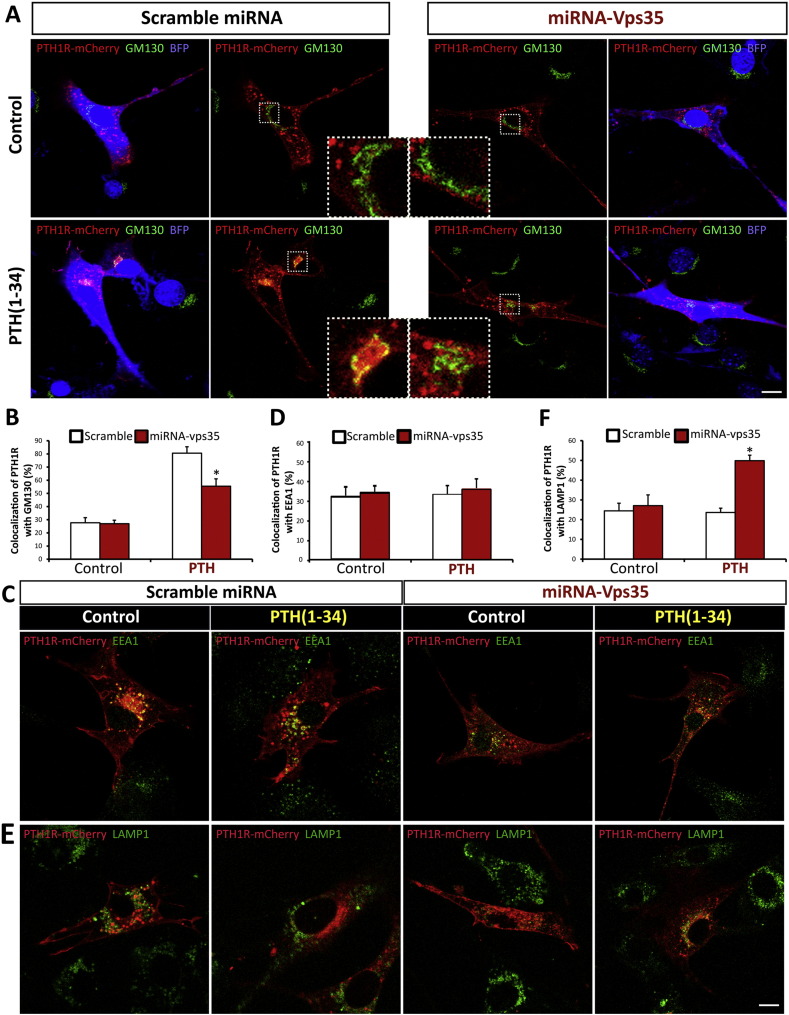
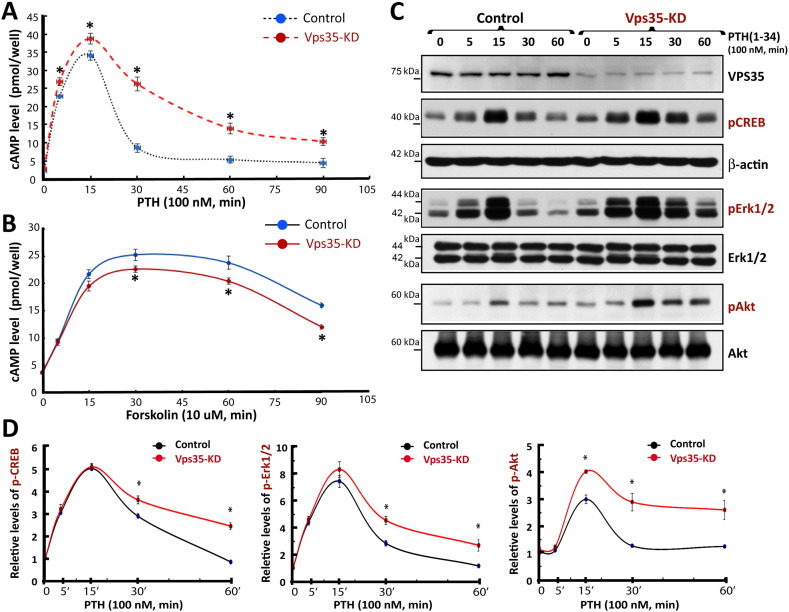
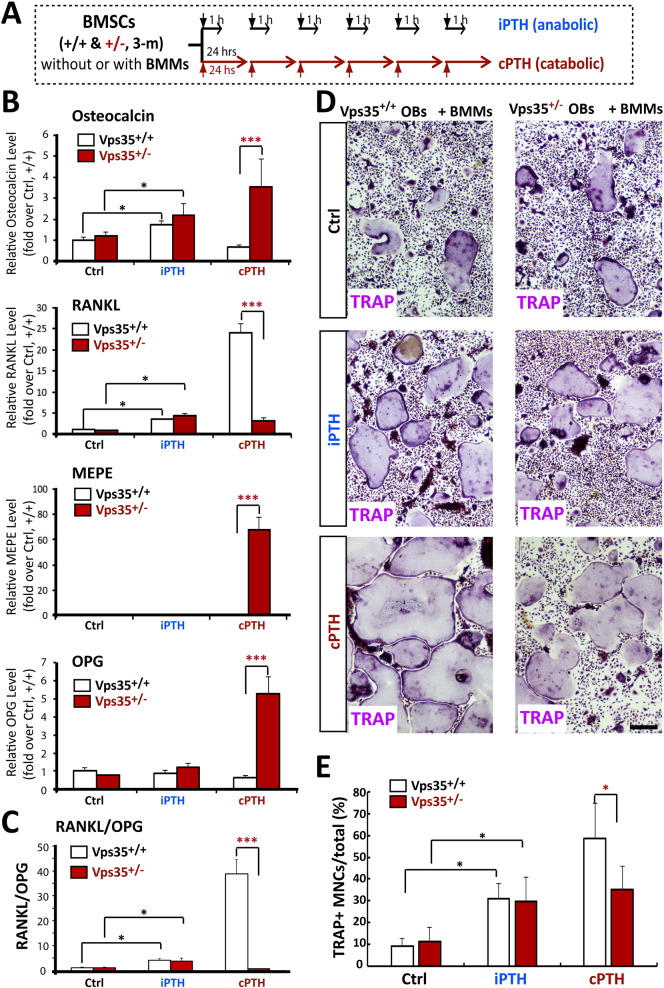
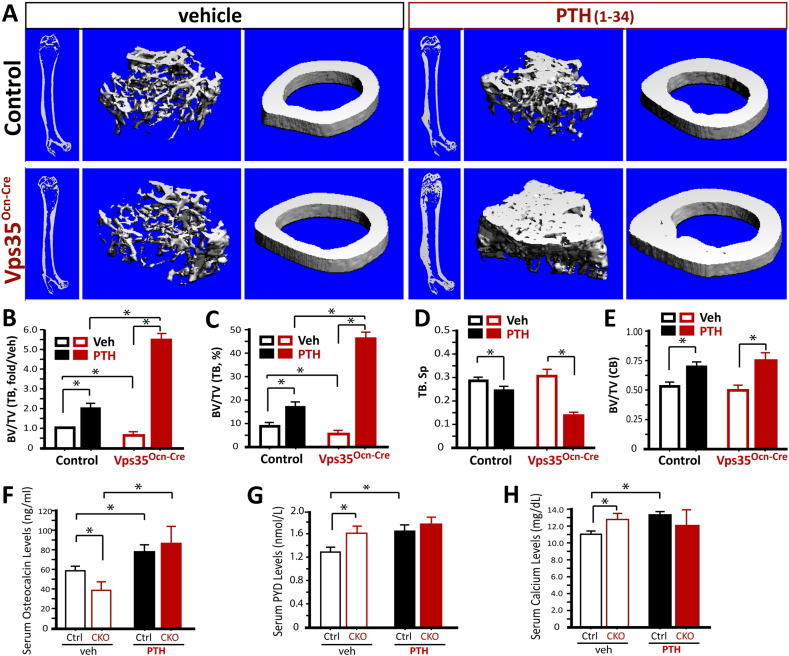
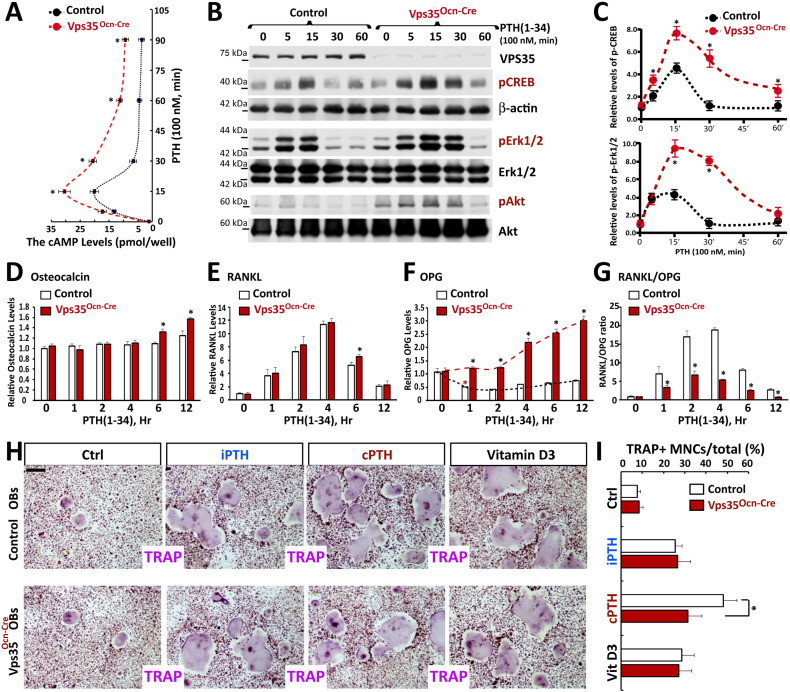
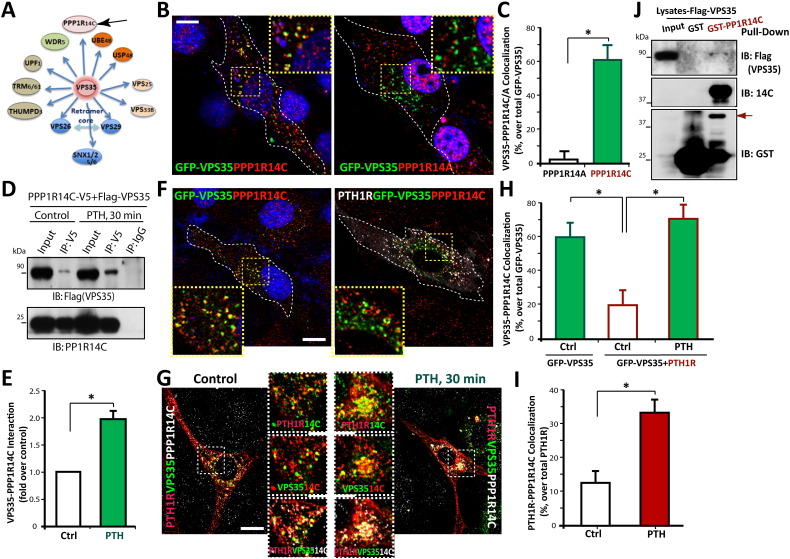
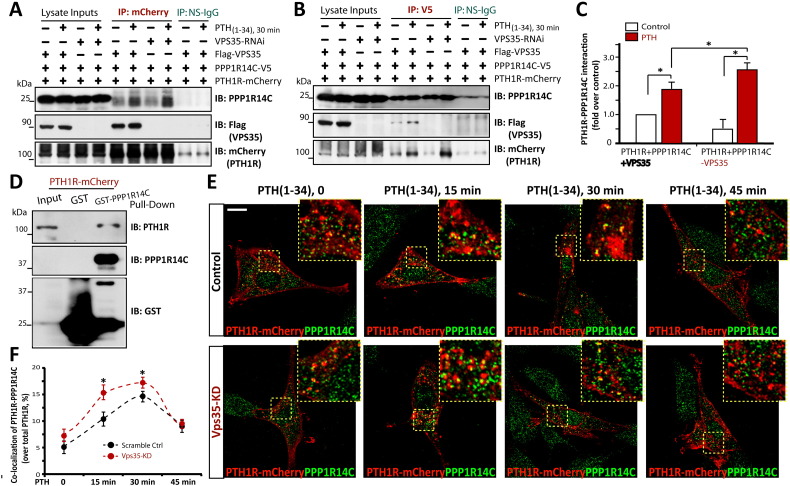
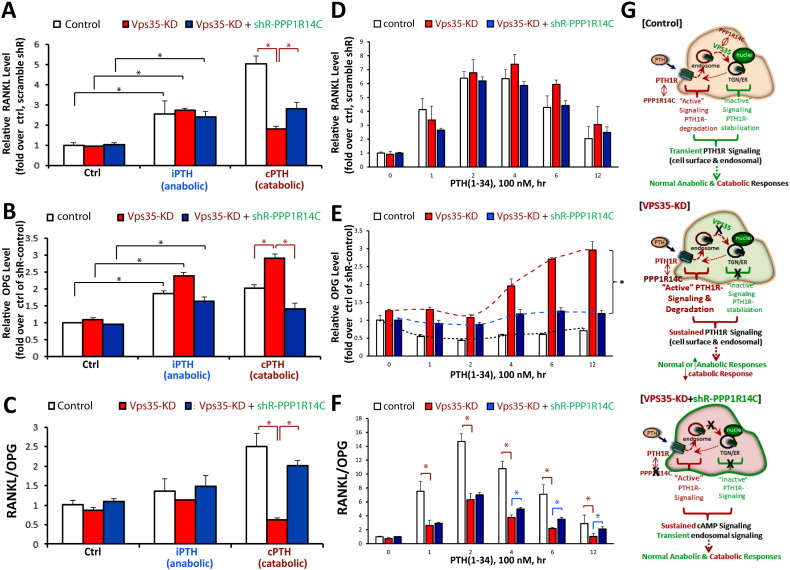
Parathyroid hormone (PTH) plays critical, but distinct, roles in bone remodeling, including bone formation (anabolic response) and resorption (catabolic response). Although its signaling and function have been extensively investigated, it just began to be understood how distinct functions are induced by PTH activating a common receptor, the PTH type 1 receptor (PTH1R), and how PTH1R signaling is terminated. Here, we provide evidence for vacuolar protein sorting 35 (VPS35), a major component of retromer, in regulating PTH1R trafficking, turning off PTH signaling, and promoting its catabolic function. VPS35 is expressed in osteoblast (OB)-lineage cells. VPS35-deficiency in OBs impaired PTH(1-34)-promoted PTH1R translocation to the trans-Golgi network, enhanced PTH(1-34)-driven signaling, and reduced PTH(1-34)'s catabolic response in culture and in mice. Further mechanical studies revealed that VPS35 interacts with not only PTH1R, but also protein phosphatase 1 regulatory subunit 14C (PPP1R14C), an inhibitory subunit of PP1 phosphatase. PPP1R14C also interacts with PTH1R, which is necessary for the increased endosomal PTH1R signaling and decreased PTH(1-34)'s catabolic response in VPS35-deficient OB-lineage cells. Taken together, these results suggest that VPS35 deregulates PTH1R-signaling likely by its interaction with PTH1R and PPP1R14C. This event is critical for the control of PTH(1-34)-signaling dynamics, which may underlie PTH-induced catabolic response and adequate bone remodeling.

Keywords: Osteoblasts; PPP1R14C; PTH1R; Retromer; VPS35.


Figures

Fig. S1
Fig. S1
Generation of PTH1R-mCherry plasmid. The PTH1R-mCherry expression plasmid was generated by fusion of the mCherry to the C-terminus of the RT-PCR amplified mouse PTH1R in a mammalian expression vector under control of the CAG promoter. (A) Western blot confirm PTH1RmCherry expression in HEK293T cells. (B) PTH1R-mCherry could be recognized by anti-PTH1R in MC3T3 cells by using immunofluorescence staining. (C) Increased cAMP in PTH1R-mCherry expressing HEK293 cells. (D–E) Elevated pCREB in PTH1R-mCherry expressing MC3T3 cells.
Fig. S2
Fig. S2
Decreased half-life of PTH1R in Vps35-deficient cells. (A) Time course analysis of PTH1R stability after cycloheximide (CHX) treatment. PTH1R-mCherry and miRNA-Vps35 or control miRNA were co-transfected into HEK293T cells. PTH1R protein levels at 0, 0.5, 1, 2, 4 and 8 h after CHX addition (50 μg/ml) were analyzed by western blotting. (B) The quantification analyses (by ImageJ software) of the data in A. The values of mean ± SD from 3 separate experiments were shown. *, P < 0.05.
Fig. S3
Fig. S3
Increased PTH(1–34)-induced pCREB in Vps35-KD MC3T3 cells. (A) Immunostaining analysis of pCREB in MC3T3 cells transfected with indicated plasmids and stimulated with control (PBS) or PTH(1–34)(100 nM) for 15 min. Bars, 10 μm. (B) Quantification analysis of the optical intensity of pCREB in un-transfected cells stimulated with control and PTH(1–34)(100 nM) for 15 min. The data were normalized with the values of control stimulation. (C) Quantification analysis of the relative levels of pCREB in Control (scramble RNAi), VPS35-KD (by miRNA-Vps35), PTH1R-mCherry, and VPS35- KD + PTH1R-mCherry MC3T3 cells stimulated without (PBS, control) or with PTH(1–34)(100 nM, 15 min). The relative levels of pCREB were determined by the optical intensity of pCREB in transfected cells (marked by BFP) over un-transfected cells in the same view field. The data quantified by ImageJ software were then normalized with the values of control stimulation in the control/scramble RNAi cells. In B and C, the values of mean ± SD (n = 50 transfected cells from 3-independent experiments) were presented. *, p < 0.05.
Fig. S4
Fig. S4
Increased PTH(1–34)-induced anabolic response, but impaired catabolic response, in Vps35 +/− mice. (A) Intermittent administration of PTH(1–34). P50 old Vps35 +/+ and Vps35 +/− male mice were administered once daily injection of hPTH(1–34) (50 μg/Kg), or vehicle (0.9% sodium chloride), 5 days per week for 5 weeks. The femurs and sera samples collected after treatments were subjected to μCT and ELISA/RIA assays, respectively. (B–H) The μCT analysis of femurs from Vps35 +/+ and Vps35 +/− littermates (at age of P85) treated with vehicle or PTH(1–34). Five different male mice of each genotype per group were examined blindly. Representative 3D images were shown in B. Quantification analyses (mean ± SD, n = 5) were presented in C–H. Data is determined by two-way ANOVA *, p < 0.05, **, p < 0.01, significant difference. Note that the trabecular bone (TB) volumes over total volumes (BV/TV), the trabecular bone numbers (Tb·N), and the connectivity density (CD) by direct model of μCT analysis were deficient in Vps35 +/− as compared with the WT control, and PTH(1–34)-treated Vps35 +/− mice showed more increased trabecular bone volumes than that of WT controls. The cortical bone (CB) volumes over total volumes showed no difference between Vps35 +/− and WT mice, but both increased after PTH(1–34) treatment. (I-J) RIA analysis of serum PYD (pyridinoline) (I) and ELISA analysis of serum osteocalcin (J) levels of Vps35 +/+ and Vps35 +/− littermates with vehicle or PTH(1–34) administration. The values of mean ± SD (n = 5) were presented. *, P < 0.05.
Fig. S5
Fig. S5
Reduced bone-mass and serum osteocalcin in Vps35Ocn-Cre mice. The floxed allele, Vps35f/f, was crossed with osteocalcin (Ocn)-Cre mice to generate Vps35Ocn-Cre mice. (A) Images of the control (Ocn-cre) and Vps35Ocn-Cre mice at age of 3-month (M) old. (B) Body weights of the control and Vps35 mutant mice at age of 3-M old. (C) Western blot analysis indicated selectively reduction of Vps35 protein in OB-lineage cells (e.g., BMSCs-bone marrow stromal cells and OBs-osteoblasts), but not in BMMs (bone marrow macrophages/monocytes). (D–E) H&E staining analysis. D, representative images; and E, quantification analysis of data from (D). N = 5 mice, *, P < 0.05. (F) Measurements of serum osteocalcin levels by ELISA analysis. N = 5 mice, *, P < 0.05.
Fig. S6
Fig. S6
Suppression of exogenous and endogenous PPP1R14C expression by expression of shRPPP1R14C in HEK293T and MC3T3 cells, respectively. (A) Suppression of exogenous PPP1R14C (PPP1R14C-V5) expression in HEK293T cells by co-expressing shR-PPP1R14C. HEK293T cells were transfected with indicated plasmids. Cell lysates were subjected to Western blot analysis using indicated antibodies. (B) Suppression of endogenous PPP1R14C expression in MC3T3 cells by expressing shR PPP1R14C (shR–14C–2). MC3T3 cells were transfected with the indicated plasmids for 48 h. Cells were fixed and subjected to immunostaining analysis using anti-PPP1R14C antibody. Bar, 10 μm.
Fig. S7
Fig. S7
Decreased PTH(1–34)-driven phosphorylations of CREB, Erk1/2, and Akt in PPP1R14Cdeficient MC3T3 cells. (A, B) MC3T3 cells infected with lentiviruses of scramble shRNA (control) and shRNA-PPP1R14C were serum starved overnight and stimulated with PTH(1–34)(100 nM) for the indicated time. Cell lysates were subjected to Western blot analyses using indicated antibodies. Representative blots were shown in A, and quantification analyses (by ImageJ software) of the data in A were presented in B. The values of mean ± SD from 3-separate experiments were shown. *, P < 0.05.
Fig. S8
Fig. S8
Enhanced PTH(1–34)-induced pCREB in MC3T3 cells expressing PPP1R14C. (A, C) Immunostaining analyses of pCREB in MC3T3 cells expressing indicated plasmids that were stimulated with or without PTH(1–34) for 15 min. Representative images were shown in A and C. (B, D) Quantification analysis of the optical intensity of pCREB. The pCREB levels in transfected cells (marked with dashed lines) were normalized to un-transfected cells in the same field of view. The values of mean ± SD (n = 25 cells from 3-different experiments) were shown. *, P < 0.05.
Fig. 1
Fig. 1
PTH(1–34)-increase of PTH1R interaction with VPS35 and PTH1R translocation to the TGN. (A–B) VPS35-PTH1R co-localization in MC3T3 cells was increased by PTH(1–34) stimulation. MC3T3 cells were transfected with PTH1R-mCherry, and then stimulated with PTH(1–34)(100 nM) for 0, 15 min, 30 min and 45 min. Cells were fixed and immunostained with indicated antibodies. (A) Representative images. Images marked with white squares were amplified and shown in right top images. Bar, 10 μm. (B) Quantification analysis of data from A using ZEN and ImageJ as described in Materials and Methods. The co-localization index of PTH1R-mCherry with VPS35 was determined by the measurement of overlapped signal (yellow fluorescence) over total VPS35 signal. The means ± SEM (n = 20 cells from 3-different assays) were presented. *, P < 0.05. (C–D) VPS35-PTH1R co-immunoprecipitation was increased by PTH(1–34). HEK293T cells were transfected with indicated plasmids. 48-h post transfection, cell lysates (~ 500 μg) were immunoprecipitated by anti-mCherry antibody (for PTH1R) and anti-non-specific IgGs (a non-specific control). The resulting lysates were subjected to Western blot analysis using indicated antibodies. ~ 50 μg of cell lysates were used as inputs. Note that a weak mCherry signal was detected in the non-specific IgG immunoprecipitates in 1C, which might be due to a non-specific association of mCherry proteins with the IgG. The data presented is a representative of 3-independent experiments. The data were quantified and shown in right as means ± SEM. *, P < 0.05. (E) The distance (× 10 μm) of Vps35-PTH1R co-distribution puncta to the nuclear membrane were presented.
Fig. 2
Fig. 2
Impaired PTH1R trafficking to TGN in VPS35-deficient MC3T3 cells. Co-immunostaining analysis of PTH1R-mCherry with GM130 (a marker for Golgi), EEA1 (a marker for early endosomes) or Lamp1 (a marker for late endosomes and early lysosomes) in control and Vps35-KD (by its miRNA) MC3T3 cells that were treated with or without PTH(1–34) (100 nM, 30 min). (A, C, and E) Representative images. Images marked with white squares in (A) were amplified and shown in middle images. Bar, 10 μm. (B, D, and F) Quantification analysis of data from A, C and E using ZEN and ImageJ as described in Materials and Methods. The co-localization index of PTH1R-mCherry with indicated markers (GM130, EEA1 and LAMP1) was determined by the measurement of overlapped signaling (yellow fluorescence) over total PTH1R-mCherry signal. The values of means ± SD (n = 20 cells from 3-different assays) were show. *, P < 0.05.
Fig. 3
Fig. 3
Increased and sustained PTH(1–34)-driven signaling in Vps35-deficient MC3T3 cells. Cells were serum starved overnight and stimulated with PTH(1–34)(100 nM) or Forskolin (10 μM) for the indicated time. For cAMP assay in (A–B), cells were lysed with 0.1 M HCl and centrifuged, the supernatant were assayed by using a cAMP ELISA kit. For Western blot analyses in (C–D), cell lysates were subjected to Western blot analyses using indicated antibodies. Representative blots were shown in C, and quantification analyses (by ImageJ software) of the data in C were shown in D. The values of mean ± SD from 3 separate experiments were shown. *, P < 0.05.
Fig. 4
Fig. 4
Reduced PTH(1–34)-driven catabolic response in Vps35-deficient BMSCs and mice. (A) Intermittent and continued treatments of PTH(1–34). Primary cultured BMSCs from Vps35+/+ and Vps35+/− mice (at age of 3-month old) were treated without PTH (Sham control) and with PTH(1–34) intermittently (iPTH) (100 nM, 1-h per day, for 6 days) or continually (cPTH)(100 nM, daily change with fresh medium containing PTH(1–34)). The total RNAs were isolated after treatments and subjected to real time PCR analysis. (B–C) Real-time PCR analysis of the mRNA levels of osteocalcin, MEPE, RANKL, and OPG. The values are normalized to β-actin. Ratio of RANKL/OPG was shown in C. The values of mean ± SD from 3-different experiments were presented. Data is determined by two-way ANOVA followed by a post-hoc text, *, p < 0.05, ***, p < 0.001, significant difference. (D–E) TRAP staining analysis of multiple nuclei cells (OCs) derived from BMMs co-culture with osteoblasts from Vps35+/+ and Vps35+/− mice. The coverslips containing WT BMMs were seeded onto mineral thin films above Vps35+/+ or Vps35+/− osteoblasts already plated on the 100 mm culture dishes. Cells were cultured in α-MEM medium supplemented with 10% FBS, 1% penicillin/streptomycin, 2.5 mM β-glycerophosphate and 10− 8 M Vitamin D3 (first 2 days). Then, cells were treated with PBS (sham Control), PTH(1–34) intermittently (iPTH) (100 nM, 1-h per day) or continually (cPTH)(100 nM). The co-cultures were grown for 10 days and prepared for TRAP staining. Representative images are shown in D, the quantitative analyses of TRAP+ multinuclei cells (MNCs) over total cells are presented in E. The values of mean ± SD from 3-different experiments were presented. Data is determined by two-way ANOVA *, p < 0.05, significant difference.
Fig. 5
Fig. 5
Increased PTH(1–34)-induced anabolic response, but impaired catabolic response, in Vps35Ocn-Cre mice. P50 old Vps35f/f and Vps35Ocn-Cre male mice were administered once daily injection of hPTH(1–34) (50 μg/Kg), or vehicle (0.9% sodium chloride), 5 days per week for 5 weeks. The femurs and sera samples collected after treatments were subjected to μCT and ELISA/RIA assays, respectively. (A–E) The μCT analysis of femurs from Vps35f/f and Vps35Ocn-Cre littermates (at age of P85) treated with vehicle or PTH(1–34). Five different male mice of each genotype per group were examined blindly. Representative 3D images were shown in A. Quantification analyses (mean ± SD, n = 5) were presented in B-D. Two-way ANOVA *, P < 0.05, **, P < 0.01, significant difference. (F–H) ELISA/RIA analysis of serum osteocalcin (F), PYD (G), and serum calcium (H) levels of Vps35f/f and Vps35Ocn-Cre littermates (at age of P85) treated with vehicle or PTH(1–34). Mean ± SD from 5 different animals per genotype. *, P < 0.05, significant difference.
Fig. 6
Fig. 6
Increased PTH(1–34)-induced signaling and anabolic response, but reduced catabolic response, in BMSCs from Vps35Ocn-Cre mice. (A–C) Increased and sustained PTH(1–34)-induced cAMP (A) and pCREB and pErk1/2 (B–C) in BMSCs from Vps35Ocn-Cre mice, compared with control BMSCs (from Vps35f/f mice). Cells were serum starved overnight and stimulated with PTH(1–34)(100 nM) for the indicated time. For cAMP assay (in A), cells were lysed with 0.1 M HCl and centrifuged, the supernatant were assayed by using a cAMP ELISA kit. For evaluating protein phosphorylation assays (in B–C), cell lysates were subjected to Western blot analyses using indicated antibodies. Quantification analyses (in C) were carried out by ImageJ software) of the data in (B). The values of mean ± SD from 3 separate experiments were shown. *, p < 0.05. (D–G) Real-time PCR analysis of the mRNA levels of osteocalcin, RANKL, and OPG in BMSCs from control (Vps35f/f) and Vps35Ocn-Cre mice. The values are normalized to β-actin. Ratio of RANKL/OPG was shown in G. The values of mean ± SD from 3-different experiments were presented. *, P < 0.05. (H–I) TRAP staining analyses of multiple nuclei cells (OCs) derived from co-cultures of BMMs plus osteoblasts (Vps35f/f vs Vps35Ocn-Cre) in the presence of the indicated stimulations. Representative images were shown in (H), and quantification data (mean ± SD, n = 3 separate experiments) were presented in (I). *, P < 0.05.
Fig. 7
Fig. 7
VPS35 interaction with PPP1R14C. (A) Predicted proteins that may interact with VPS35 by Emililab. (B–C) Co-localization of endogenous PPP1R14C, but not PPP1R14A, with exogenous GFP-VPS35 in MC3T3 cells. Representative images were shown in (B). Quantification analyses of the optical intensity of GFP-Vps35 co-localization with PPP1R14A or PPP1R14C over total GFP-VPS35 were presented in C. Bar, 10 μm. (D–E) Co-immunoprecipitation of PPP1R14C with VPS35. HEK293T cells were transfected with V5-tagged PPP1R14C and FLAG-tagged VPS35. 48 h post transfection, cell extracts (~ 500 μg) were immunoprecipitated with V5(PPP1R14C), and the resulting immunoprecipitates were subjected to immunoblot by using anti-Flag (for VPS35) antibody. IgG antibody was used as a negative control for immunoprecipitation, and 50 μg of the cell lysates was used as input. The data presented is a representative blot of 3 independent experiments. Quantification analyses were shown in E. (F–I) GFP-VPS35-PPP1R14C co-localization was decreased in MC3T3 cells expressing PTH1R-mCherry, but increased by PTH(1–34) stimulation. MC3T3 cells expressing PTH1R-mCherry and GFP-VPS35 were stimulated with control or PTH(1–34)(100 nM) for 30 min. Cells were fixed and subjected to the immunostaining analysis with indicated antibodies. Representative images were shown, and the images marked with white squares were amplified and shown in right corners. The quantification analyses of the optical intensity for the co-localization (GFP-VPS35 with endogenous PPP1R14C) over total GFP-VPS35 or the co-localization of PTH1R-PPP1R14C over total PTH1R were presented in H and I, respectively. Bar, 10 μm. The values of mean ± SD (n = 30 cells from 3-different experiments) were presented. *, P < 0.05. (J) In vitro GST pull down assay using indicated GST fusion proteins was carried out in HEK293 lysates expressing Flag-Vps35. The precipitates associated with the GST beads were subjected to the Western blot analysis using indicated antibodies.
Fig. 8
Fig. 8
PTH1R interaction with PPP1R14C. (A-C) Co-immunoprecipitation of PTH1R- PPP1R14C complex in the presence or absence of VPS35. HEK293T cells were transfected with indicated plasmids. 48 h post transfection, cells were treated with or without PTH(1–34)(100 nM) for 30 min. Cell lysates were immunoprecipitated with anti-V5 (for PPP1R14C) or anti-mCherry (for PTH1R) antibodies, respectively. The resulting precipitates were subjected to immunoblotting analysis using indicated antibodies. The data presented are representative blots of 3-independent experiments. Quantification analyses were shown in C. (D) In vitro GST pull down assay using indicated GST fusion proteins was carried out in HEK293 lysates expressing PTH1R-mCherry. The precipitates associated with the GST beads were subjected to the Western blot analysis using indicated antibodies. (E–F) Co-localization of PTH1R with PPP1R14C in MC3T3 cells in the presence or absence of VPS35. MC3T3 cells were co-transfected with indicated plasmids. 48 h post transfection, cells were stimulated with PTH(1–34)(100 nM) for the indicated time, and then subjected to the immunostaining analysis with indicated antibodies. Representative images were shown, and images marked with white squares were amplified and shown in right top corners. Quantification analyses of the optical intensity for the co-localization of PTH1R-PPP1R14C over total PTH1R were presented in E. Bar, 10 μm. The values of mean ± SD (n = 25 cells from 3-different experiments) were shown. *, P < 0.05, significant difference.
Fig. 9
Fig. 9
Requirement of PPP1R14C for the enhanced PTH(1–34)-driven endosomal signaling in Vps35-KD MC3T3 cells. (A-B) Western blot analysis of PTH(1–34)-driven signaling in Control, Vps35-KD and Vps35-KD plus PPP1R14C-KD MC3T3 cells. Representative blots from 3-independent experiments were shown in A. The data were quantified by ImageJ software and presented in B as mean ± SD. *, P < 0.05. (C–D) Immunostaining analysis of pCREB in Vps35-KD and Vps35-KD plus PPP1R14C-KD MC3T3 cells treated with or without PTH(1–34) for 15 min. Representative images were shown in C. The pCREB levels in transfected cells (marked by BFP/GFP with dashed lines) were normalized to un-transfected cells in the same field of view. The quantification analyses shown in (D) were mean ± SD (n = 30 cells from 3-different assays). *, P < 0.05. Bar, 10 μm. (E) ELISA analysis of cAMP production in Control, Vps35-KD and Vps35-KD plus PPP1R14C-KD MC3T3 cells. Cells were serum starved overnight and stimulated with PTH(1–34)(100 nM) for the indicated time in E. Then, cells were lysed with 0.1 M HCl and centrifuged, the supernatant were assayed by using a cAMP ELISA kit. (F) Illustration of a working model for a possible role of VPS35-PPP1R14C interaction in regulating PTH signaling.
Fig. 10
Fig. 10
Diminished deficit in PTH(1–34)-induced catabolic response in Vps35-KD MC3T3 cells suppressing PPP1R14C's expression. (A-F) Real-time PCR analysis of the mRNA levels of RANKL, and OPG in control (scramble shRNA), Vps35-KD plus scramble shR, and Vps35-KD plus shR-PPP1R14C MC3T3 cells in response to indicated PTH(1–34) stimulations. In (A-C), cells were treated with Ctrl (PBS), iPTH (100 nM, 1-h per day for 6 days), or cPTH (100 nM, daily change with fresh medium containing PTH(1–34)) as described in Method and Fig. 4A. In (D–F), cells were treated with PTH(1–34)(100 nM) for indicated time. The values are normalized to β-actin. Ratio of RANKL/OPG was shown in C and F. The values of mean ± SD from 3-different experiments were presented. *, p < 0.05. (G) Illustration of working models for VPS35 and PPP1R14C to differentially regulate PTH1R cell surface and endosomal signaling dynamics and function.

Similar articles

Cited by

References

    1. Belenkaya T.Y., Wu Y., Tang X., Zhou B., Cheng L., Sharma Y.V., Yan D., Selva E.M., Lin X. The retromer complex influences Wnt secretion by recycling wntless from endosomes to the trans-Golgi network. Dev. Cell. 2008;14:120–131. - PubMed
    1. Bonifacino J.S., Hurley J.H. Retromer. Curr. Opin. Cell Biol. 2008;20:427–436. - PMC - PubMed
    1. Borroni B., Ferrari F., Galimberti D., Nacmias B., Barone C., Bagnoli S., Fenoglio C., Piaceri I., Archetti S., Bonvicini C. Heterozygous TREM2 mutations in frontotemporal dementia. Neurobiol. Aging. 2014;35(934) (e937-910) - PubMed
    1. Cheloha R.W., Gellman S.H., Vilardaga J.P., Gardella T.J. PTH receptor-1 signalling-mechanistic insights and therapeutic prospects. Nat. Rev. Endocrinol. 2015;11:712–724. - PMC - PubMed
    1. Chen D., Xiao H., Zhang K., Wang B., Gao Z., Jian Y., Qi X., Sun J., Miao L., Yang C. Retromer is required for apoptotic cell clearance by phagocytic receptor recycling. Science. 2010;327:1261–1264. - PubMed

MeSH terms

Substances