

Myosin 1e promotes breast cancer malignancy by enhancing tumor cell proliferation and stimulating tumor cell de-differentiation
- PMID: 27329840
- PMCID: PMC5216807
- DOI: 10.18632/oncotarget.10139
Myosin 1e promotes breast cancer malignancy by enhancing tumor cell proliferation and stimulating tumor cell de-differentiation
Abstract
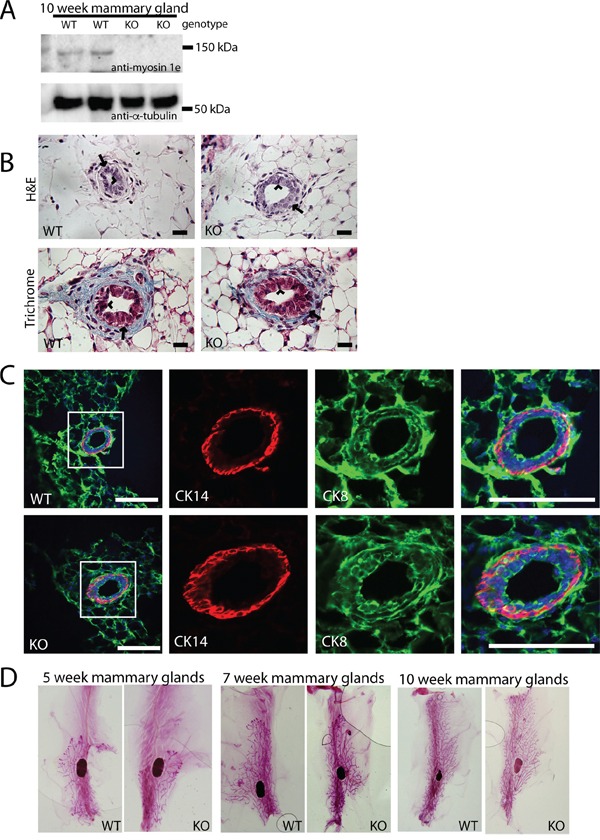
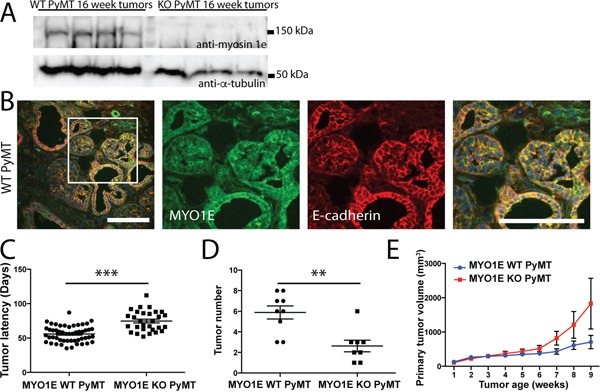
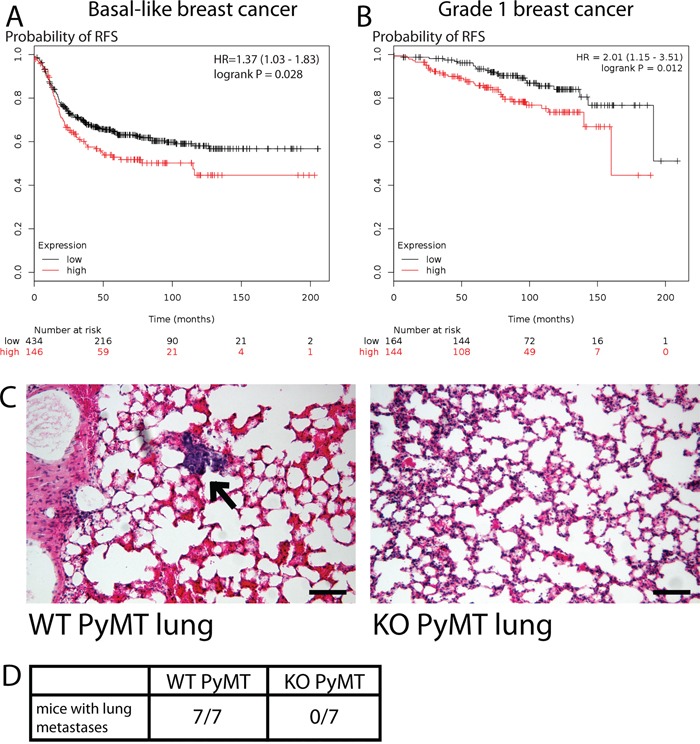
Despite advancing therapies, thousands of women die every year of breast cancer. Myosins, actin-dependent molecular motors, are likely to contribute to tumor formation and metastasis via their effects on cell adhesion and migration and may provide promising new targets for cancer therapies. Using the MMTV-PyMT murine model of breast cancer, we identified Myosin 1e (MYO1E) as a novel tumor promoter. Tumor latency in mice lacking MYO1E was significantly increased, and tumors formed in the absence of MYO1E displayed unusual papillary morphology, with well-differentiated layers of epithelial cells covering fibrovascular cores, rather than solid sheets of tumor cells typically observed in this cancer model. These tumors were reminiscent of papillary breast cancer in humans that is typically non-invasive and often cured by tumor excision. MYO1E-null tumors exhibited decreased expression of the markers of cell proliferation, which was recapitulated in primary tumor cells derived from MYO1E-null mice. In agreement with our findings, meta-analysis of patient survival data indicated that MYO1E expression level was associated with reduced recurrence-free survival in basal-like breast cancer. Overall, our data suggests that MYO1E contributes to breast tumor malignancy and regulates the differentiation and proliferation state of breast tumor cells.
Keywords: animal models of cancer; breast cancer; myosin; therapeutic targets; tumor promotion and progression.
Conflict of interest statement
The authors disclose no potential conflicts of interest.
Figures


Similar articles
-
Mint3 in bone marrow-derived cells promotes lung metastasis in breast cancer model mice.Biochem Biophys Res Commun. 2017 Aug 26;490(3):688-692. doi: 10.1016/j.bbrc.2017.06.102. Epub 2017 Jun 19. Biochem Biophys Res Commun. 2017. PMID: 28634075
-
Frequent overexpression of AMAP1, an Arf6 effector in cell invasion, is characteristic of the MMTV-PyMT rather than the MMTV-Neu human breast cancer model.Cell Commun Signal. 2018 Jan 5;16(1):1. doi: 10.1186/s12964-017-0212-z. Cell Commun Signal. 2018. PMID: 29329590 Free PMC article.
-
ADAMTS1 Promotes Adhesion to Extracellular Matrix Proteins and Predicts Prognosis in Early Stage Breast Cancer Patients.Cell Physiol Biochem. 2019;52(6):1553-1568. doi: 10.33594/000000108. Cell Physiol Biochem. 2019. PMID: 31135123
-
Contributions of the RhoA guanine nucleotide exchange factor Net1 to polyoma middle T antigen-mediated mammary gland tumorigenesis and metastasis.Breast Cancer Res. 2018 May 16;20(1):41. doi: 10.1186/s13058-018-0966-2. Breast Cancer Res. 2018. PMID: 29769144 Free PMC article.
-
Myosins: Driving us towards novel targets and biomarkers in cancer.Int Rev Cell Mol Biol. 2020;356:291-322. doi: 10.1016/bs.ircmb.2020.06.004. Epub 2020 Jul 16. Int Rev Cell Mol Biol. 2020. PMID: 33066876 Review.
Cited by
-
Myosin 1e deficiency affects migration of 4T1 breast cancer cells.Cytoskeleton (Hoboken). 2024 Dec;81(12):723-736. doi: 10.1002/cm.21819. Epub 2023 Dec 23. Cytoskeleton (Hoboken). 2024. PMID: 38140937
-
Multi‑omics identification of a signature based on malignant cell-associated ligand-receptor genes for lung adenocarcinoma.BMC Cancer. 2024 Sep 12;24(1):1138. doi: 10.1186/s12885-024-12911-5. BMC Cancer. 2024. PMID: 39267056 Free PMC article.
-
Characterization of a novel RP2-OSTF1 interaction and its implication for actin remodelling.J Cell Sci. 2018 Feb 20;131(4):jcs211748. doi: 10.1242/jcs.211748. J Cell Sci. 2018. PMID: 29361551 Free PMC article.
-
Myosin-1E interacts with FAK proline-rich region 1 to induce fibronectin-type matrix.Proc Natl Acad Sci U S A. 2017 Apr 11;114(15):3933-3938. doi: 10.1073/pnas.1614894114. Epub 2017 Mar 27. Proc Natl Acad Sci U S A. 2017. PMID: 28348210 Free PMC article.
-
Myo1e overexpression in lung adenocarcinoma is associated with increased risk of mortality.Sci Rep. 2023 Mar 13;13(1):4107. doi: 10.1038/s41598-023-30765-y. Sci Rep. 2023. PMID: 36914720 Free PMC article.
References
-
- ACS . Cancer Facts & Figures 2015. Atlanta: American Cancer Society; 2015.
-
- Wagner KU, McAllister K, Ward T, Davis B, Wiseman R, Hennighausen L. Spatial and temporal expression of the Cre gene under the control of the MMTV-LTR in different lines of transgenic mice. Transgenic research. 2001;10:545–553. - PubMed
-
- Smith BA, Shelton DN, Kieffer C, Milash B, Usary J, Perou CM, Bernard PS, Welm BE. Targeting the PyMT Oncogene to Diverse Mammary Cell Populations Enhances Tumor Heterogeneity and Generates Rare Breast Cancer Subtypes. Genes cancer. 2012;3:550–563. doi: 10.1177/1947601913475359. - DOI - PMC - PubMed
-
- Courtneidge SA, Smith AE. Polyoma virus transforming protein associates with the product of the c-src cellular gene. Nature. 1983;303:435–439. - PubMed
MeSH terms
Substances
Grants and funding
LinkOut - more resources
Full Text Sources
Other Literature Sources
Medical
Molecular Biology Databases
