. 2016 Jul 5;113(27):7551-6.
doi: 10.1073/pnas.1600363113. Epub 2016 Jun 17.

Tumor-associated fibroblasts predominantly come from local and not circulating precursors

Affiliations

Tumor-associated fibroblasts predominantly come from local and not circulating precursors

Ainhoa Arina et al. Proc Natl Acad Sci U S A. .

Abstract

Fibroblasts are common cell types in cancer stroma and lay down collagen required for survival and growth of cancer cells. Although some cancer therapy strategies target tumor fibroblasts, their origin remains controversial. Multiple publications suggest circulating mesenchymal precursors as a source of tumor-associated fibroblasts. However, we show by three independent approaches that tumor fibroblasts derive primarily from local, sessile precursors. First, transplantable tumors developing in a mouse expressing green fluorescent reporter protein (EGFP) under control of the type I collagen (Col-I) promoter (COL-EGFP) had green stroma, whereas we could not find COL-EGFP(+) cells in tumors developing in the parabiotic partner lacking the fluorescent reporter. Lack of incorporation of COL-EGFP(+) cells from the circulation into tumors was confirmed in parabiotic pairs of COL-EGFP mice and transgenic mice developing autochthonous intestinal adenomas. Second, transplantable tumors developing in chimeric mice reconstituted with bone marrow cells from COL-EGFP mice very rarely showed stromal fibroblasts expressing EGFP. Finally, cancer cells injected under full-thickness COL-EGFP skin grafts transplanted in nonreporter mice developed into tumors containing green stromal cells. Using multicolor in vivo confocal microscopy, we found that Col-I-expressing fibroblasts constituted approximately one-third of the stromal mass and formed a continuous sheet wrapping the tumor vessels. In summary, tumors form their fibroblastic stroma predominantly from precursors present in the local tumor microenvironment, whereas the contribution of bone marrow-derived circulating precursors is rare.

Keywords: bone marrow; collagen; mesenchymal; origin; stroma.


Conflict of interest statement

The authors declare no conflict of interest.

Figures
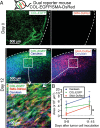
Fig. 1.
Fig. 1.
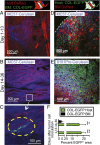
Tumor growth is associated with the appearance of αSMA and the continuous presence of collagen α1(I)-expressing fibroblasts. (A) Expression of COL-EGFP and SMA-DsRed on healthy skin (day 0) and 12 d after MC57-Cerulean tumor cells were injected in a dual reporter COL-EGFP/SMA-DsRed Rag−/− mouse bearing a dorsal skinfold window chamber. Dotted lines indicate window and tumor boundary. (B) Quantification of the area (mean and SD) occupied by COL-EGFP+, SMA-DsRed+, and Cerulean+ (cancer) cells in images obtained from tumors developing in dual reporter mice. Data were pooled from five independent experiments using COL-EGFP/SMA-DsRed Rag−/− mice injected with MC57, Pro4L, and 8101Pro fibrosarcomas (n = 1 mouse each) and COL-EGFP/SMA-DsRed Rag+/+ mice injected with MC38 colon carcinoma and 8101Pro fibrosarcoma (n = 1 each); all cell lines expressed Cerulean. Two to eight tumor regions were averaged per mouse and time point before pooling the data from individual mice. *P = 0.031.
Fig. S1.
Fig. S1.
Schematic representation of the mouse models used for in vivo imaging experiments using dorsal skinfold window chambers.
Fig. S2.
Fig. S2.
αSMA-DsRed+ cells appear with the onset of vascularization but disappear at later stages in growing s.c. tumors. Expression of COL-EGFP and SMA-DsRed at different times after s.c. injection of MC38 cancer cells in an immunocompetent window chamber-bearing dual reporter COL-EGFP/SMA-DsRed mouse.
Fig. S3.
Fig. S3.
Expression of αSMA and collagen α1(I) in established tumors overlap only partially. Colocalization of COL-EGFP and SMA-DsRed expression. The area occupied by green-only and red-only cells or cells that were both green and red was quantified. The areas assigned to each category are shown in a representative example: green (COL), red (SMA), and green+red (both). Averages and SDs from three to five regions per tumor (original magnification 20×) are shown. The images used are from days 14–22 of tumor growth.
Fig. 2.
Fig. 2.
Newly transplanted BM precursors do not significantly contribute to form TAFs. (AE) Representative images from BM chimeric mice in which only the BM (AC) or only the irradiated host (D and E) expressed the COL-EGFP transgene and were injected with Cerulean-expressing tumor cells in dorsal windows. EGFP-expressing cells were almost exclusively observed when COL-EGFP was expressed in the irradiated host. A few cells derived from BM precursors could be observed only at late time points (yellow dotted line in C). The white dotted line indicates tumor boundary. (F) Quantification of the area (mean and SD) occupied by COL-EGFP+ cells in images from BM chimera experiments. Data have been pooled from four independent longitudinal experiments using MC57 and Pro4L cell lines growing in Rag−/− chimeras and 8101Pro and MC38 growing in Rag+/+ chimeras (n = 1 mouse per cell line). Two to 11 tumor regions were pooled per mouse and time point before pooling the data from individual mice. *P = 0.029, **P = 0.01.
Fig. S4.
Fig. S4.
TAFs derive predominantly from sessile precursors in a murine colon carcinoma model. Immunocompetent BM chimeric mice in which only the irradiated host (Left) or only the bone marrow (Right) expressed the COL-EGFP transgene were injected with Cerulean-expressing MC38 colon carcinoma in a dorsal window. EGFP-expressing cells were mainly observed when COL-EGFP was expressed in the irradiated host.
Fig. S5.
Fig. S5.
BM precursors do not contribute to form SMA-DsRed–expressing cells in tumors. BM chimeric mice in which only the BM (Right) or only the irradiated host (Left) expressed the SMA-DsRed transgene were injected with Cerulean-expressing tumor cells in dorsal windows, as in Fig. 2. We could not observe any DsRed+ cells that originated from BM precursors at any time point analyzed in two independent experiments using two different cell lines (MC57 and Pro4L) grown in Rag−/− mice. In contrast, abundant DsRed+ cells were found in chimeras expressing SMA-DsRed in the sessile compartment.
Fig. 3.
Fig. 3.
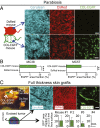
TAFs derive predominantly from local sessile precursors. (A) Parabiotic pairs of mice were created where only one mouse expressed COL-EGFP and the other mouse expressed DsRed ubiquitously. Two pairs were created: pair 1 contained immunocompetent mice with MC38-Cerulean tumors; pair 2 had MC57-Cerulean tumors in Rag−/− mice. On each mouse of the parabiotic pairs, cancer cells were injected into the distal flank. (A) Representative images are shown from the freshly explanted MC57 tumors from pair 2 at week 3 of tumor growth (n = 6–9 areas per tumor; mean and SD). (B) Quantification of the EGFP+ area fraction (mean and SD) in the tumors from parabiosed mice. **P = 0.0022, ***P = 0.001. (C) Full-thickness skin grafts from COL-EGFP mice were transplanted into four DsRed Rag−/− mice. One month later, MC38-Cerulean cancer cells were injected s.c. into the center of the green skin grafts with the help of a UV lamp. At day 12 (mouse 1) or 25 (mice 2–4) of tumor growth, mice were killed and 1- to 2-mm-thick slices were cut from freshly explanted tumors at a distance of 2.5–3 mm from the surface. The area fraction occupied by COL-EGFP+ cells was quantified in 4–17 optical regions per mouse (mean and SD). A second experiment in which cancer cells were injected 2 mo after skin graft transplantation gave similar results (n = 3 mice). N.D., nondetectable. (Scale bars, 50 μm.)
Fig. S6.
Fig. S6.
Evidence for shared circulation in parabiotic mouse pairs. (A) Peripheral blood was drawn from each mouse in DsRed and COL-EGFP parabiotic mouse pairs from Fig. 3A to provide evidence for shared circulation. FACS plots were generated with the peripheral blood cells after red blood cell lysis. The peripheral blood cells from COL-EGFP mice do not contain EGFP-expressing cells, indicating that type I collagen-expressing cells are not found in the circulation. (B) As technical controls and for instrument settings, peripheral blood cells from a DsRed mouse and an EGFP transgenic mouse with ubiquitous expression of the fluorescent proteins were analyzed in parallel. The numbers indicate the percentage of cells in each quadrant.
Fig. 4.
Fig. 4.
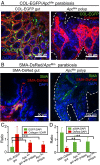
TAFs originating from circulating cells cannot be detected in autochthonous ApcMin intestinal adenomas. ApcMin mice that develop intestinal adenomas were parabiosed with fibroblast reporter mice. Animals were killed when the ApcMin mice became moribund, and intestinal sections were stained with antibodies against EGFP and Col-I (A and C) or DsRed and αSMA (B and D). Representative immunofluorescence images are shown from (A) a COL-EGFP/ApcMin pair parabiosed for 5 wk and (B) an SMA-DsRed/ApcMin pair parabiosed for 10 wk. Dotted lines indicate polyp boundary. Data from experiments shown in A and B are quantified in C and D, respectively, as the ratio of (C) EGFP+ and collagen I+ or (D) DsRed+ and αSMA+ area to nuclear area (DAPI) in positive control sections from normal reporter mouse gut versus sections of Swiss gut rolls containing both normal gut and polyps or only ApcMin polyps from the ApcMin mouse (mean and SD). Quantitative data were derived using 5× magnification images from scanned IF slides, comprising most of the sample (at least 8–11 5× regions per slide or its entirety). Data are from three ApcMin Swiss roll slides and five slides containing only polyps (C), three ApcMin Swiss roll slides, and one slide containing only polyps (D), plus one positive control slide in each case. Two additional parabiosis experiments in the COL-EGFP model showed consistent results. **P < 0.01, ***P < 0.001.
Fig. S7.
Fig. S7.
Contribution of the different cellular compartments to the total tumor mass. (A) Parts of the whole graph showing the relative area occupied by the four different cellular compartments in tumors: cancer cells (blue), BM-derived cells (yellow), non–BM-derived cells expressing collagen (red and green), and non–BM-derived cells not expressing collagen (only red). COL-EGFP/DsRed+ mice that also expressed EGFP under the collagen α1(I) promoter were lethally irradiated and reconstituted with BM cells from B6 EYFP+ mice. After 2 mo, window chambers were installed and cancer cells (MC57, Pro4L, or MC38) expressing Cerulean were injected in three independent longitudinal experiments. Hosts were Rag−/− for MC57 and Pro4L, and Rag+/+ for MC38 (n = 1 per cell line). Areas were quantified in images obtained from established 12-d MC38 tumors and 22- to 28-d MC57 and Pro4L tumors (four or five regions per mouse and cell line). Each column represents an individual tumor region. The total cellular area quantified is indicated below each column. On average, fibroblasts accounted for 30 ± 5.8% of the stroma, whereas BM-derived cells were 67 ± 12.2%. (B) Representative images of a region analyzed for quantification in A are shown from a 28-d MC57 tumor. (C) Z stacks were obtained from a 22-d MC57 tumor. Z stacks were generated by acquiring nine images (optical slices) at 8-μm intervals (total depth of 72 μm). Top and bottom views of a 3D reconstruction of a Z stack, corresponding to Movie S1, are shown. (D) The volume occupied by the different cellular compartments in the 3D Z stack was quantified. A representative graph is displayed showing the relative contribution of each compartment to the total cellular volume (2.15 × 108 μm3). Percentages are similar to those in A, where areas were quantified instead of volumes, showing that both approaches rendered similar results.
Fig. 5.
Fig. 5.
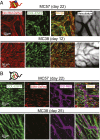
Col-I–expressing cells form perivascular structures. (A) COL-EGFP+ cells are found in close association with tumor vessels. COL-EGFP+ structures wrap the DsRed+ vessels in MC57 fibrosarcoma and MC38 carcinoma growing in DsRed+COL-EGFP+ chimeric mice with an EYFP+ BM. Representative images are shown from two out of three independent longitudinal experiments performed with MC57, MC38, and Pro4L-Cerulean tumors (n = 1 mouse each). COL-EGFP+ cells wrapping vessels were observed in normal (non-BM chimeric) COL-EGFP mice in five more independent experiments. (B) SMA-DsRed+ cells do not form tubular structures around vessels in late-stage established tumors. In day 22–25 MC57 and MC38 tumors grown in COL-EGFP/SMA-DsRed dual reporter mice, structures that are COL-EGFP+ but SMA-DsRed wrap the vessels. DiD-labeled red blood cells (DiD-RBC) were injected i.v. to visualize blood flow. Representative images are shown from two out of three independent longitudinal experiments performed using Cerulean-expressing MC57, Pro4L, and MC38 (n = 1 mouse each). The host was Rag−/− for the MC57 and Pro4L tumors.
Fig. S8.
Fig. S8.
Most type I collagen-expressing cells locate near endothelial cells in established tumors. MC38 and MC57 cancer cells were injected into COL-EGFP Rag−/− transgenic mice. When tumors were established (2–3 wk), mice were killed and the tumors were processed for CD31 and EGFP two-color immunohistochemistry on frozen sections; 10× magnification images were subjected to automated analysis using Fiji software to determine the distance of each COL-EGFP+ cell (red) to a CD31+ endothelial cell (brown), as detailed in SI Experimental Procedures. Three categories were established according to whether a COL-EGFP+ cell was touching, associated with (i.e., at a distance of less than 6.5 μm from a CD31+ cell), or not associated with a CD31+ endothelial cell. Two representative images are shown in A, with examples of COL-EGFP+ cells in each category. (B) Quantified data from three independent tumors: two MC38 tumors and one MC57 tumor. Two tumor sections (slides) were quantified per tumor. The number of COL-EGFP+ cells analyzed per slide was between 72 and 176. The majority (more than 50%) of COL-EGFP+ cells were found to be touching or associated with CD31+ cells within each tumor slide. Binomial test P values were as follows: MC38: mouse 1: P = 0.00147, P = 0.00046; mouse 2: P = 0.00000, P = 0.00000; MC57: P = 0.00000, P = 0.00000.

Similar articles

Cited by

References

    1. Metchnikoff E. Leçons sur la pathologie comparée de l’inflammation. Faites à l’Institut Pasteur en Avril et Mai 1891. Masson; Paris: 1892.
    1. Maximov A. Culture of blood leukocytes. From lymphocytes and monocytes to connective tissue. Arch Exp Zellforsch. 1928;5:169–268.
    1. Friedenstein A. Stromal-hematopoietic interrelationships: Maximov’s ideas and modern models. Haematol Blood Transfus. 1989;32:159–167. - PubMed
    1. Bucala R, Spiegel LA, Chesney J, Hogan M, Cerami A. Circulating fibrocytes define a new leukocyte subpopulation that mediates tissue repair. Mol Med. 1994;1(1):71–81. - PMC - PubMed
    1. Labat ML, et al. Cystic fibrosis: Production of high levels of uromodulin-like protein by HLA-DR blood monocytes differentiating towards a fibroblastic phenotype. Biomed Pharmacother. 1991;45(9):387–401. - PubMed

Publication types

LinkOut - more resources