. 2016 Sep;6(9):1006-21.
doi: 10.1158/2159-8290.CD-16-0164. Epub 2016 Jun 16.

Oncogenic Deregulation of EZH2 as an Opportunity for Targeted Therapy in Lung Cancer

Affiliations

Oncogenic Deregulation of EZH2 as an Opportunity for Targeted Therapy in Lung Cancer

Haikuo Zhang et al. Cancer Discov. 2016 Sep.

Abstract

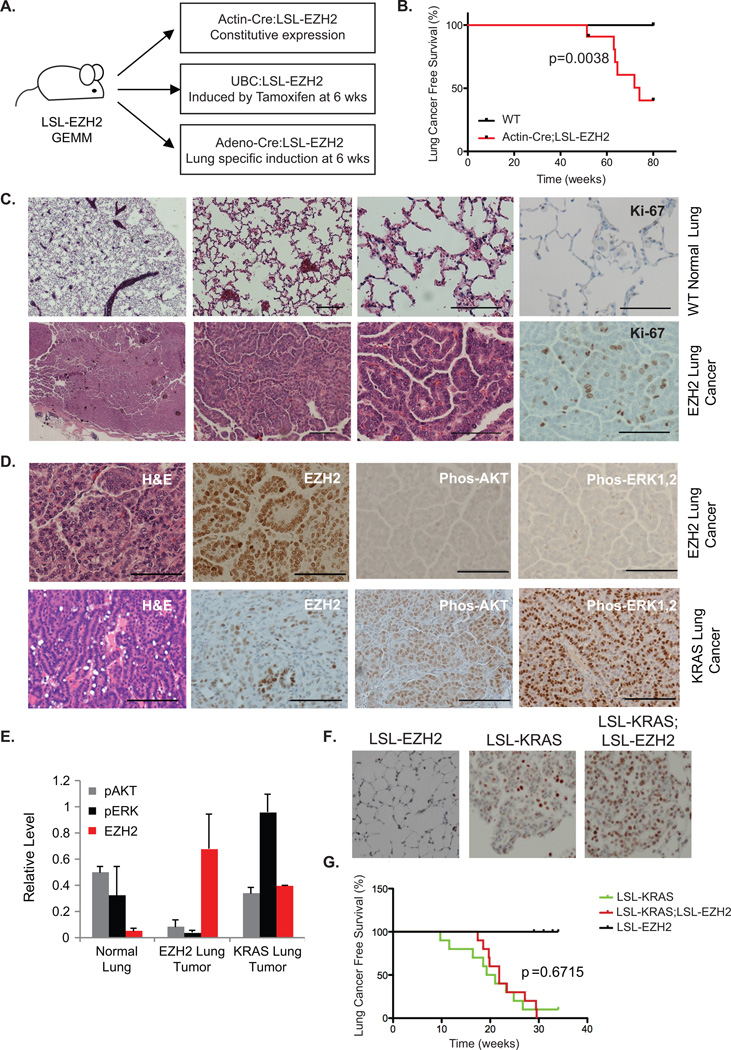
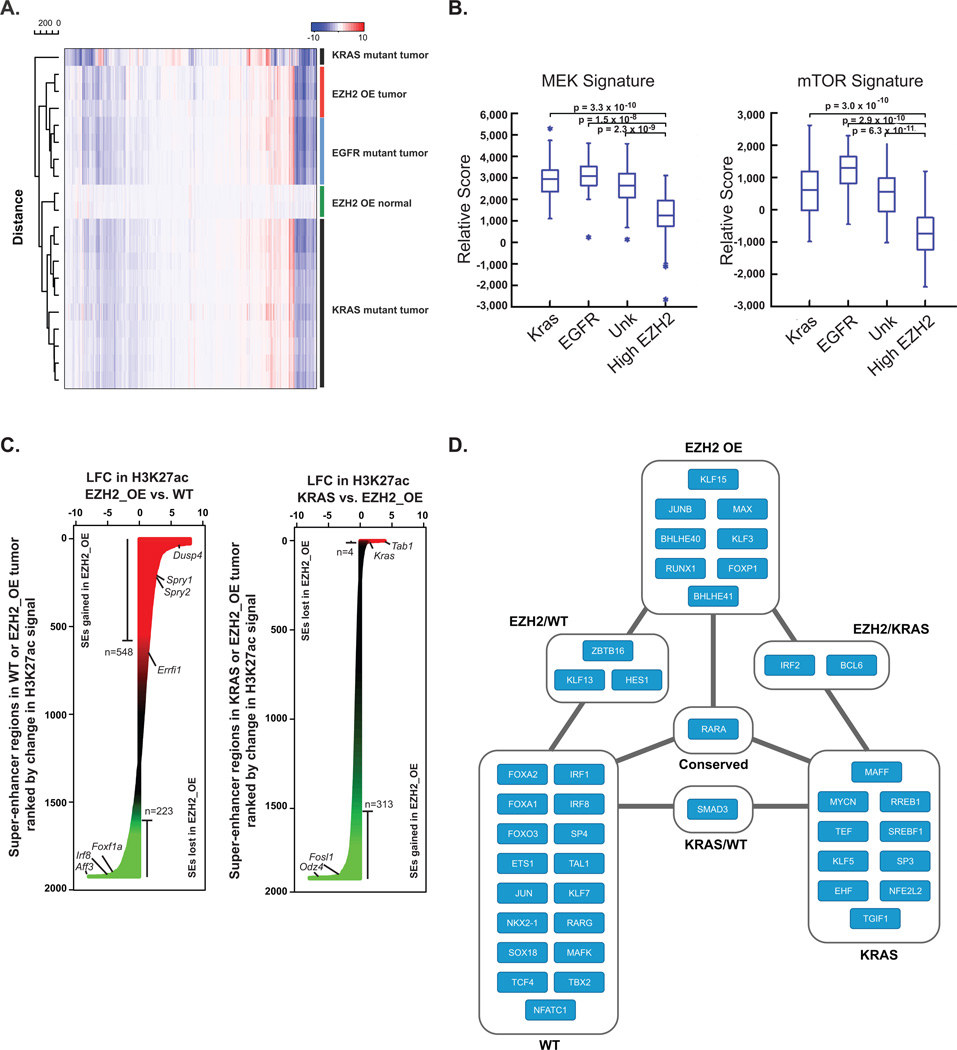
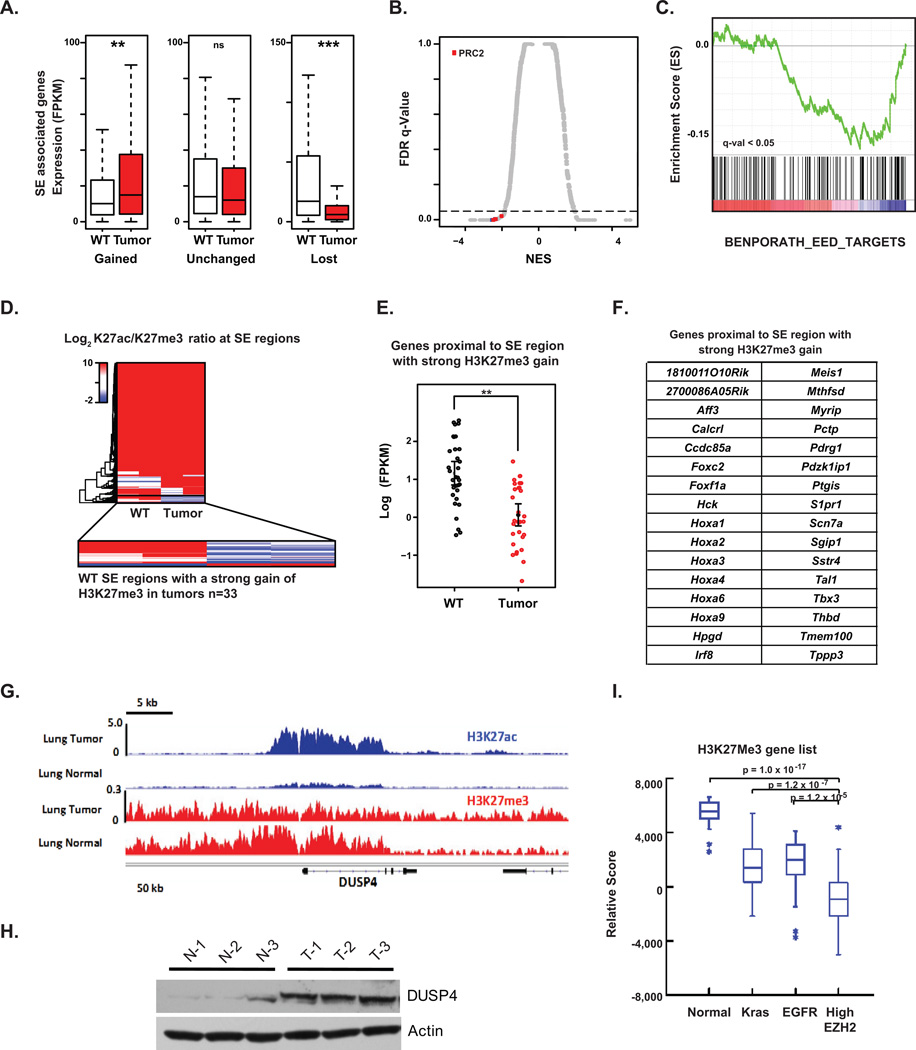
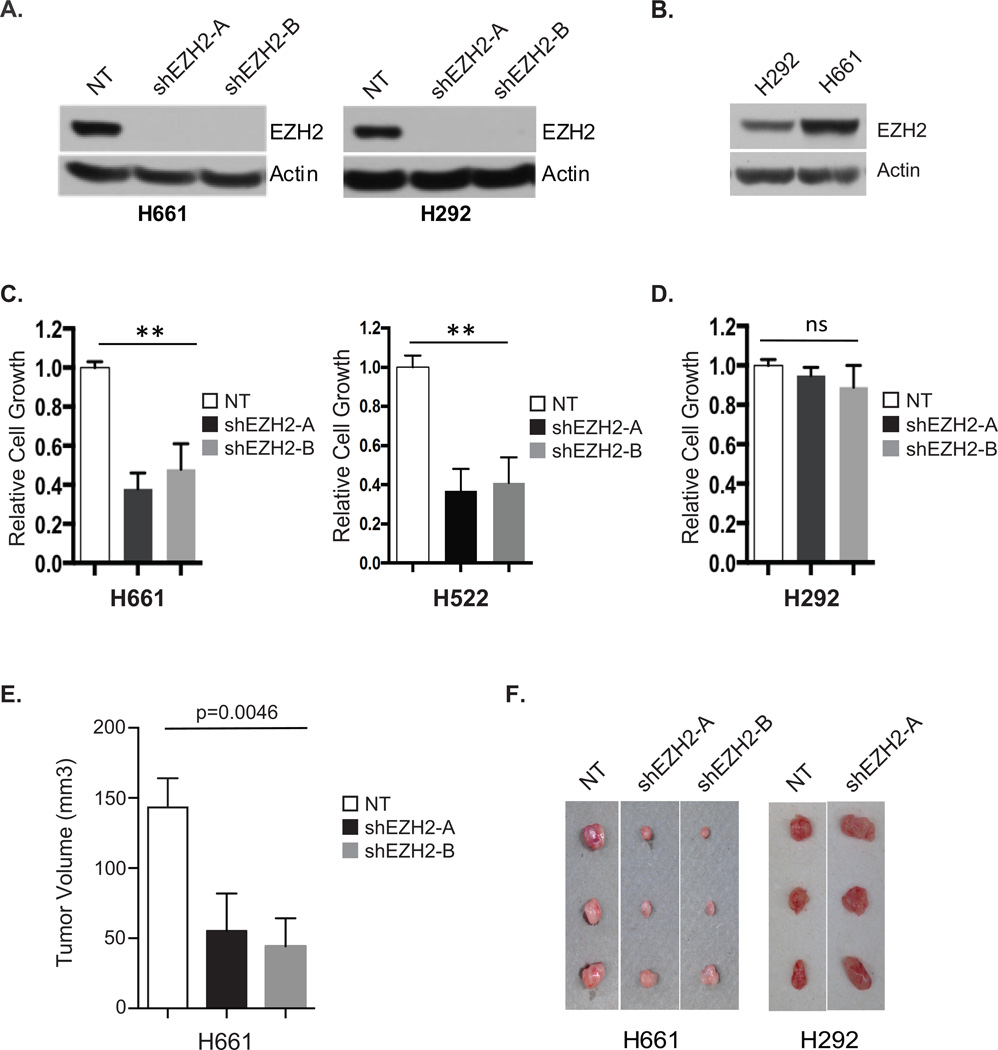
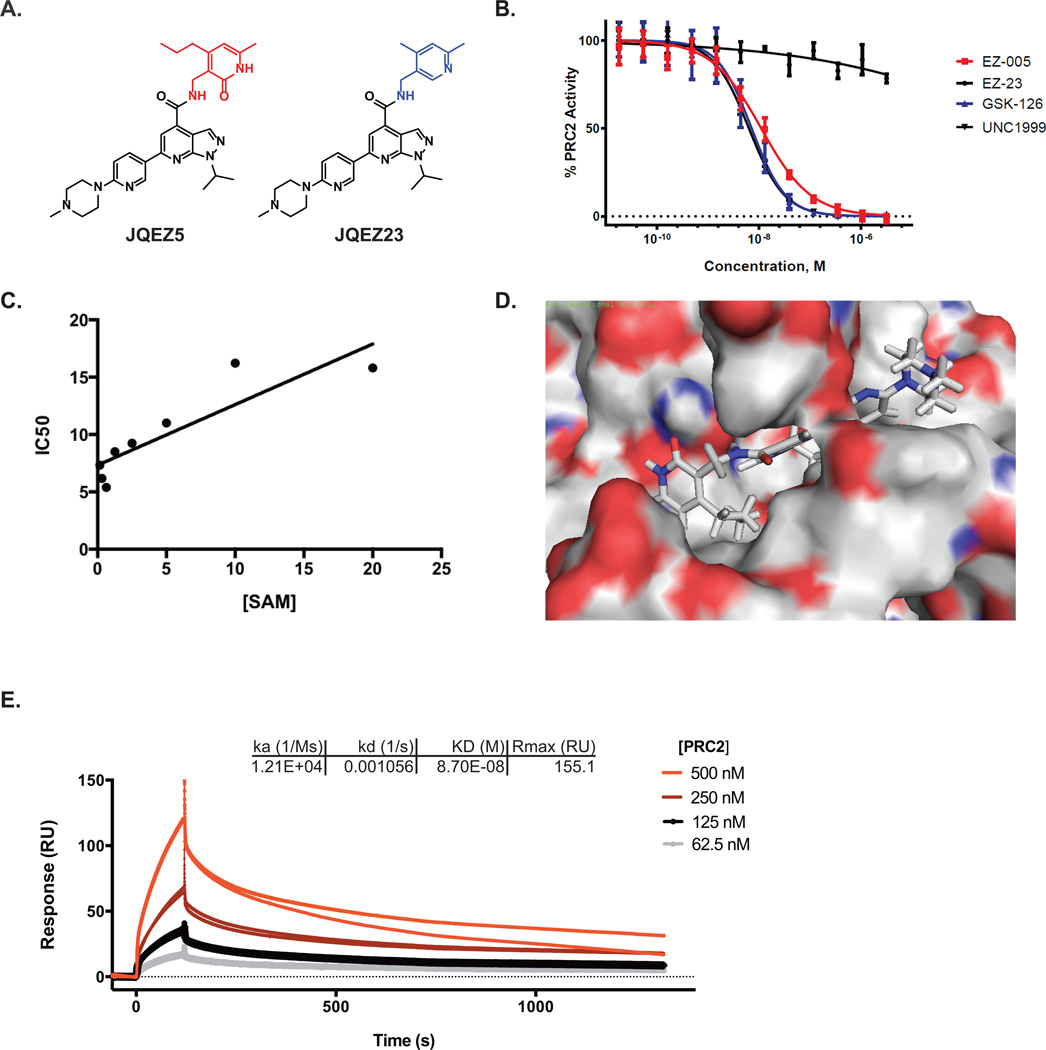
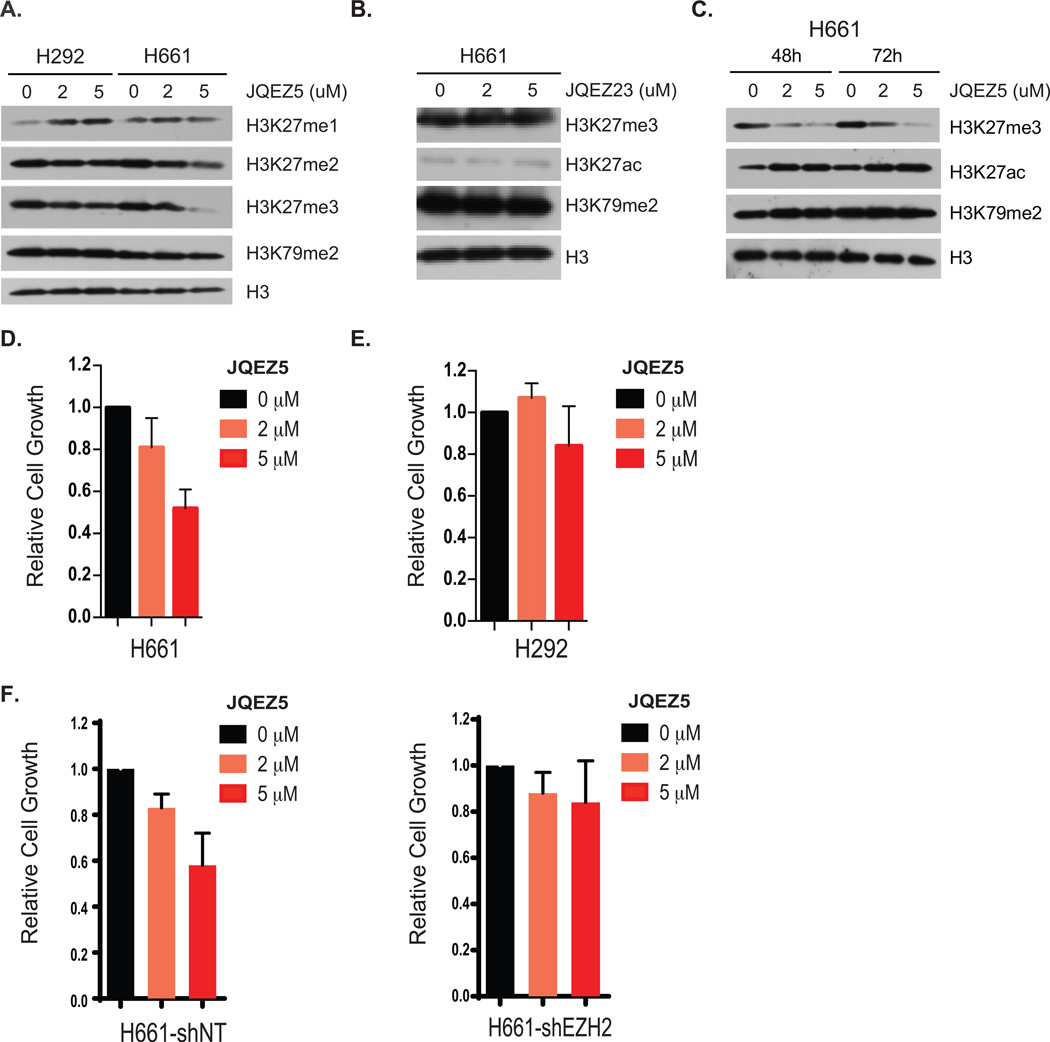
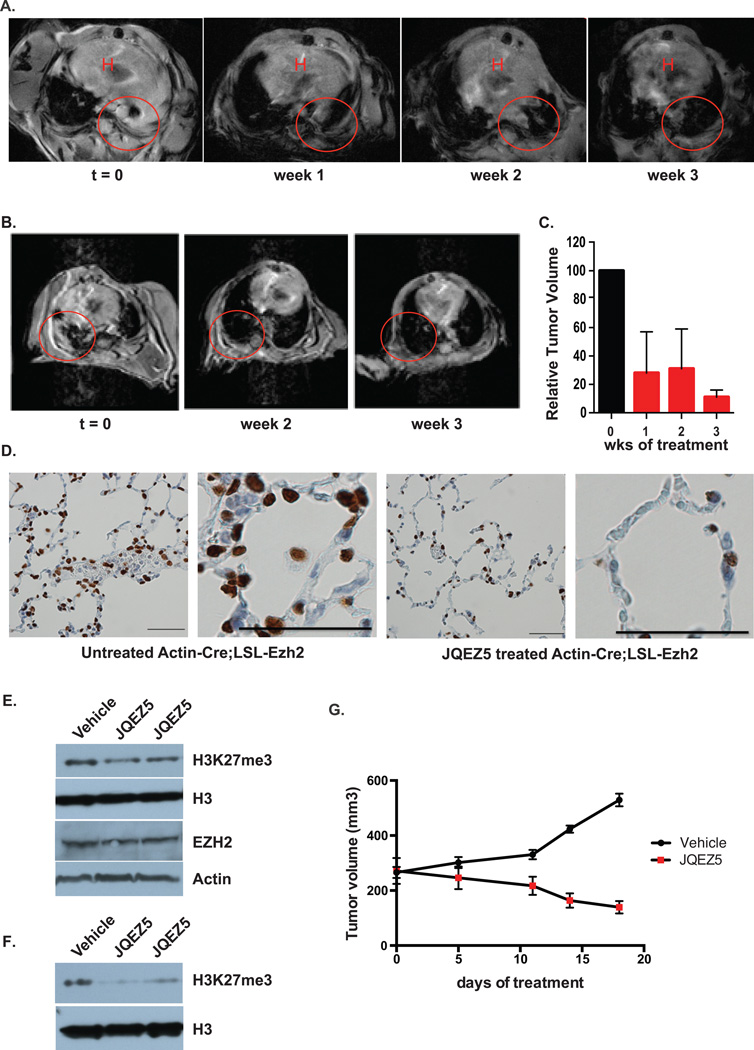
As a master regulator of chromatin function, the lysine methyltransferase EZH2 orchestrates transcriptional silencing of developmental gene networks. Overexpression of EZH2 is commonly observed in human epithelial cancers, such as non-small cell lung carcinoma (NSCLC), yet definitive demonstration of malignant transformation by deregulated EZH2 remains elusive. Here, we demonstrate the causal role of EZH2 overexpression in NSCLC with new genetically engineered mouse models of lung adenocarcinoma. Deregulated EZH2 silences normal developmental pathways, leading to epigenetic transformation independent of canonical growth factor pathway activation. As such, tumors feature a transcriptional program distinct from KRAS- and EGFR-mutant mouse lung cancers, but shared with human lung adenocarcinomas exhibiting high EZH2 expression. To target EZH2-dependent cancers, we developed a potent open-source EZH2 inhibitor, JQEZ5, that promoted the regression of EZH2-driven tumors in vivo, confirming oncogenic addiction to EZH2 in established tumors and providing the rationale for epigenetic therapy in a subset of lung cancer.

Significance: EZH2 overexpression induces murine lung cancers that are similar to human NSCLC with high EZH2 expression and low levels of phosphorylated AKT and ERK, implicating biomarkers for EZH2 inhibitor sensitivity. Our EZH2 inhibitor, JQEZ5, promotes regression of these tumors, revealing a potential role for anti-EZH2 therapy in lung cancer. Cancer Discov; 6(9); 1006-21. ©2016 AACR.See related commentary by Frankel et al., p. 949This article is highlighted in the In This Issue feature, p. 932.


Conflict of interest statement

P.K.R. is a consultant to Selecta Biosciences Inc, Watertown, MA. J.E.B. is a Scientific Founder of SHAPE Pharmaceuticals, Acetylon Pharmaceuticals, Tensha Therapeutics and C4 Therapeutics and is the inventor on IP licensed to these entities. J.E.B. currently an employee of Novartis Institutes of Biomedical Research.

Figures

Figure 1
Figure 1. EZH2 Overexpression Induces Murine Lung Cancer
(A) Schematic depiction of LSL-EZH2 genetically engineered mouse model utilizing 3 different strategies to express Cre recombinase to induce EZH2 overexpression. (B) Kaplan–Meier lung cancer-free survival summary plot for Actin-Cre:LSL-EZH2 transgenic mice (EZH2) versus wildtype mice (WT). (C) Histology of wildtype lung (top) and EZH2-induced lung adenocarcinomas (bottom) Sections stained with hematoxylin and eosin (H&E) or immunostained for Ki-67. Scale bar=50µm. (D) H&E staining or immunostaining for EZH2, p-AKT, and p-ERK1/2 in EZH2-induced mouse lung tumors (top) and KRAS-induced mouse lung tumors (bottom). Scale bar=50µm. (E) Relative protein expression levels of p-AKT, p-ERK1,2 and EZH2 in normal, EZH2-induced, and KRAS-induced tumor lung tissues measured by Western blot and quantified with ImageJ. n=3 for normal lung and EZH2-induced tumor, n=2 for KRAS-induced tumor. (F) Indicated mice were sacrificed 6 weeks post Cre-induction for immunostaining for EZH2. (G) Kaplan–Meier lung cancer-free survival summary plot for the indicated mice.
Figure 2
Figure 2. EZH2-Driven Lung Cancer as a Molecularly Distinct Entity
(A) Heatmap of log2 fold-change (LFC) gene expression in murine EZH2-overexpressing (OE) normal lungs (green), KRAS-mutant lung tumors (black), EGFR-mutant lung tumors (blue), and EZH2-OE lung tumors (red). All genes were selected across all samples for clustering. (B) Box plot of ssGSEA comparing the enrichment of a MEK (left) and mTOR (right) gene sets in human TCGA lung adenocarcinomas with specific driver mutations (KRAS, EGFR, unknown) or high EZH2 levels. (C) Waterfall plot showing rank-ordered change in H3K27ac signal at SE-containing regions between mouse WT lung and EZH2_OE (left), and KRAS and EZH2_OE (right). X-axis depicts the LFC in H3K27ac signal. SEs are ranked by LFC in signal with regions gaining the most H3K27ac in tumor at the top. (D) Core transcriptional regulatory circuitry in murine wildtype (WT) and tumor lung tissues (EZH2- or KRAS-driven) as defined by ChIP-seq for H3K27ac. Nodes are TFs that are associated with an SE. Edges indicate a regulatory interaction between two TFs as defined by an enrichment of TF binding motifs in the respective SE.
Figure 3
Figure 3. EZH2 Overexpression Establishes a Unique and Conserved Super Enhancer-Associated Transcriptional Landscape
(A) Box plot of RNA-seq expression in units of FPKM of murine genes associated with SEs that are gained (1812 genes), unchanged (4421 genes), or lost (432 genes) in tumor versus WT lung tissues. Significance was calculated using a two-tailed t test. ** p<2e–4, *** p <2e–6 (B) Scatter plot of normalized enrichment score (NES) versus false discovery rate (FDR) q-value comparing MSigDB curated gene set enrichment in murine tumor versus WT SE-associated genes. X-axis shows NES for evaluated gene sets. Y-axis shows false FDR q-value for each gene set. Gene sets upregulated in tumors have a high positive NES, while downregulated gene sets have a negative NES. Dotted line indicates significance cutoff q-value of 0.05. Red dots indicate PRC2 associated signatures, n = 8. (C) SE-associated gene set enrichment analysis showing downregulation of EED targets in murine tumor versus WT tissues from RNA-seq analysis. (D) Heatmap of LFC in H3K27ac over H3K27me3 signals at SE-containing regions. Blue regions indicate SEs with strong gains of H3K27me3 in tumor versus WT, while red regions indicate those with strong losses. (E) Dot plot of RNA-seq expression in units of log10 FPKM for genes proximal to SE regions with a strong gain of H3K27me3 in murine tumor versus WT. Significance was calculated with a two-tailed t test. **p<1e–5. (F) 32 mouse genes proximal to SE regions with strong H3K27me3 gain in EZH2-overexpressing tumors. (G) Gene tracks of ChIP-seq signals in units of rpm/bp for H3K27ac and H3K27me3 at the DUSP4 locus in either murine WT or tumor lung tissues. (H) Western blot analysis of lysates prepared from murine normal lung (N-1, N-2 and N-3) and lung tumor (T-1, T-2 and T-3) samples. (I) Box plot of ssGSEA comparing the enrichment of our mouse H3K27me3 gene set in human TCGA lung adenocarcinomas with high EZH2 levels and normal lung tissue. The H3K27me3 gene set is comprised of the 32 mouse genes proximal to SE regions with strong H3K27me3 gain in murine EZH2-overexpressing tumors.
Figure 4
Figure 4. A Subset of Human NSCLC Cells are Dependent on EZH2 Overexpression
(A) Human NSCLC H661 (left) and H292 (right) cells expressing non-targeting control shRNA (NT) or two different shRNAs targeting EZH2 (shEZH2-A and shEZH2-B) were analyzed for EZH2 expression by Western blotting. (B) Western blots comparing EZH2 expression levels between human NSCLC cell lines H661 and H292. (C–D) Relative cell growth of H661, H522 (C) or H292 (D) cells expressing non-targeting control shRNA (NT) or two different shRNAs targeting EZH2 (shEZH2-A and shEZH2-B) was measured by MTS assay. Error bars represent S.E.M., n= 3. ** p < 0.001. (E–F) Human NSCLC cell lines, H661 and H292, infected with lentivirus containing control (NT) or shEZH2 (shEZH2-A and shEZH2-B) were subcutaneously injected into the flank of nude mice. When the biggest tumor reached approximately 150 mm3, mice were euthanized and tumors were quantified relative to shNT tumor size (E) and documented (F). Mean ± SEM, n=3/treatment.
Figure 5
Figure 5. Small Molecule EZH2 Inhibitor Development
(A) Chemical structures of small molecule EZH2 inhibitor, JQEZ5, and negative control compound, JQEZ23. (B) Small molecule inhibitory activity of JQEZ5, JQEZ23, GSK-126 and UNC1999 were measured in a five-component PRC2 complex radiometric Scintillation Proximity Assay (SPA) using radiolabeled S-adenosyl methionine (SAM). (C) The IC50 of JQEZ5 as measured with increasing SAM concentrations to confirm its SAM competitive binding activity. (D) Computational docking model of JQEZ5 binding to EZH2 using reported model. (E) Biacore SPR sensorgram from single-cycle kinetics runs with four concentrations of the PRC2 five component complex. A biotinylated derivative of JQEZ5, JQEZ6, was immobilized on streptavidin SPR chip. The affinity (KD) of PRC2 for JQEZ6 was determined to be 87 nM.
Figure 6
Figure 6. JQEZ5 Inhibits Lung Cancer Growth of EZH2 Overexpressed Human Lung Cancer Cell
(A) H661 and H292 human lung cancer cells were incubated with increasing concentrations of JQEZ5. Cell lysates were prepared and subjected to SDS-PAGE and analysis by Western blotting with the indicated antibodies. (B) Western blots of methylation levels in human lung cancer cell line H661, 72h after treatment with increasing concentrations of JQEZ23. H3 is a loading control. (C) Western blots of methylation levels in H661 human lung cancer cell line after 48 h or 72 h of treatment with increasing concentrations of JQEZ5. H3 is a loading control. (D) H661 and (E) H292 human lung cancer cells were incubated with increasing concentrations of JQEZ5 and relative cell growth was assessed by MTS assay. Error bars represent SD, n=3. (F) H661 cells infected with lentivirus containing control (NT) or shEZH2 were incubated with increasing concentrations of JQEZ5 and relative cell growth was assessed by MTS assay. Error bars represent SD, n=3.
Figure 7
Figure 7. JQEZ5 Inhibits Lung Cancer Growth In Vivo
(A–B) MRI scans of individual tumor-bearing Actin-Cre;LSL-EZH2 mice (t=0) and after 1–3 weeks of treatment with JQEZ5 at 75mpk, daily. Lung tumor is indicated by the red circle. H, Heart. (C) Quantification of relative tumor volume of mouse lungs based on MRIs using 3D Slicer. Relative tumor volume was compared before and after 3 weeks of JQEZ5 treatment (mean ± SEM, n=2). (D) Tumor-bearing Actin-Cre;LSL-EZH2 mice were untreated or treated with JQEZ5 at 75mpk for three weeks. Lung sections were prepared and immunostained for H3K27me3. Bar represents 50µm. (E) Nude mice were injected subcutaneously with 2×10⁶ H661 human NSCLC cells. When tumors reached ~200 mm3, mice were randomized and treated with vehicle or JQEZ5 (75 mg/kg/d, i.p.) for 18 days. Western blots analysis was performed on tumors following either vehicle or JQEZ5 treatment for 18 days. (F) Western blots analysis of lung tissue from mice after 18 days of treatment with vehicle or JQEZ5 at 75 mpk. (G) Tumor volume from mouse xenograft model of human lung cancer was measured by caliper (mean ± SEM, n=3/vehicle, n=6/JQEZ5).

Comment in

Similar articles

Cited by

References

    1. Jemal A, Bray F, Center MM, Ferlay J, Ward E, Forman D. Global cancer statistics. CA Cancer J Clin. 2011;61(2):69–90. - PubMed
    1. Chen Z, Fillmore CM, Hammerman PS, Kim CF, Wong KK. Non-small-cell lung cancers: a heterogeneous set of diseases. Nat Rev Cancer. 2014;14(8):535–546. - PMC - PubMed
    1. Lynch TJ, Bell DW, Sordella R, Gurubhagavatula S, Okimoto RA, Brannigan BW, et al. Activating mutations in the epidermal growth factor receptor underlying responsiveness of non-small-cell lung cancer to gefitinib. New England Journal of Medicine. 2004;350(21):2129–2139. - PubMed
    1. Paez JG, Janne PA, Lee JC, Tracy S, Greulich H, Gabriel S, et al. EGFR mutations in lung cancer: Correlation with clinical response to gefitinib therapy. Science. 2004;304(5676):1497–1500. - PubMed
    1. Pao W, Miller V, Zakowski M, Doherty J, Politi K, Sarkaria I, et al. EGF receptor gene mutations are common in lung cancers from "never smokers" and are associated with sensitivity of tumors to gefitinib and erlotinib. Proceedings of the National Academy of Sciences of the United States of America. 2004;101(36):13306–13311. - PMC - PubMed

Publication types

MeSH terms