. 2016 Jun 16;17(1):128.
doi: 10.1186/s13059-016-0994-0.

OncodriveFML: a general framework to identify coding and non-coding regions with cancer driver mutations

Affiliations

OncodriveFML: a general framework to identify coding and non-coding regions with cancer driver mutations

Loris Mularoni et al. Genome Biol. .

Abstract

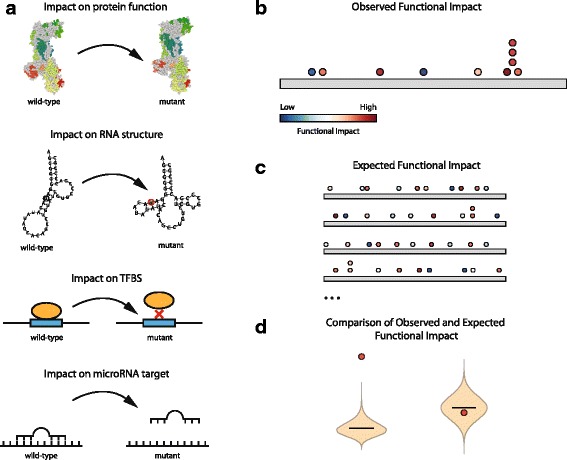
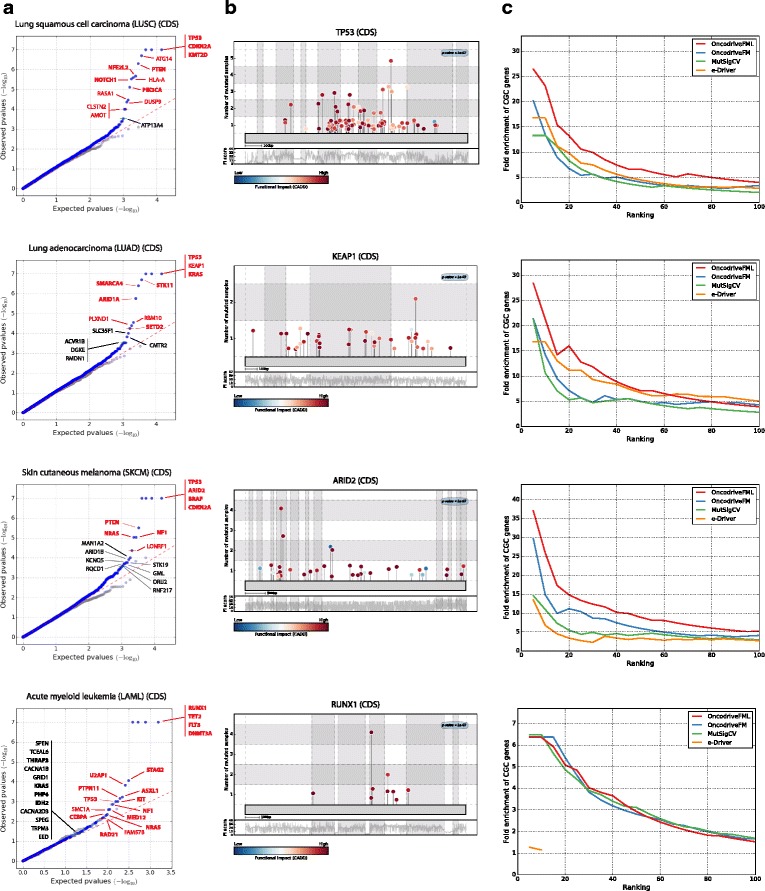
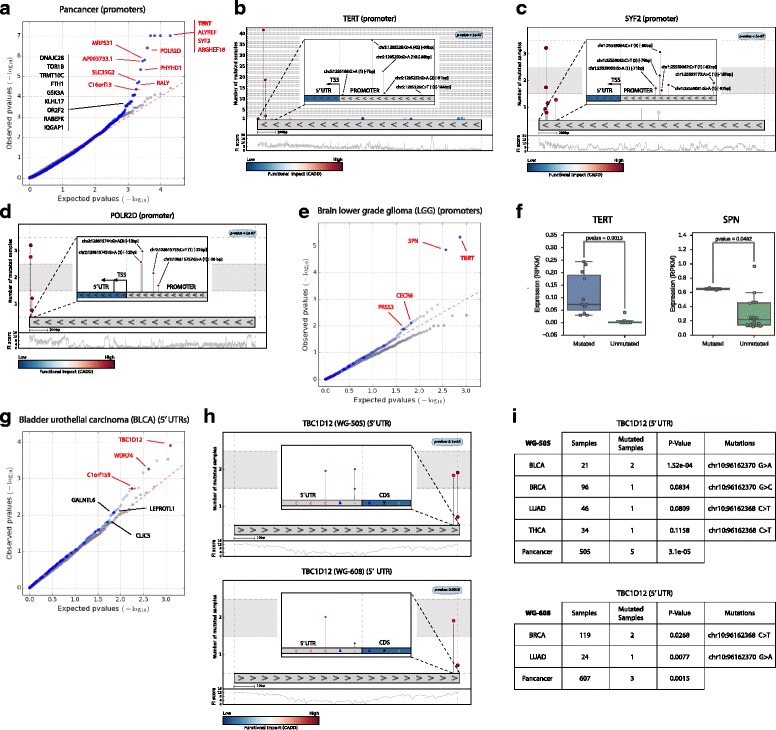
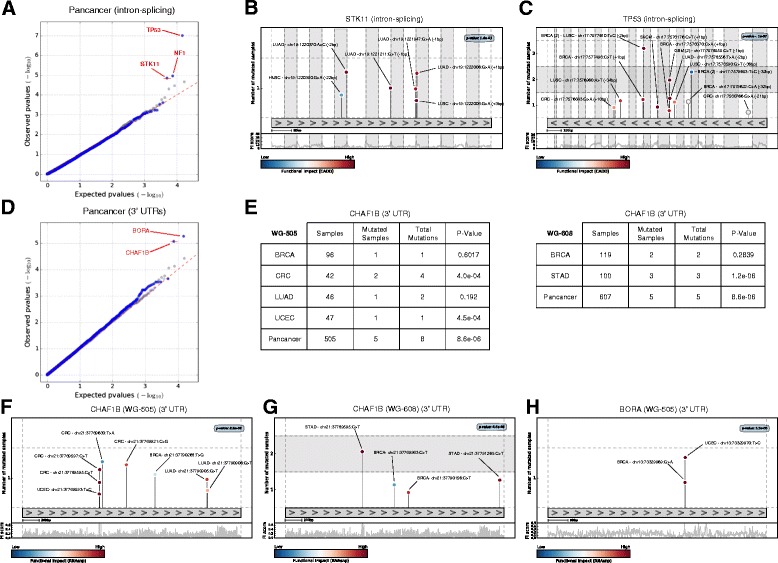
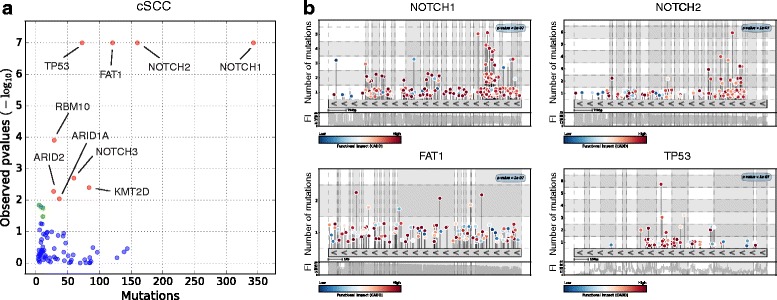
Distinguishing the driver mutations from somatic mutations in a tumor genome is one of the major challenges of cancer research. This challenge is more acute and far from solved for non-coding mutations. Here we present OncodriveFML, a method designed to analyze the pattern of somatic mutations across tumors in both coding and non-coding genomic regions to identify signals of positive selection, and therefore, their involvement in tumorigenesis. We describe the method and illustrate its usefulness to identify protein-coding genes, promoters, untranslated regions, intronic splice regions, and lncRNAs-containing driver mutations in several malignancies.

Keywords: Cancer drivers; Local functional mutations bias; Non-coding drivers; Non-coding regions.


Figures

Fig. 1
Fig. 1
The OncodriveFML approach to detect signals of positive selection. a The functional impact (FI) of mutations may be computed in different manners for different types of genomic elements. b The FI of somatic mutations occurring in a genomics element across tumors are computed. c Mutation sets are randomly sampled from the element under analysis and the FI score of each simulated mutation is obtained. d The mean FI of the mutations observed in the element (red dots) is compared to the distribution of FI means of randomly generated mutations (violin plots) to obtain an empirical p value. On the left is shown an example of highly significant p value while the violin plot on the right illustrates a non-significant case
Fig. 2
Fig. 2
Results of the application of OncodriveFML to identify driver protein-coding genes across four cohorts of tumors. a Quantile-quantile (QQ) plots comparing the expected and observed distribution of FM bias p values of genes. Gray dots denote p values obtained on the randomized dataset that serves as negative control. Names in red indicate genes with FM bias q-value below 0.1, while names in black indicate genes with FM bias q-value below 0.25. Names in bold denote genes annotated in the Cancer Gene Census (CGC). b Mutation needle-plots showing the distribution of mutations along the sequences of the CDS of selected genes. The color of the circles follows the FI CADD score scale. The y-axis indicates the number of tumor samples in the cohorts where mutations at each position have been observed. The behavior of the CADD FI score across the entire CDS is shown below the needle-plot. c Fold increase in the proportion of CGC genes among sets with increasing number of top ranking genes detected by four methods: OncodriveFML, OncodriveFM, MutSigCV, and e-Driver. (See details in the text.) QQ plots and fold CGC proportion increase graphs for other 15 cohorts of tumors are available in Additional file 2, section A
Fig. 3
Fig. 3
Results of the application of OncodriveFML to identify driver promoters and 5′ UTRs. The results of OncodriveFML are illustrated on mutations found across the pan-cancer cohort (ad) and the cohorts of lower grade gliomas (e, f) and bladder urothelial carcinomas (gi) of the WG-505 dataset. a, e, g QQ plots comparing the expected and observed distribution of FM bias p values of promoters and 5′ UTRs mutated in the respective cohorts. bd, h Mutation needle-plots of selected promoters and 5′ UTRs, with a zoom at mutations located in the proximity of the transcription start site (TSS), or the 5 bps of the 5′ UTR closer to the CDS, respectively. f Comparison of the expression of two genes with significantly FM biased promoters in the cohort of lower grade gliomas in samples with mutations in the promoter and unmutated samples. In the boxplots the gene expressions of the mutated samples (on the left) is compared to those of unmutated samples (on the right). The expression values are reported in RPKM (Reads Per Kilobase of transcript per Million mapped reads) on the y-axis and the number of samples (mutated and normal) in each set are indicated with dots on the boxplots. The significance of the differential expression between mutated and non-mutated samples is reported at the top of each plot (Wilcoxon rank-sum test). I. Significance of the 5′ UTR of the TBC1D12 gene across several cohorts of both the WG-505 and WG-608 datasets
Fig. 4
Fig. 4
Results of the application of OncodriveFML to identify driver splice intronic regions and 3′ UTRs. The results of OncodriveFML are illustrated on mutations found across the pan-cancer cohort of the WG-505 dataset. a, d QQ plots comparing the expected and observed distribution of FM bias p values of splice intronic regions and 3′ UTRs mutated in the pan-cancer cohort. b, c, fh Mutation needle-plots of selected splice intronic regions and 3′ UTRs. e Significance of the 3′ UTR of the CHAF1B gene across several cohorts of both the WG-505 and WG-608 datasets
Fig. 5
Fig. 5
Results of the application of OncodriveFML to the somatic mutations identified in a panel of genes in 234 biopsies of normal skin. a p value vs. number of mutations of the 74 genes sequenced in the panel. Genes identified as significant with a q-value <0.1 (red dots) are indicated by their name while genes identified as significant with a q-value <0.25 are marked as green dots. b Mutation needle-plots of the most significant genes

Similar articles

Cited by

  • Genomic landscape of adult testicular germ cell tumours in the 100,000 Genomes Project.
    Ní Leathlobhair M, Frangou A, Kinnersley B, Cornish AJ, Chubb D, Lakatos E, Arumugam P, Gruber AJ, Law P, Tapinos A, Jakobsdottir GM, Peneva I, Sahli A, Smyth EM, Ball RY, Sylva R, Benes K, Stark D, Young RJ, Lee ATJ, Wolverson V, Houlston RS, Sosinsky A, Protheroe A, Murray MJ, Wedge DC, Verrill C; Testicular Cancer Genomics England Clinical Interpretation Partnership Consortium; Genomics England Research Consortium. Ní Leathlobhair M, et al. Nat Commun. 2024 Oct 26;15(1):9247. doi: 10.1038/s41467-024-53193-6. Nat Commun. 2024. PMID: 39461959 Free PMC article.
  • The genomic landscape of 2,023 colorectal cancers.
    Cornish AJ, Gruber AJ, Kinnersley B, Chubb D, Frangou A, Caravagna G, Noyvert B, Lakatos E, Wood HM, Thorn S, Culliford R, Arnedo-Pac C, Househam J, Cross W, Sud A, Law P, Leathlobhair MN, Hawari A, Woolley C, Sherwood K, Feeley N, Gül G, Fernandez-Tajes J, Zapata L, Alexandrov LB, Murugaesu N, Sosinsky A, Mitchell J, Lopez-Bigas N, Quirke P, Church DN, Tomlinson IPM, Sottoriva A, Graham TA, Wedge DC, Houlston RS. Cornish AJ, et al. Nature. 2024 Sep;633(8028):127-136. doi: 10.1038/s41586-024-07747-9. Epub 2024 Aug 7. Nature. 2024. PMID: 39112709 Free PMC article.
  • MutSpot: detection of non-coding mutation hotspots in cancer genomes.
    Guo YA, Chang MM, Skanderup AJ. Guo YA, et al. NPJ Genom Med. 2020 Jun 5;5:26. doi: 10.1038/s41525-020-0133-4. eCollection 2020. NPJ Genom Med. 2020. PMID: 32550006 Free PMC article.
  • Position-dependent function of human sequence-specific transcription factors.
    Duttke SH, Guzman C, Chang M, Delos Santos NP, McDonald BR, Xie J, Carlin AF, Heinz S, Benner C. Duttke SH, et al. Nature. 2024 Jul;631(8022):891-898. doi: 10.1038/s41586-024-07662-z. Epub 2024 Jul 17. Nature. 2024. PMID: 39020164 Free PMC article.
  • Experimental identification of cancer driver alterations in the era of pan-cancer genomics.
    Korenjak M, Zavadil J. Korenjak M, et al. Cancer Sci. 2019 Dec;110(12):3622-3629. doi: 10.1111/cas.14210. Epub 2019 Oct 31. Cancer Sci. 2019. PMID: 31594033 Free PMC article. Review.

References

    1. Weinstein JN, Collisson EA, Mills GB, Shaw KRM, Ozenberger BA, Ellrott K, et al. The Cancer Genome Atlas Pan-Cancer analysis project. Nat Genet. 2013;45:1113–20. doi: 10.1038/ng.2764. - DOI - PMC - PubMed
    1. ICGC International network of cancer genome projects. Nature. 2010;464:993–8. doi: 10.1038/nature08987. - DOI - PMC - PubMed
    1. Gonzalez-Perez A, Mustonen V, Reva B, Ritchie GRS, Creixell P, Karchin R, et al. Computational approaches to identify functional genetic variants in cancer genomes. Nat Methods. 2013;10:723–9. doi: 10.1038/nmeth.2562. - DOI - PMC - PubMed
    1. Lawrence MS, Stojanov P, Polak P, Kryukov GV, Cibulskis K, Sivachenko A, et al. Mutational heterogeneity in cancer and the search for new cancer-associated genes. Nature. 2013;499:214–8. doi: 10.1038/nature12213. - DOI - PMC - PubMed
    1. Gonzalez-Perez A, Lopez-Bigas N. Functional impact bias reveals cancer drivers. Nucleic Acids Res. 2012;40:e169. doi: 10.1093/nar/gks743. - DOI - PMC - PubMed

Publication types

Substances