Analysis of Immune Signatures in Longitudinal Tumor Samples Yields Insight into Biomarkers of Response and Mechanisms of Resistance to Immune Checkpoint Blockade
- PMID: 27301722
- PMCID: PMC5082984
- DOI: 10.1158/2159-8290.CD-15-1545
Analysis of Immune Signatures in Longitudinal Tumor Samples Yields Insight into Biomarkers of Response and Mechanisms of Resistance to Immune Checkpoint Blockade
Abstract
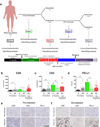
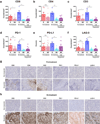
Immune checkpoint blockade represents a major breakthrough in cancer therapy; however, responses are not universal. Genomic and immune features in pretreatment tumor biopsies have been reported to correlate with response in patients with melanoma and other cancers, but robust biomarkers have not been identified. We studied a cohort of patients with metastatic melanoma initially treated with cytotoxic T-lymphocyte-associated antigen-4 (CTLA4) blockade (n = 53) followed by programmed death-1 (PD-1) blockade at progression (n = 46), and analyzed immune signatures in longitudinal tissue samples collected at multiple time points during therapy. In this study, we demonstrate that adaptive immune signatures in tumor biopsy samples obtained early during the course of treatment are highly predictive of response to immune checkpoint blockade and also demonstrate differential effects on the tumor microenvironment induced by CTLA4 and PD-1 blockade. Importantly, potential mechanisms of therapeutic resistance to immune checkpoint blockade were also identified.
Significance: These studies demonstrate that adaptive immune signatures in early on-treatment tumor biopsies are predictive of response to checkpoint blockade and yield insight into mechanisms of therapeutic resistance. These concepts have far-reaching implications in this age of precision medicine and should be explored in immune checkpoint blockade treatment across cancer types. Cancer Discov; 6(8); 827-37. ©2016 AACR.See related commentary by Teng et al., p. 818This article is highlighted in the In This Issue feature, p. 803.
©2016 American Association for Cancer Research.
Conflict of interest statement
No other potential conflicts of interest were disclosed.
Figures


Comment in
-
Checkpoint Immunotherapy: Picking a Winner.Cancer Discov. 2016 Aug;6(8):818-20. doi: 10.1158/2159-8290.CD-16-0694. Cancer Discov. 2016. PMID: 27485001
Similar articles
-
Checkpoint Immunotherapy: Picking a Winner.Cancer Discov. 2016 Aug;6(8):818-20. doi: 10.1158/2159-8290.CD-16-0694. Cancer Discov. 2016. PMID: 27485001
-
Immunotherapy for the treatment of breast cancer: checkpoint blockade, cancer vaccines, and future directions in combination immunotherapy.Clin Adv Hematol Oncol. 2016 Nov;14(11):922-933. Clin Adv Hematol Oncol. 2016. PMID: 27930644 Review.
-
Combination therapy with anti-CTLA-4 and anti-PD-1 leads to distinct immunologic changes in vivo.J Immunol. 2015 Feb 1;194(3):950-9. doi: 10.4049/jimmunol.1401686. Epub 2014 Dec 24. J Immunol. 2015. PMID: 25539810 Free PMC article.
-
Dynamic Changes in PD-L1 Expression and Immune Infiltrates Early During Treatment Predict Response to PD-1 Blockade in Melanoma.Clin Cancer Res. 2017 Sep 1;23(17):5024-5033. doi: 10.1158/1078-0432.CCR-16-0698. Epub 2017 May 16. Clin Cancer Res. 2017. PMID: 28512174
-
Hallmarks of response to immune checkpoint blockade.Br J Cancer. 2017 Jun 27;117(1):1-7. doi: 10.1038/bjc.2017.136. Epub 2017 May 18. Br J Cancer. 2017. PMID: 28524159 Free PMC article. Review.
Cited by
-
Dynamic profiling of immune microenvironment during anti-PD-1 immunotherapy for head and neck squamous cell carcinoma: the IPRICE study.BMC Cancer. 2023 Dec 8;23(1):1209. doi: 10.1186/s12885-023-11672-x. BMC Cancer. 2023. PMID: 38066522 Free PMC article. Clinical Trial.
-
A review on trends in development and translation of omics signatures in cancer.Comput Struct Biotechnol J. 2024 Feb 3;23:954-971. doi: 10.1016/j.csbj.2024.01.024. eCollection 2024 Dec. Comput Struct Biotechnol J. 2024. PMID: 38385061 Free PMC article. Review.
-
Modeling Pharmacokinetics and Pharmacodynamics of Therapeutic Antibodies: Progress, Challenges, and Future Directions.Pharmaceutics. 2021 Mar 21;13(3):422. doi: 10.3390/pharmaceutics13030422. Pharmaceutics. 2021. PMID: 33800976 Free PMC article. Review.
-
MHC heterogeneity and response of metastases to immunotherapy.Cancer Metastasis Rev. 2021 Jun;40(2):501-517. doi: 10.1007/s10555-021-09964-4. Epub 2021 Apr 15. Cancer Metastasis Rev. 2021. PMID: 33860434 Review.
-
Frontline Maintenance Treatment for Ovarian Cancer.Curr Oncol Rep. 2021 Jun 14;23(8):97. doi: 10.1007/s11912-021-01088-w. Curr Oncol Rep. 2021. PMID: 34125335 Free PMC article. Review.
References
-
- Andtbacka RH, Kaufman HL, Collichio F, Amatruda T, Senzer N, Chesney J, et al. Talimogene Laherparepvec Improves Durable Response Rate in Patients With Advanced Melanoma. J Clin Oncol. 2015;33:2780–2788. - PubMed
Publication types
MeSH terms
Substances
Grants and funding
LinkOut - more resources
Full Text Sources
Other Literature Sources
Miscellaneous

