. 2016 Jun 13;29(6):859-873.
doi: 10.1016/j.ccell.2016.05.002.

Inhibition of Dopamine Receptor D4 Impedes Autophagic Flux, Proliferation, and Survival of Glioblastoma Stem Cells

Affiliations

Inhibition of Dopamine Receptor D4 Impedes Autophagic Flux, Proliferation, and Survival of Glioblastoma Stem Cells

Sonam Dolma et al. Cancer Cell. .

Abstract

Glioblastomas (GBM) grow in a rich neurochemical milieu, but the impact of neurochemicals on GBM growth is largely unexplored. We interrogated 680 neurochemical compounds in patient-derived GBM neural stem cells (GNS) to determine the effects on proliferation and survival. Compounds that modulate dopaminergic, serotonergic, and cholinergic signaling pathways selectively affected GNS growth. In particular, dopamine receptor D4 (DRD4) antagonists selectively inhibited GNS growth and promoted differentiation of normal neural stem cells. DRD4 antagonists inhibited the downstream effectors PDGFRβ, ERK1/2, and mTOR and disrupted the autophagy-lysosomal pathway, leading to accumulation of autophagic vacuoles followed by G0/G1 arrest and apoptosis. These results demonstrate a role for neurochemical pathways in governing GBM stem cell proliferation and suggest therapeutic approaches for GBM.


Figures

Figure 1
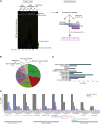
Figure 1. Identification of GNS-Selective Compounds
(A) An outline of the primary and secondary screens. Primary screen data are shown as growth inhibition of each compound (5 µM) across the six cell lines screened. Secondary screens were done in dose series to determine the fold selectivity (IC50 of BJ/IC50 of any NS or GNS with the lowest IC50). (B) Percentage of different neurochemical classes enriched in the total hits. (C) Percent activity (hits) of each neurochemical class. Number of hits/total number of compounds present in the library of each class. (D) The ten NS-selective compounds and their IC50 (µM) across different cell lines. The ten NS-selective compounds are grouped under their neurochemical classes. See also Tables S1 and S2.
Figure 2
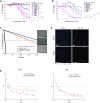
Figure 2. DRD4 Antagonists Are GNS Selective and Show Synergistic Effect with TMZ
(A) Percent cell viability of four non-NS control cell lines, three NS, and six GNS lines upon treatment with PNU 96415E in dilution series from 0.39 µM to 50 µM. Controls, n = 3, mean ± SEM; NS lines, n = 5–15, mean ± SEM; GNS lines, n = 3–12, mean ± SEM. (B) Percent cell viability of BJ, three NS, and five GNS lines upon treatment with L-741,742 in dilution series from 0.39 µM to 50 µM. BJ, n = 3, mean ± SEM; NS lines, n = 3–11, mean ± SEM; GNS lines, n = 3–7, mean ± SEM. (C) Linear regression plot of in vitro LDA for freshly dissociated patient tumor (GBM 686) treated with L-741,742 (10 µM), PNU 96415E (25 µM), and DMSO. Representative phase-contrast image of neurospheres at day 14 in a well seeded with 2,000 cells. Scale bars, 100 µm. (D) Immunofluorescence staining for VGlut1, βIII-tubulin, and DAPI in NS (hf5205 and hf6539) differentiated in DMSO and L-741,742 for 3 weeks. Scale bars, 100 µm. (E) Combination index plot for TMZ with L-741,742 or PNU 96415E in GNS. Combination index (CI) plotted against fractions affected (Fa) analyzed using COMPUSYN. See also Figure S1.
Figure 3
Figure 3. Primary GBM and GNS Express Functional DRD4 Receptor
(A and B) Western blot analysis for anti-DRD4 and anti-β actin across different NS and GNS lines (A) and primary GBM patient tumor samples (B). (C) Immunohistochemistry staining for DRD4 in patient tumor sample (GBM 742). Scale bars, 100 µm. (D) Fold change of cAMP levels in G362 cells treated with forskolin (30 µM) alone and pretreatment with DRD4-specific agonist A412997 (30 µM) followed by forskolin treatment. n = 3, mean ± SEM. (E) Western blot analysis for anti-DRD4 and anti-β actin in G362 cells 72 hr after transiently transfected with sh-DRD4 and sh-eGFP. (F) Cell viability assay (Alamar blue) for G362 cells transiently transfected with sh-DRD4 and sh-eGFP measured over 5 days. n = 3, mean ± SEM. *p < 0.005, **p < 0.0005, unpaired one-tailed t test. (G) Percent growth inhibition of G362 cells transiently transfected with sh-DRD4 and sh-eGFP treated with L-741,742 for 3 days. n = 3, mean ± SD. See also Figure S2.
Figure 4
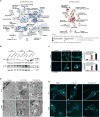
Figure 4. Effect of DRD4 Antagonists on Global Gene Expression
(A) Gene set enrichment map of pathways containing genes downregulated (blue) or upregulated (red) upon PNU 96415E treatment. Colored circles (nodes) represent gene sets (pathways) that were significantly enriched in the comparison treated versus control samples (FDR ≤ 0.002). (B) Western blot analysis for anti-LC3B and anti-β-actin in G411 and G362 cells treated with PNU 96415E (25 µM) and L-741,742 (10 µM) at indicated time points. (C) Immunofluorescence staining for LC3B+ puncta in G362 and G411 cells treated with PNU 96415E (25 µM) and L-741,742 (10 µM) at 48 hr. Scale bars, 17 µm. Quantification of LC3B+ cells in each group (cells counted >200 cells). n = 3, mean ± SEM, unpaired one-tailed t test. (D) Transmission electron microscopy images showing large autophagic vacuoles in G362 and G411 cells treated with L-741,742 (10 µM) and PNU 96415E (25 µM) compared with control DMSO at 48 hr. Arrows indicate enlarged autophagic vacuoles. Scale bars, 100 nm. (E) Filipin staining for free cholesterol in G362 and G411 cells treated with L-741,742 (10 µM) and PNU 96415E (25 µM) compared with control DMSO at 48 hr. Scale bars, 11 µm. See also Figure S3.
Figure 5
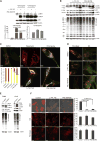
Figure 5. DRD4 Antagonism Impairs Autophagy-Lysosomal Degradation Pathway in GNS
(A) Western blot analysis for anti-LC3B, anti-p62, and anti-β-actin in G411 cells treated with L-741,742 (10 µM) or PNU 96415E (25 µM) in the presence and absence of chloroquine (30 µM) at 48 hr. Western quantification for LC3B-II was done using β-actin as control. n = 3, mean ± SEM. (B) Western blot analysis for corresponding anti-LC3B, anti-p62, anti-LAMP1, anti-mono- and polyubiquitin (Ub) protein conjugates, and anti-β-actin in G411 cells treated with L-741,742 (10 µM) and PNU 96415E (25 µM) at indicated time points. (C) Confocal analysis of G411 cells expressing tandem mRFP-GFP-LC3 reporter treated with rapamycin (500 nM), chloroquine (30 µM), L-741,742 (10 µM), and PNU 96415E (25 µM) at 48 hr, and quantification of ratio of red puncta indicating autolysosome (AL) versus yellow puncta indicating autophagosome (AP). n = 3, mean ± SEM. **p = 0.0006 and p = 0.0003 in L-741,742 and PNU 96415E, respectively. Scale bars, 10 µm. (D) Confocal analysis of fibroblast (BJ) and NS (hf5205) expressing tandem mRFP-GFP-LC3 reporter treated with L-741,742 (10 µM) and PNU 96415E (25 µM) at 48 hr. Scale bars, 7 µm. (E) Western blot analysis for corresponding anti-DRD4, anti-LC3B, anti-p62, anti-mono- and polyubiquitin (Ub) protein conjugate, and anti-β-actin in transient transfected sh-DRD4 and sh-eGFP GNS after 72 hr. (F) Confocal analysis for red puncta indicating dequenched BSA in GNS (G411) NS (hf5205) and fibroblast (BJ) treated with L-741,742 (10 µM) and PNU 96415E (25 µM) at 48 hr. Quantification of red puncta per cell in each treatment. n = 3, mean ± SEM, unpaired one-tailed t test. Scale bars, 13 µm. See also Figure S4.
Figure 6
Figure 6. Phosphokinase Array Reveals Suppression of ERK1/2 and mTOR Pathway Upon DRD4 Antagonism
(A) Dot blot containing 43 phosphoproteins in duplicates after exposure to lysate of G362 cells treated with L-741,742 (10 µM) and PNU 96415E (25 µM) and DMSO for 24 hr. Red arrow indicates one of a paired spot for ERK1/2. (B) Signal intensity of each spot corresponding to each phosphoprotein (average of two spots) in (A) that changed upon treatment compared with DMSO. Signal intensity was quantified using ImageJ. (C) Western blot analysis for anti-phospho-ERK1/2, anti-total ERK1/2, and anti-β-actin in G362 cells treated with L-741,742 (10 µM) and PNU 96415E (25 µM) at indicated time intervals. (D) Western blot analysis for anti-phospho-ERK1/2 and anti-total ERK1/2, anti-phospho-S6 and anti-total S6, and anti-β-actin in GNS (G362 and G411), fibroblast (BJ), and NS (hf5205) treated with L-741,742 (10 µM) and PNU 96415E (25 µM) for 48 hr. (E) Western blot analysis for anti-phospho-PDGFRβ, anti-total PDGFRβ, and anti-β-actin in G411 cells treated with L-741,742 (10 µM), PNU 96415E (25 µM), and L-745,870 (15 µM) for 48 hr. (F and G) Western blot analysis for anti-phospho-ERK1/2 and anti-total ERK1/2 in G362 (F) and G481 (G) transiently transfected with sh-DRD4 and control sheGFP after 72 hr (same protein lysates from Figures 3E and S2H). See also Figure S5.
Figure 7
Figure 7. DRD4 Antagonists Induce G0/G1 Cell-Cycle Arrest and Apoptosis
(A) Cell-cycle analysis of G411 and G362 cells after treatment with L-741,742 (10 µM) and PNU 96415E (25 µM) at 48 hr. (B) Fluorescence readout for caspase 3/7 activity in G411cells treated with L-741,742 (10 µM) and PNU 96415E (25 µM) for 48 hr, and doxorubicin (1 µM) for 24 hr as positive control. n = 3, mean ± SD. Significance analyzed by unpaired one-tailed t test. (C) Western blot analysis for apoptosis marker anti-cleaved PARP in G362 treated with L-741,742 (10 µM) and PNU 96415E (25 µM) at indicated time points, and doxorubicin (1 µM) at 24 hr as control. See also Figure S6.
Figure 8
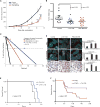
Figure 8. DRD4 Antagonists Inhibit GBM Xenograft Growth In Vivo
(A) Growth curve of subcutaneous implanted tumor (G362) over a period of time. Control, n = 15, mean ± SEM; PNU 96415E, n = 16, mean ± SEM; L-741,742, n = 16, mean ± SEM. **p < 0.005, *p < 0.05, unpaired one-tailed t test. (B) Dot plot showing tumor mass from the three treatment groups in (A) at endpoint. Control, n = 15, mean ± SEM; PNU 96415E, n = 16, mean ± SEM; L-741,742, n = 16, mean ± SEM. Significance analyzed by unpaired one-tailed t test. (C) Linear regression plot of in vitro LDA for in vivo treated tumors. Average of each group was taken for the plot, neurospheres scored for 18 wells (six wells from each tumor). (D) Immunohistochemistry staining and quantification for anti-p62 and anti-mono- and polyubiquitin (Ub) conjugate and LC3 in in vivo treated tumor. Scale bars, 11 µm (p62 and Ub conjugate) and 50 µm (LC3). n = 3 sections, mean ± SEM. (E) Kaplan-Meier survival curve of immunodeficient mice injected intracranially with G362 cells and treated with L-741,742 (25 mg/kg). n = 6 per group. Significance was performed using log-rank (Mantel-Cox) test. (F) Kaplan-Meier survival curve of immunodeficient mice injected with G362 cells treated with TMZ alone, or TMZ and L-741,742. Significance was performed using log-rank (Mantel-Cox) test. n = 18 per group and censorship/endpoint at day 182. See also Figure S7.

Comment in

  • Gliomas "Dope Up" for Growth.
    Paolella BR, Stiles CD. Paolella BR, et al. Cancer Cell. 2016 Jun 13;29(6):778-780. doi: 10.1016/j.ccell.2016.05.010. Cancer Cell. 2016. PMID: 27300432

Similar articles

Cited by

References

    1. Andang M, Hjerling-Leffler J, Moliner A, Lundgren TK, Castelo-Branco G, Nanou E, Pozas E, Bryja V, Halliez S, Nishimaru H, et al. Histone H2AX-dependent GABA(A) receptor regulation of stem cell proliferation. Nature. 2008;451:460–464. - PubMed
    1. Bao S, Wu Q, McLendon RE, Hao Y, Shi Q, Hjelmeland AB, Dewhirst MW, Bigner DD, Rich JN. Glioma stem cells promote radio-resistance by preferential activation of the DNA damage response. Nature. 2006;444:756–760. - PubMed
    1. Berg DA, Belnoue L, Song H, Simon A. Neurotransmitter-mediated control of neurogenesis in the adult vertebrate brain. Development. 2013;140:2548–2561. - PMC - PubMed
    1. Borta A, Hoglinger GU. Dopamine and adult neurogenesis. J. Neurochem. 2007;100:587–595. - PubMed
    1. Brennan CW, Verhaak RG, McKenna A, Campos B, Noushmehr H, Salama SR, Zheng S, Chakravarty D, Sanborn JZ, Berman SH, et al. The somatic genomic landscape of glioblastoma. Cell. 2013;155:462–477. - PMC - PubMed

Publication types

MeSH terms