

Strand-specific, high-resolution mapping of modified RNA polymerase II
- PMID: 27288397
- PMCID: PMC4915518
- DOI: 10.15252/msb.20166869
Strand-specific, high-resolution mapping of modified RNA polymerase II
Abstract
Reversible modification of the RNAPII C-terminal domain links transcription with RNA processing and surveillance activities. To better understand this, we mapped the location of RNAPII carrying the five types of CTD phosphorylation on the RNA transcript, providing strand-specific, nucleotide-resolution information, and we used a machine learning-based approach to define RNAPII states. This revealed enrichment of Ser5P, and depletion of Tyr1P, Ser2P, Thr4P, and Ser7P in the transcription start site (TSS) proximal ~150 nt of most genes, with depletion of all modifications close to the poly(A) site. The TSS region also showed elevated RNAPII relative to regions further 3', with high recruitment of RNA surveillance and termination factors, and correlated with the previously mapped 3' ends of short, unstable ncRNA transcripts. A hidden Markov model identified distinct modification states associated with initiating, early elongating and later elongating RNAPII. The initiation state was enriched near the TSS of protein-coding genes and persisted throughout exon 1 of intron-containing genes. Notably, unstable ncRNAs apparently failed to transition into the elongation states seen on protein-coding genes.
Keywords: hidden Markov model; polymerase CTD phosphorylation; transcription; yeast.
© 2016 The Authors. Published under the terms of the CC BY 4.0 license.
Figures
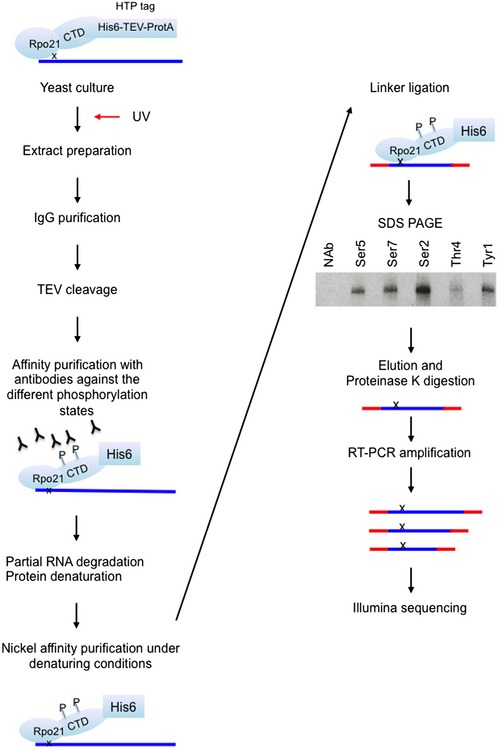
Outline of the mCRAC protocol. See Fig EV1 for further details. In all figures, the analyses used S. cerevisiae strains derived from BY4741.
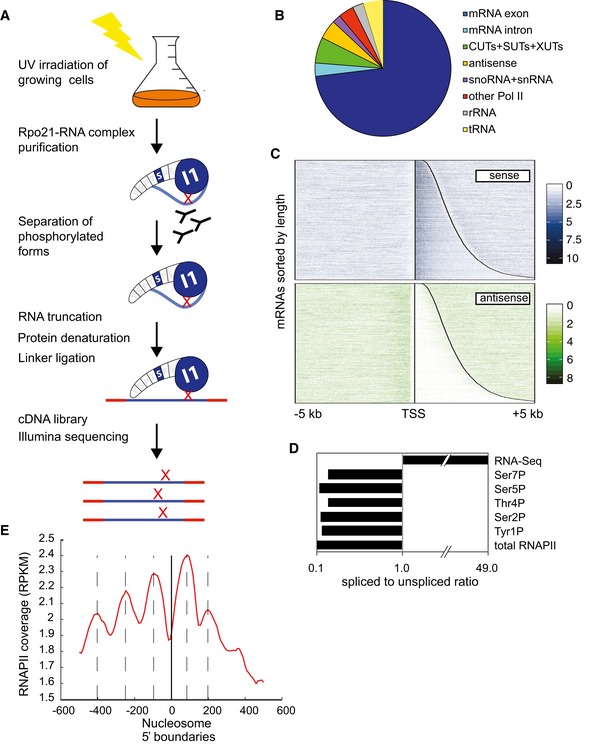
Distribution of RNAPII reads across transcript classes determined by CRAC analyses of Rpo21‐HTP.
Distribution of RNAPII across protein‐coding genes in the sense and antisense orientations. In the upper panel, the vertical line indicates the TSS. The curved line indicates the location of the poly(A). All protein‐coding genes are shown in the sense orientation, ordered with the shortest ORF at the top. The lower panel shows reads that are antisense to the same regions.
Ratio of spliced to unspliced RNAs in RNAPII‐bound RNAs, calculated as the ratio of sequences spanning exon–exon (spliced) relative to intron–exon (unspliced) junctions.
Peaks in RNAPII binding correlate with nucleosome positions. The zero point (solid vertical line) is the mapped positions of nucleosome 5′ boundaries (Jiang & Pugh, 2009) across all protein‐coding genes. The red line shows the overall RNAPII density with respect to each nucleosome boundary. Dashed lines show locations RNAPII maxima, which show an apparent 150 nt periodicity.

- A–J
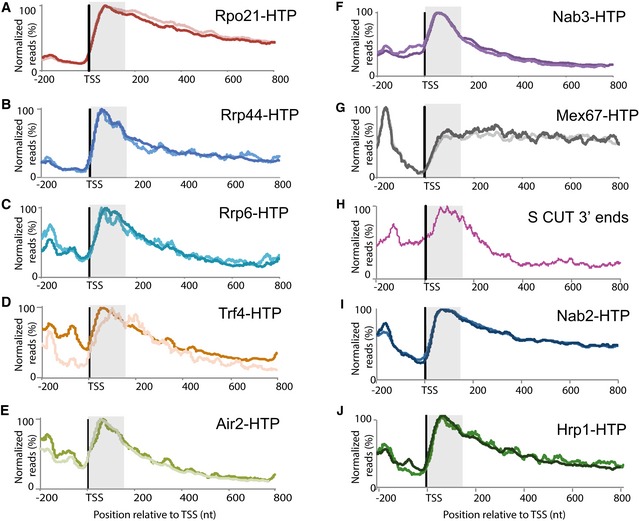
Each panel shows the hit density, normalized to the maximal binding value across all mRNA genes longer than 500 nt inside each individual experiment. The two lines in each panel represent results from independent CRAC experiments. The TSS‐proximal 150 nt region is shaded. (A) Rpo21 (RNAPII); (B) Rrp44; (C) Rrp6; (D) Trf4; (E) Air2; (F) Nab3; (G) Mex67; (H) Distribution of the 3′ ends of short, promoter‐proximal, sense‐orientated ncRNA transcripts (S CUTs); (I) Nab2; (J) Hrp1. Sequence data source: (A‐E) (this work), (F) (Holmes et al, 2015). (G, I, J) (Tuck & Tollervey, 2013), (H) (Neil et al, 2009).
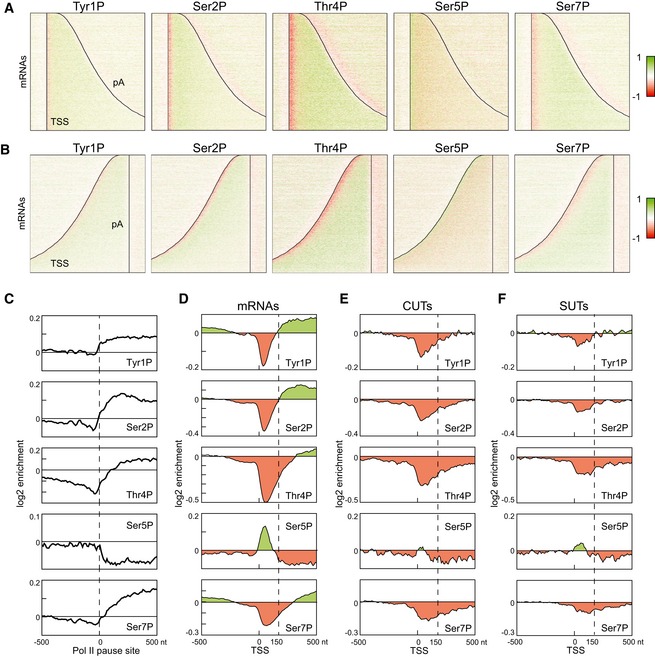
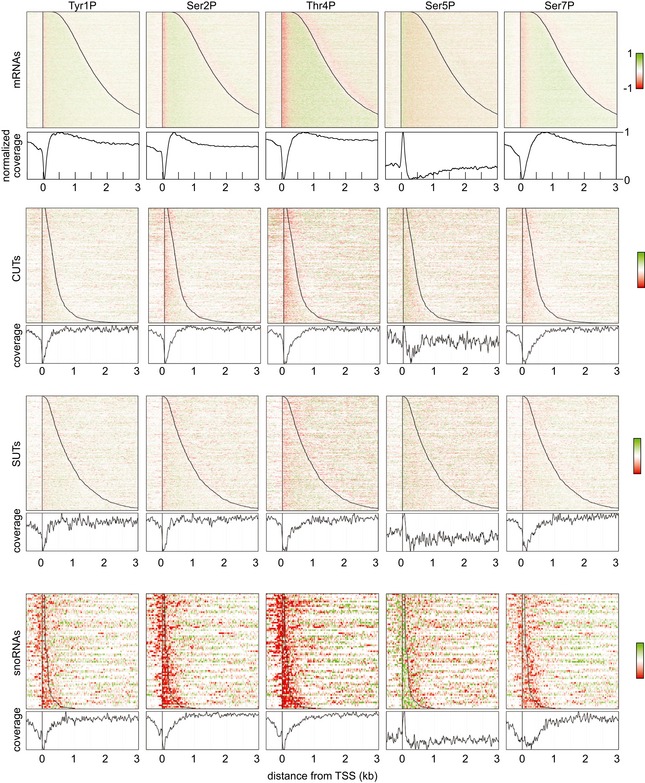
Distribution of RNAPII phosphorylation across protein‐coding genes aligned at the TSS, as in Fig 1C as determined by mCRAC analyses on Rpo21‐HTP. Red color indicates depletion, and green color indicates enrichment of phosphorylation relative to total RNAPII.
As panel (A) but with genes aligned at the polyadenylation site.
Metagene analysis of RNAPII phosphorylation enrichment relative to the 5,000 strongest RNAPII pause sites in mRNA genes, identified by NET‐Seq (Churchman & Weissman, 2011).
Metagene analysis of RNAPII phosphorylation enrichment relative to transcription start sites, calculated for all mRNA genes. The TSS‐proximal 150 nt region, where Ser5P is enriched and Ser2P and Tyr1P are depleted, is indicated with a dashed line.
Metagene analysis of RNAPII phosphorylation on CUTs as for (D).
Metagene analysis of RNAPII phosphorylation on SUTs as for (D).
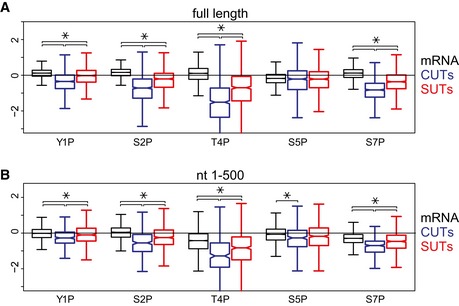
Distributions of phosphorylation enrichment on individual mRNAs, CUTs, and SUTs. The boxes show the median and interquartile range of phosphorylation enrichment scores for mRNAs (N = 5,171), CUTs (N = 925), and SUTs (N = 847).
Distributions of phosphorylation enrichment in the first 500 nt of mRNAs, CUTs, and SUTs. Only genes with length greater than 500 nt were analyzed. The boxes show the median and interquartile range of phosphorylation enrichment scores for mRNAs (N = 5,040), CUTs (N = 294), and SUTs (N = 563).
- A
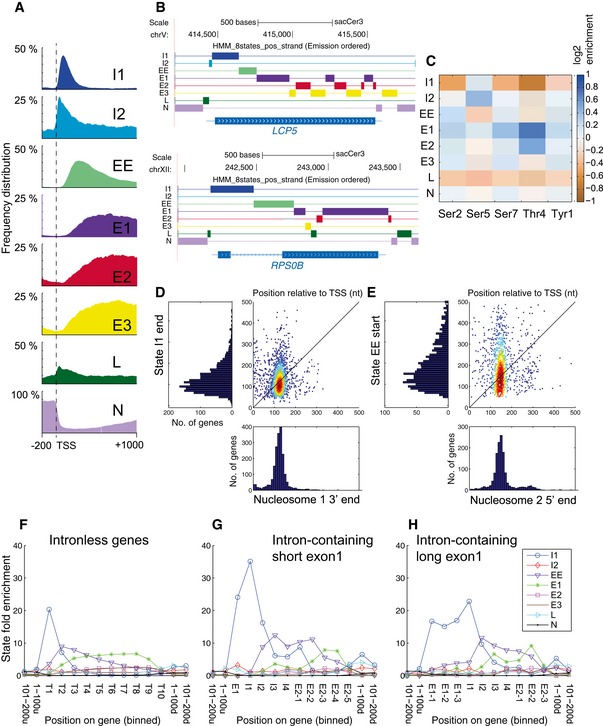
Metagene analysis of frequency distribution for each state on all protein‐coding genes. See expanded view for analyses of replicate datasets and statistical analyses.
- B
Genome browser views showing the distribution of the 8 states in the HMM over an unspliced gene (LCP5) and a spliced gene (RPS0B).
- C
Learned emission matrix of the 8‐state HMM. Each row shows the average log‐enrichment levels of the different phosphorylated forms of Rpo21 over total RNAPII in one of the states.
- D
Comparison of the locations of the 3′ end of initiation state I1 with the 3′ boundary of nucleosome 1.
- E
Comparison of the locations of the 5′ end of early elongation state EE with the 5′ boundary of nucleosome 2.
- F–H
The presence of an intron is associated with displacement of phosphorylation state boundaries. The graphs show state fold enrichment for each state over protein‐coding genes lacking an intron (F), containing short exon 1 (< 100 nt) regions (G) or long (> 100 nt) exon 1 regions (H). For each panel, the length of each gene has been divided into ten bins to allow the combination of genes with different lengths. T, Transcript; E1, Exon 1; I, Intron; E2, Exon 2. Intron‐containing genes in yeast are generally highly expressed, and the top quartile of intronless genes was therefore taken for comparison.
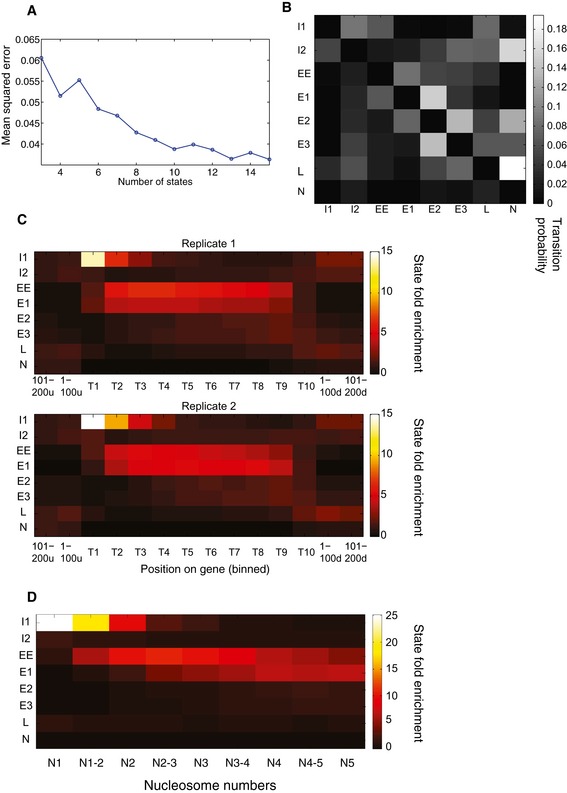
Plot showing the mean squared error with respect to the number of states in the HMM.
Learned state transition matrix for 8‐state HMM. Each entry (i,j) of the matrix shows the probability of transitioning from hidden state i to j at any position along the genome.
State distributions across first quartile of protein‐coding genes from two independent mCRAC analyses.
State distributions across first quartile of protein coding relative to the positions of nucleosomes 1–5 (N1–N5) on these genes.
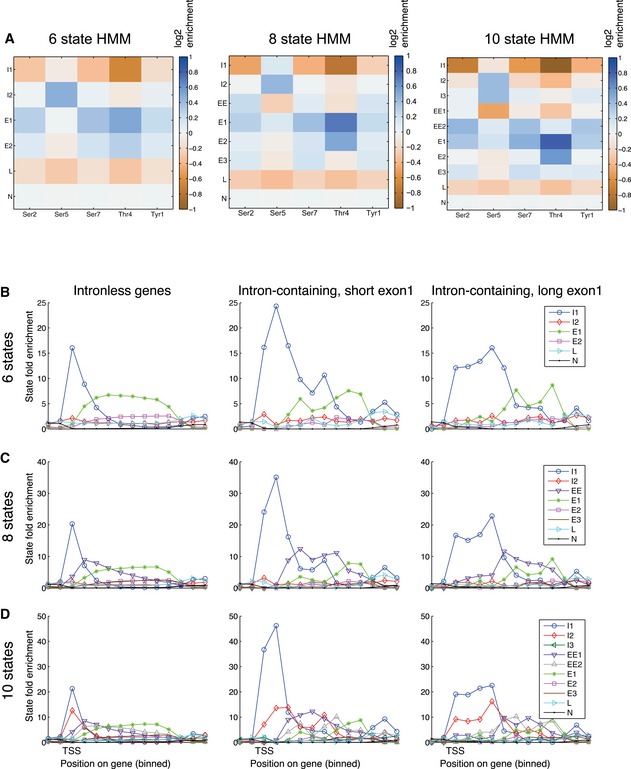
- A
Emission matrices for 6‐, 8‐, and 10‐state HMM models.
- B–D
(B) 6‐state HMM model; (C) 8‐state HMM model; (D) 10‐state HMM model. In each panel, the left graph (I) shows the top quartile of protein‐coding genes, the middle graph (II) shows spliced genes with short exon 1 regions (< 100 nt) and the right graph (III) shows spliced genes with long exon 1 regions (> 100 nt). In each model, preferential initiation and elongation states are clearly resolved. In all models, the initiation state is clearly extended further 3′ on intron‐containing genes.
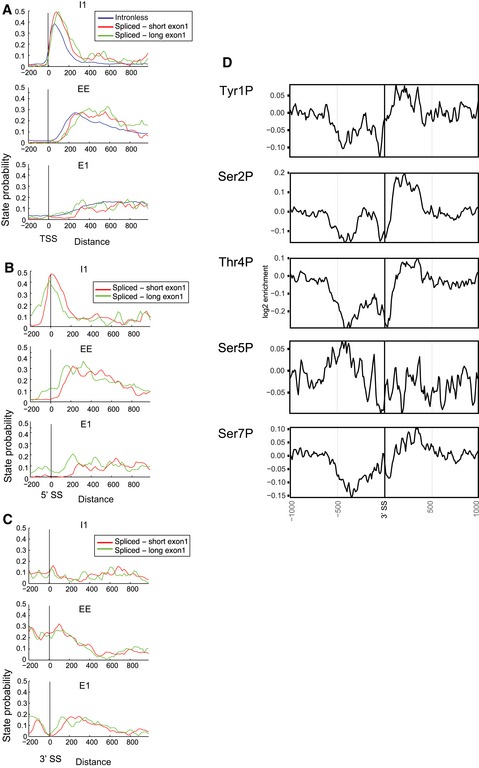
- A
Average state probabilities shown individually for each state over protein‐coding genes lacking an intron (intronless) or with short (< 100 nt) or long (> 100 nt) exon 1 regions, aligned by the transcription start site (TSS).
- B, C
Average state probabilities shown individually for each state over protein‐coding genes with short (< 100 nt) or long (> 100 nt) exon 1 regions, aligned by 5′ splice site (5′SS; panel B) or 3′ splice site (3′SS; panel C).
- D
Distribution of phosphorylated RNAPII relative to the 3′ splice site (3′SS) in intron‐containing genes.
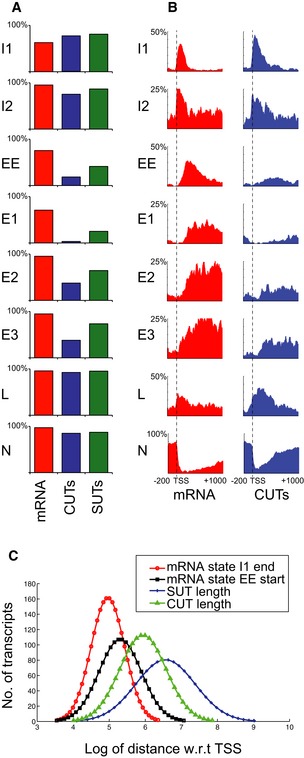
Comparison of state frequencies over expression‐matched protein‐coding mRNAs, SUTs, and CUTs.
Comparison of state distributions over expression‐matched protein‐coding mRNAs and CUTs as in A.
The failure of lncRNAs to exit initiation state I1 is not a consequence of short length. The curves show the positions at which RNAPII exits initiation state I1 (red curve) and enters early elongation state EE (black curve), relative to the lengths of CUTs (green line) and SUTs (blue line).
Similar articles
-
The Saccharomyces cerevisiae SR protein Npl3 interacts with hyperphosphorylated CTD of RNA Polymerase II.Int J Biol Macromol. 2023 Dec 31;253(Pt 7):127541. doi: 10.1016/j.ijbiomac.2023.127541. Epub 2023 Oct 18. Int J Biol Macromol. 2023. PMID: 37858651
-
Profiling RNA Polymerase II Phosphorylation Genome-Wide in Fission Yeast.Methods Enzymol. 2018;612:489-504. doi: 10.1016/bs.mie.2018.07.009. Epub 2018 Aug 23. Methods Enzymol. 2018. PMID: 30502955
-
The RNA polymerase II C-terminal domain-interacting domain of yeast Nrd1 contributes to the choice of termination pathway and couples to RNA processing by the nuclear exosome.J Biol Chem. 2013 Dec 20;288(51):36676-90. doi: 10.1074/jbc.M113.508267. Epub 2013 Nov 6. J Biol Chem. 2013. PMID: 24196955 Free PMC article.
-
Non-coding transcription by RNA polymerase II in yeast: Hasard or nécessité?Biochimie. 2015 Oct;117:28-36. doi: 10.1016/j.biochi.2015.04.020. Epub 2015 May 6. Biochimie. 2015. PMID: 25956976 Review.
-
Dynamic phosphorylation patterns of RNA polymerase II CTD during transcription.Biochim Biophys Acta. 2013 Jan;1829(1):55-62. doi: 10.1016/j.bbagrm.2012.08.013. Epub 2012 Sep 7. Biochim Biophys Acta. 2013. PMID: 22982363 Review.
Cited by
-
Nascent RNA and the Coordination of Splicing with Transcription.Cold Spring Harb Perspect Biol. 2019 Aug 1;11(8):a032227. doi: 10.1101/cshperspect.a032227. Cold Spring Harb Perspect Biol. 2019. PMID: 31371351 Free PMC article. Review.
-
A Nuclear Export Block Triggers the Decay of Newly Synthesized Polyadenylated RNA.Cell Rep. 2018 Aug 28;24(9):2457-2467.e7. doi: 10.1016/j.celrep.2018.07.103. Cell Rep. 2018. PMID: 30157437 Free PMC article.
-
Surveillance-ready transcription: nuclear RNA decay as a default fate.Open Biol. 2018 Mar;8(3):170270. doi: 10.1098/rsob.170270. Open Biol. 2018. PMID: 29563193 Free PMC article. Review.
-
RNA Binding by Histone Methyltransferases Set1 and Set2.Mol Cell Biol. 2017 Jun 29;37(14):e00165-17. doi: 10.1128/MCB.00165-17. Print 2017 Jul 15. Mol Cell Biol. 2017. PMID: 28483910 Free PMC article.
-
Diverse and conserved roles of the protein Ssu72 in eukaryotes: from yeast to higher organisms.Curr Genet. 2021 Apr;67(2):195-206. doi: 10.1007/s00294-020-01132-5. Epub 2020 Nov 26. Curr Genet. 2021. PMID: 33244642 Review.
References
-
- Arigo JT, Eyler DE, Carroll KL, Corden JL (2006) Termination of cryptic unstable transcripts is directed by yeast RNA‐binding proteins Nrd1 and Nab3. Mol Cell 23: 841–851 - PubMed
-
- Camblong J, Iglesias N, Fickentscher C, Dieppois G, Stutz FÁ (2007) Antisense RNA stabilization induces transcriptional gene Silencing via histone deacetylation in S. cerevisiae . Cell 131: 706–717 - PubMed
MeSH terms
Substances
Grants and funding
LinkOut - more resources
Full Text Sources
Other Literature Sources
Molecular Biology Databases
Research Materials
