

Colocalization of neutrophils, extracellular DNA and coagulation factors during NETosis: Development and utility of an immunofluorescence-based microscopy platform
- PMID: 27286714
- PMCID: PMC4935600
- DOI: 10.1016/j.jim.2016.06.002
Colocalization of neutrophils, extracellular DNA and coagulation factors during NETosis: Development and utility of an immunofluorescence-based microscopy platform
Abstract
Background: Neutrophils, the most populous innate immune cell type, are the first responders to sites of infection and inflammation. Neutrophils can release their DNA to form extracellular traps (NETs), webs of DNA and granular proteases that contribute to pathogen clearance and promote thrombus formation. At present, the study of NETs is in part limited to the qualitative analysis of fluorescence microscopy-based images, thus quantification of the interactions between NETs and coagulation factors remains ill-defined.
Aim: Develop a quantitative method to measure the spatial distribution of DNA and colocalization of coagulation factor binding to neutrophils and NETs utilizing fluorescence-based microscopy.
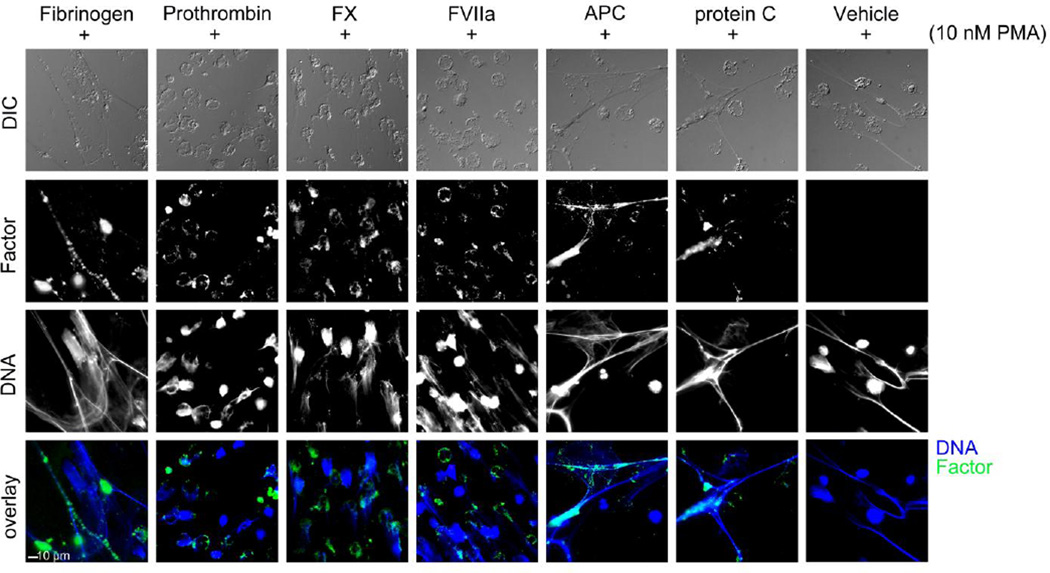
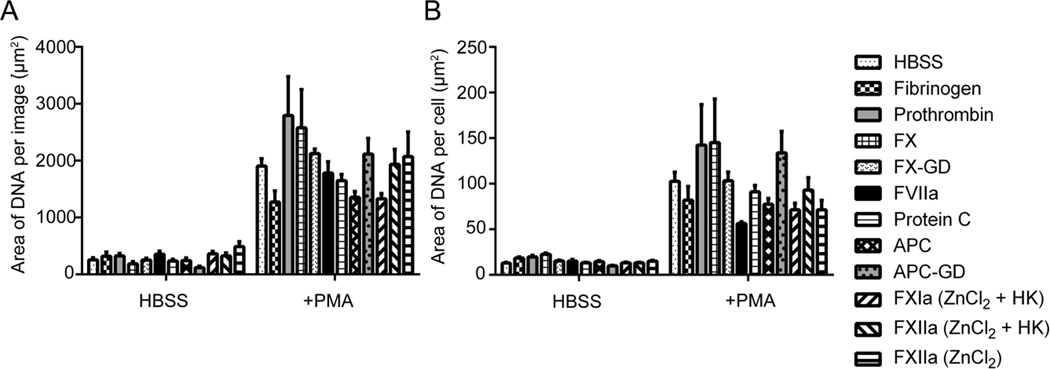
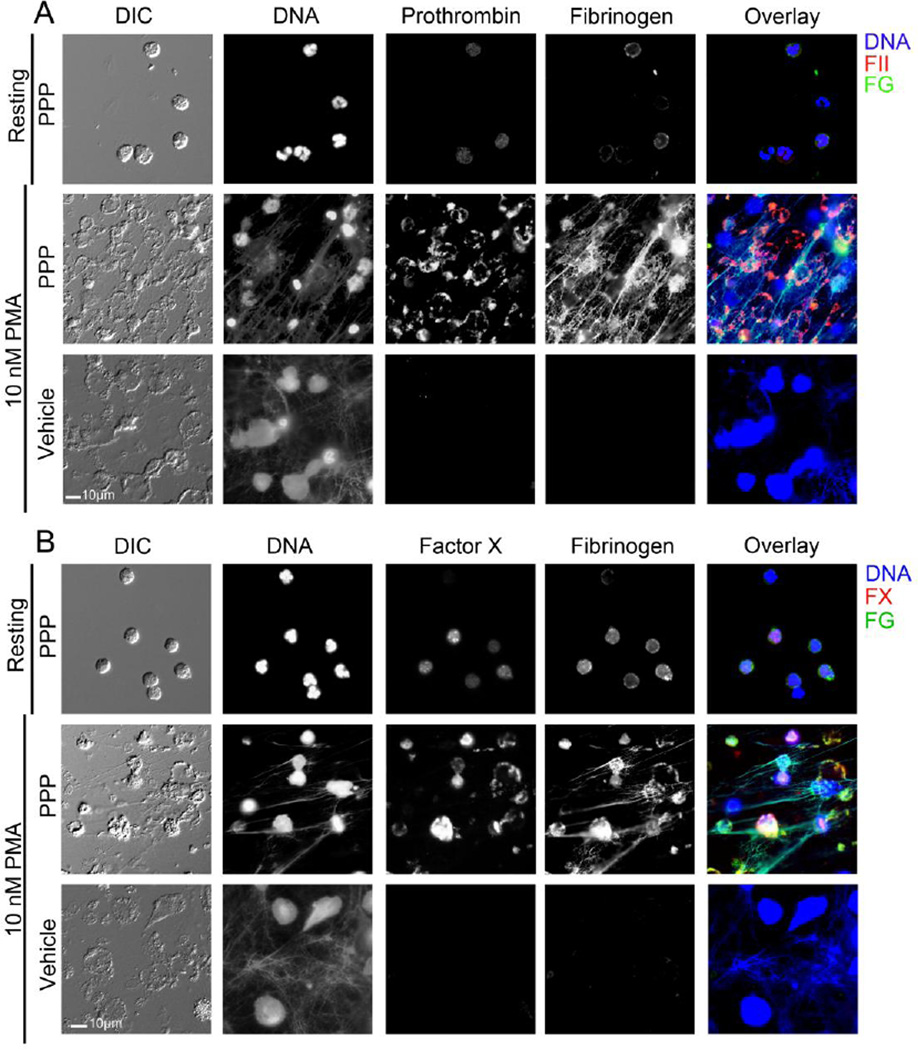
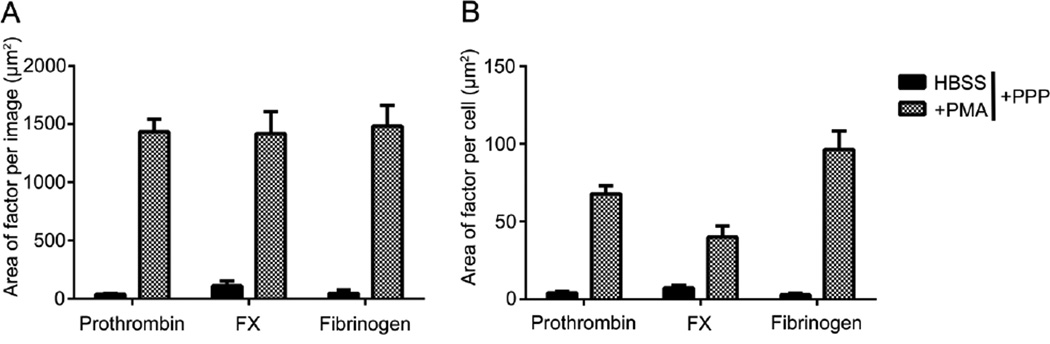
Approach: Human neutrophils were purified from peripheral blood, bound to fibronectin and treated with the PKC-activator phorbol myristate acetate (PMA) to induce neutrophil activation and NETs formation. Samples were incubated with purified coagulation factors or plasma before staining with a DNA-binding dye and coagulation factor-specific antibodies. The spatial distribution of DNA and coagulation factors was imaged via fluorescence microscopy and quantified via a custom-built MATLAB-based image analysis algorithm. The algorithm first established global thresholding parameters on a training set of fluorescence image data and then systematically quantified intensity profiles across treatment conditions. Quantitative comparison of treatment conditions was enabled through the normalization of fluorescent intensities using the number of cells per image to determine the percent and area of DNA and coagulation factor binding per cell.
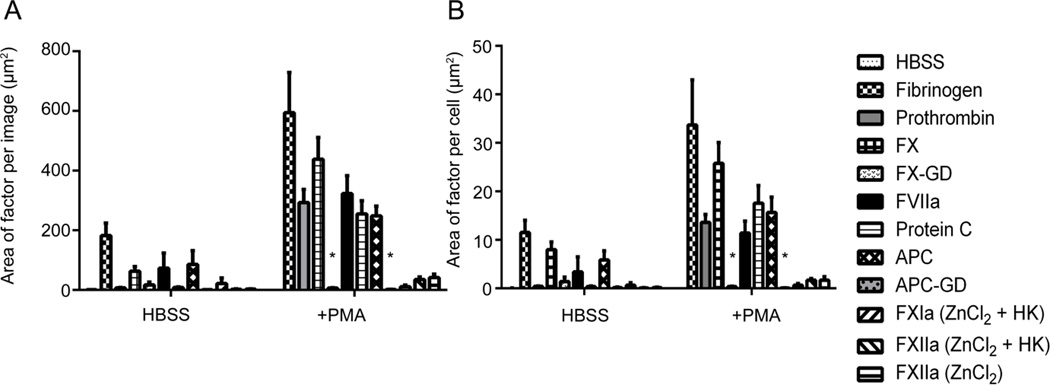
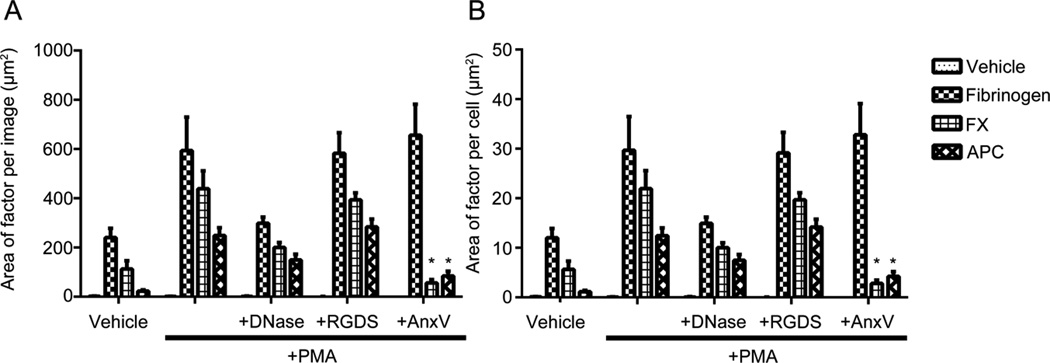
Results: Upon stimulation with PMA, NETs formation resulted in an increase in the area of DNA per cell. The coagulation factor fibrinogen bound to both the neutrophil cell body as well as NETs, while prothrombin, FX and FVIIa binding was restricted to the neutrophil cell body. The Gla domain of FX was required to mediate FX-neutrophil binding. Activated protein C (APC), but not Gla-less APC, bound to neutrophil cell bodies and NETs in a punctate manner. Neither FXIIa nor FXIa were found to bind either neutrophil cell bodies or NETs. Fibrinogen binding was dependent on extracellular DNA, while FX and APC required phosphatidylserine exposure for binding to activated neutrophils.
Conclusions: We have developed a quantitative measurement platform to define the spatial localization of fluorescently-labeled coagulation factor binding to neutrophils and extracellular DNA during NETosis.
Keywords: Biophysical measurement; Coagulation factors; Fluorescence microscopy; Neutrophil extracellular traps.
Copyright © 2016 Elsevier B.V. All rights reserved.
Conflict of interest statement
The authors have no conflicts of interest to declare.
Figures
Similar articles
-
Activated protein C inhibits neutrophil extracellular trap formation in vitro and activation in vivo.J Biol Chem. 2017 May 26;292(21):8616-8629. doi: 10.1074/jbc.M116.768309. Epub 2017 Apr 13. J Biol Chem. 2017. PMID: 28408624 Free PMC article.
-
A Flow Cytometry-Based Assay for High-Throughput Detection and Quantification of Neutrophil Extracellular Traps in Mixed Cell Populations.Cytometry A. 2019 Mar;95(3):268-278. doi: 10.1002/cyto.a.23672. Epub 2018 Dec 14. Cytometry A. 2019. PMID: 30549398 Free PMC article.
-
Measurement of NET formation in vitro and in vivo by flow cytometry.Cytometry A. 2017 Aug;91(8):822-829. doi: 10.1002/cyto.a.23169. Epub 2017 Jul 17. Cytometry A. 2017. PMID: 28715618 Free PMC article.
-
How Neutrophil Extracellular Traps Become Visible.J Immunol Res. 2016;2016:4604713. doi: 10.1155/2016/4604713. Epub 2016 May 16. J Immunol Res. 2016. PMID: 27294157 Free PMC article. Review.
-
A novel method for high-throughput detection and quantification of neutrophil extracellular traps reveals ROS-independent NET release with immune complexes.Autoimmun Rev. 2016 Jun;15(6):577-84. doi: 10.1016/j.autrev.2016.02.018. Epub 2016 Feb 27. Autoimmun Rev. 2016. PMID: 26925759 Review.
Cited by
-
Interaction of the antiphospholipid syndrome autoantigen beta-2 glycoprotein I with DNA and neutrophil extracellular traps.Clin Immunol. 2023 Oct;255:109714. doi: 10.1016/j.clim.2023.109714. Epub 2023 Jul 30. Clin Immunol. 2023. PMID: 37527733 Free PMC article.
-
NETosis, complement, and coagulation: a triangular relationship.Cell Mol Immunol. 2019 Jan;16(1):19-27. doi: 10.1038/s41423-018-0024-0. Epub 2018 Mar 23. Cell Mol Immunol. 2019. PMID: 29572545 Free PMC article. Review.
-
Alteration of the exDNA profile in blood serum of LLC-bearing mice under the decrease of tumour invasion potential by bovine pancreatic DNase I treatment.PLoS One. 2017 Feb 21;12(2):e0171988. doi: 10.1371/journal.pone.0171988. eCollection 2017. PLoS One. 2017. PMID: 28222152 Free PMC article.
-
Batroxobin accelerated tissue repair via neutrophil extracellular trap regulation and defibrinogenation in a murine ischemic hindlimb model.PLoS One. 2019 Aug 16;14(8):e0220898. doi: 10.1371/journal.pone.0220898. eCollection 2019. PLoS One. 2019. PMID: 31419236 Free PMC article.
-
Neutrophil extracellular traps in intracerebral hemorrhage: implications for pathogenesis and therapeutic targets.Metab Brain Dis. 2023 Dec;38(8):2505-2520. doi: 10.1007/s11011-023-01268-6. Epub 2023 Jul 24. Metab Brain Dis. 2023. PMID: 37486436 Review.
References
-
- Brinkmann V, Reichard U, Goosmann C, Fauler B, Uhlemann Y, Weiss DS, Weinrauch Y, Zychlinsky A. Neutrophil extracellular traps kill bacteria. Science. 2004;303:1532–1535. - PubMed
-
- Gould TJ, Vu TT, Swystun LL, Dwivedi DJ, Mai SHC, Weitz JI, Liaw PC. Neutrophil extracellular traps promote thrombin generation through platelet-dependent and platelet-independent mechanisms. Arterioscler. Thromb. Vasc. Biol. 2014;34:1977–1984. - PubMed
Publication types
MeSH terms
Substances
Grants and funding
LinkOut - more resources
Full Text Sources
Other Literature Sources
