

Solid-State NMR Investigation of the Conformation, Proton Conduction, and Hydration of the Influenza B Virus M2 Transmembrane Proton Channel
- PMID: 27286559
- PMCID: PMC5257200
- DOI: 10.1021/jacs.6b03142
Solid-State NMR Investigation of the Conformation, Proton Conduction, and Hydration of the Influenza B Virus M2 Transmembrane Proton Channel
Abstract
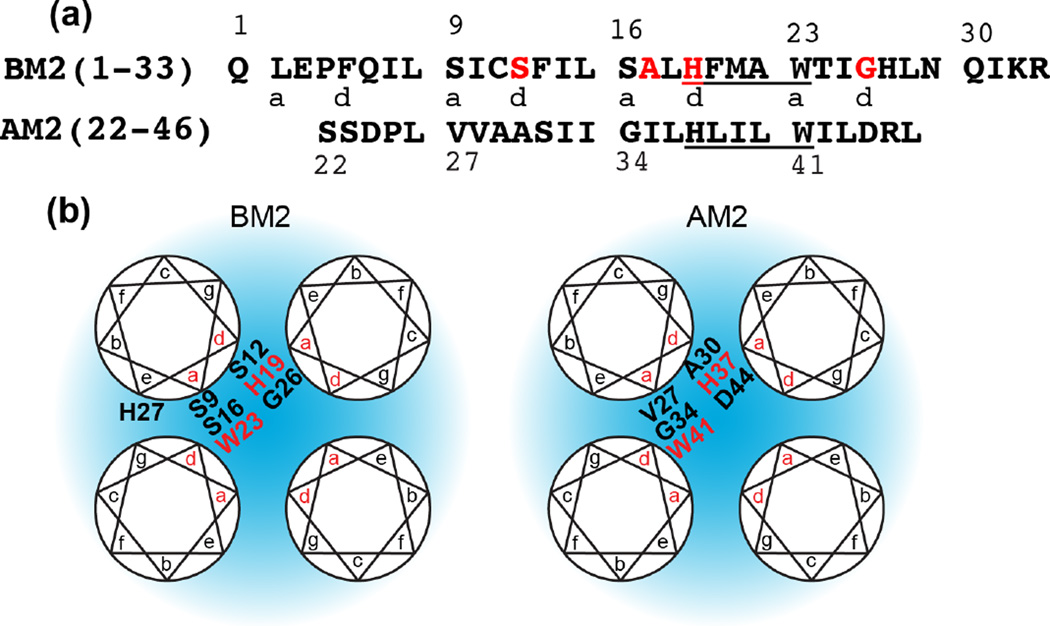
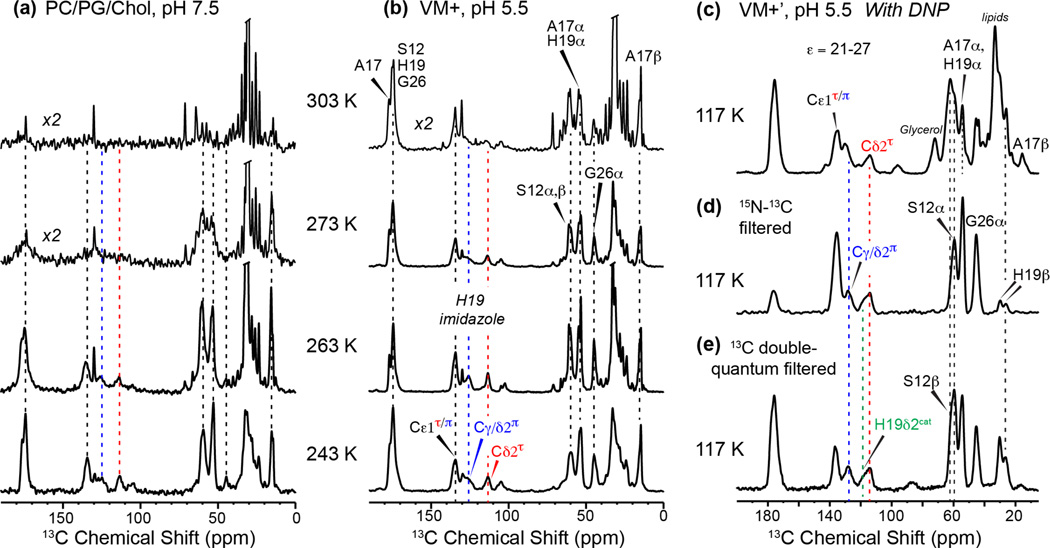
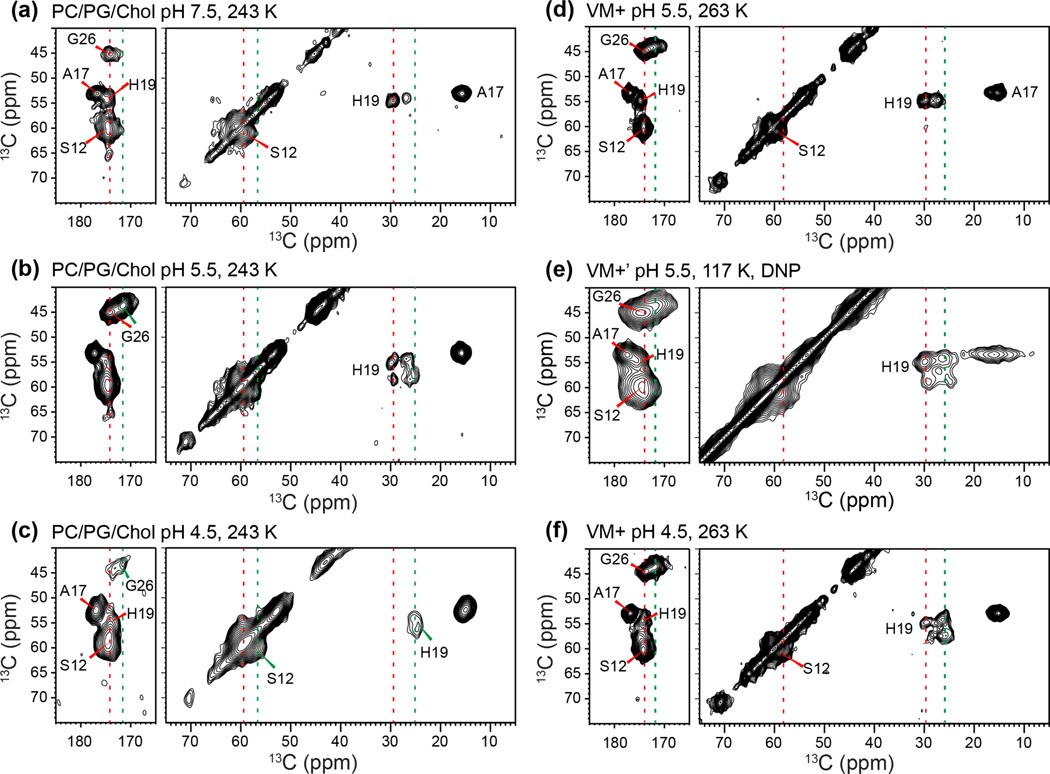
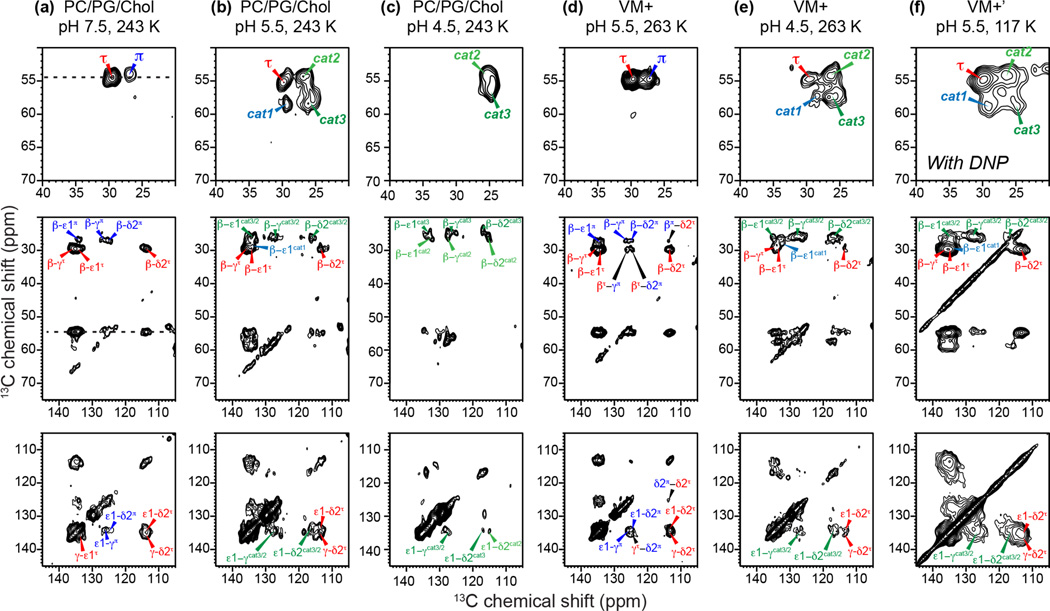
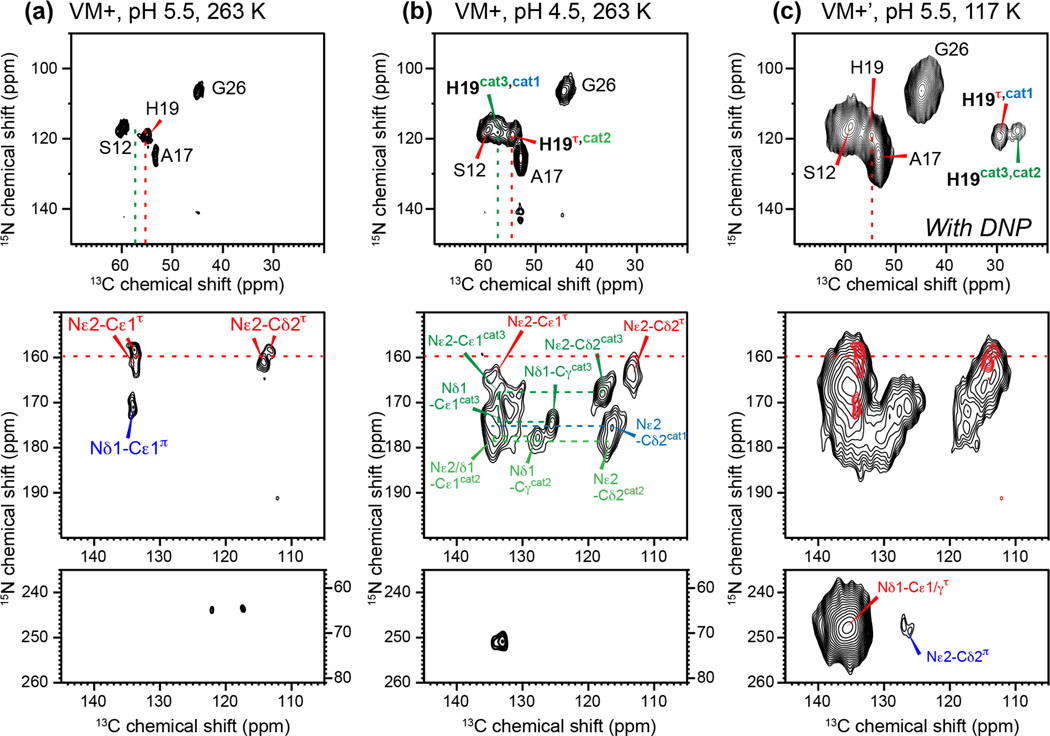
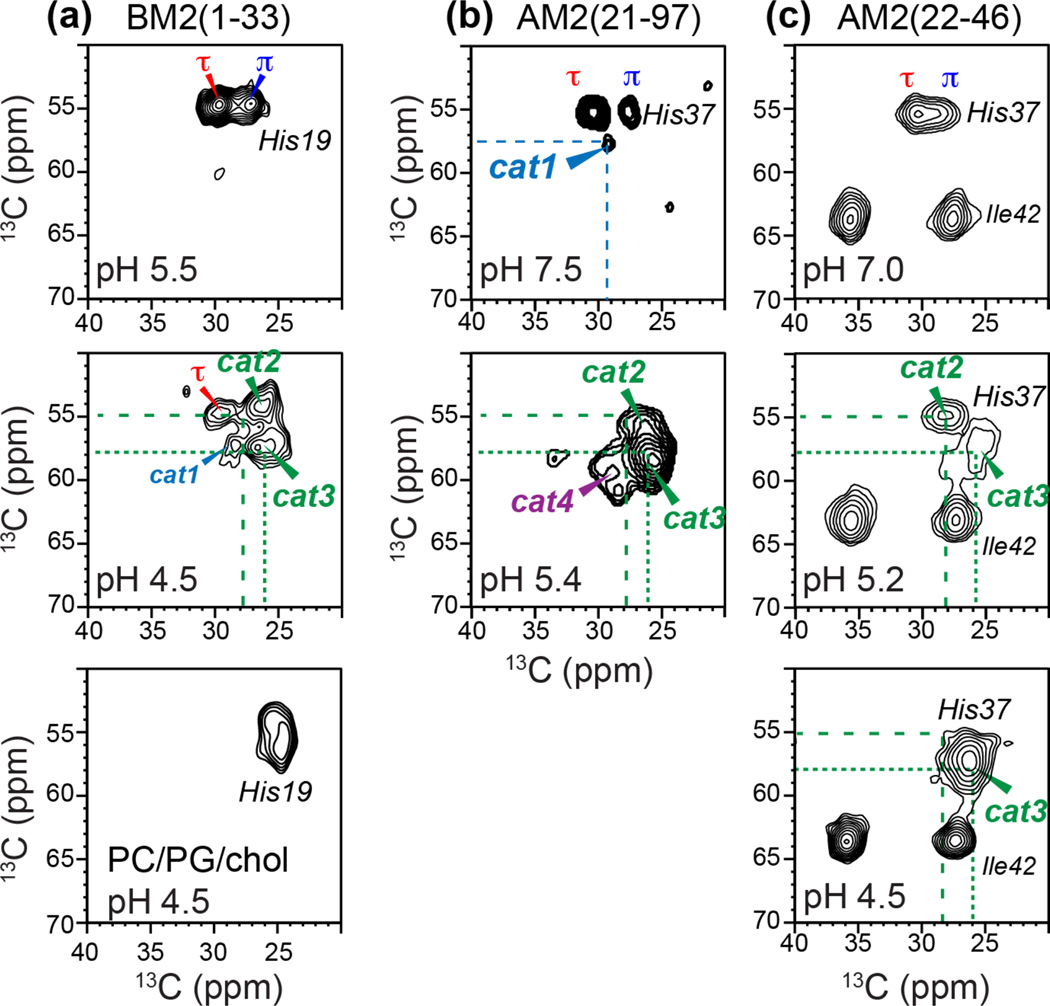
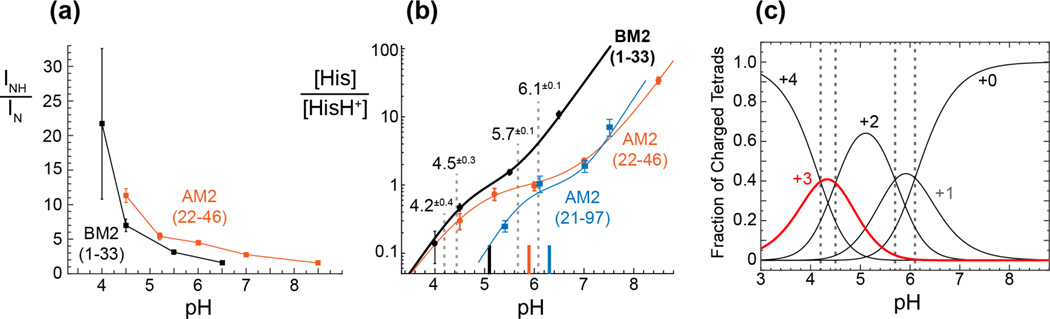
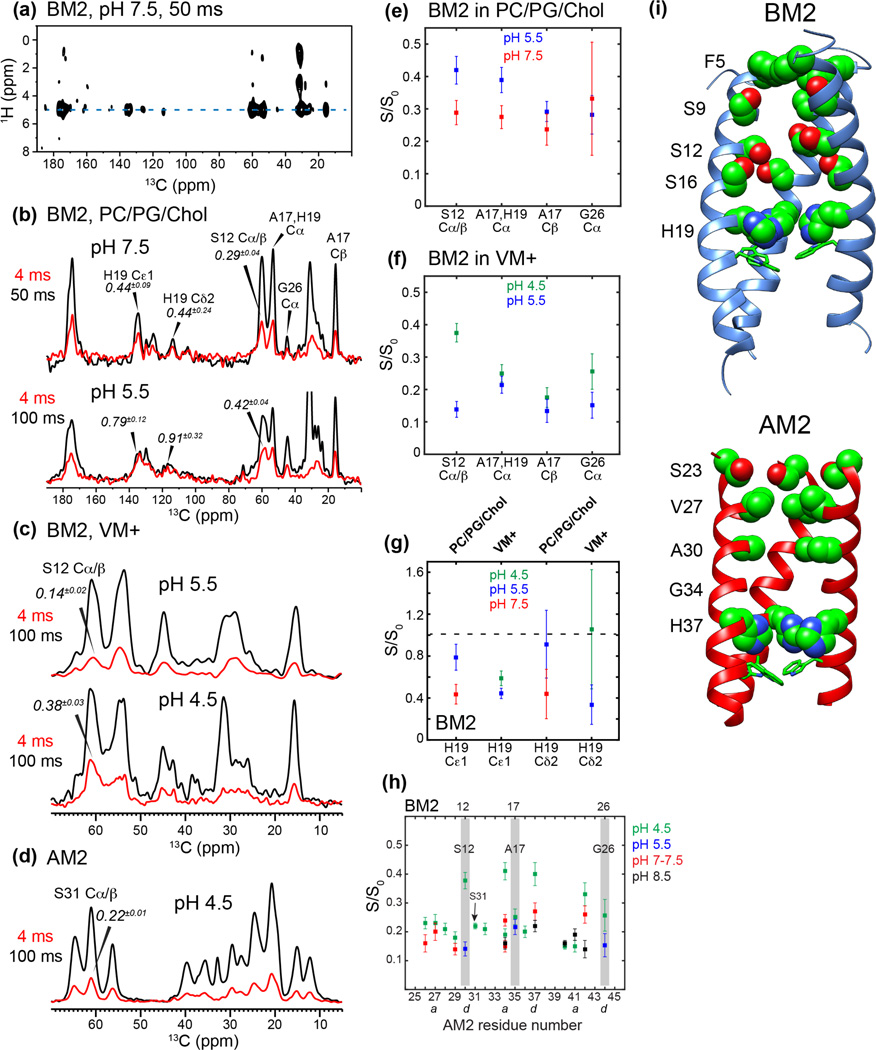
Together with the influenza A virus, influenza B virus causes seasonal flu epidemics. The M2 protein of influenza B (BM2) forms a tetrameric proton-conducting channel that is important for the virus lifecycle. BM2 shares little sequence homology with AM2, except for a conserved HxxxW motif in the transmembrane (TM) domain. Unlike AM2, no antiviral drugs have been developed to block the BM2 channel. To elucidate the proton-conduction mechanism of BM2 and to facilitate the development of BM2 inhibitors, we have employed solid-state NMR spectroscopy to investigate the conformation, dynamics, and hydration of the BM2 TM domain in lipid bilayers. BM2 adopts an α-helical conformation in lipid membranes. At physiological temperature and low pH, the proton-selective residue, His19, shows relatively narrow (15)N chemical exchange peaks for the imidazole nitrogens, indicating fast proton shuttling that interconverts cationic and neutral histidines. Importantly, pH-dependent (15)N chemical shifts indicate that His19 retains the neutral population to much lower pH than His37 in AM2, indicating larger acid-dissociation constants or lower pKa's. We attribute these dynamical and equilibrium differences to the presence of a second titratable histidine, His27, which may increase the proton-dissociation rate of His19. Two-dimensional (1)H-(13)C correlation spectra probing water (1)H polarization transfer to the peptide indicates that the BM2 channel becomes much more hydrated at low pH than at high pH, particularly at Ser12, indicating that the pore-facing serine residues in BM2 mediate proton relay to the proton-selective histidine.
Figures

Similar articles
-
Elucidating Relayed Proton Transfer through a His-Trp-His Triad of a Transmembrane Proton Channel by Solid-State NMR.J Mol Biol. 2019 Jun 28;431(14):2554-2566. doi: 10.1016/j.jmb.2019.05.009. Epub 2019 May 11. J Mol Biol. 2019. PMID: 31082440 Free PMC article.
-
Structure and dynamics of the proton-selective histidine and the gating tryptophan in an inward rectifying hybrid influenza B and A virus M2 proton channel.Phys Chem Chem Phys. 2024 Jul 31;26(30):20629-20644. doi: 10.1039/d4cp01648c. Phys Chem Chem Phys. 2024. PMID: 39037444 Free PMC article.
-
Protonation equilibria and pore-opening structure of the dual-histidine influenza B virus M2 transmembrane proton channel from solid-state NMR.J Biol Chem. 2017 Oct 27;292(43):17876-17884. doi: 10.1074/jbc.M117.813998. Epub 2017 Sep 11. J Biol Chem. 2017. PMID: 28893910 Free PMC article.
-
Structural basis for proton conduction and inhibition by the influenza M2 protein.Protein Sci. 2012 Nov;21(11):1620-33. doi: 10.1002/pro.2158. Epub 2012 Oct 9. Protein Sci. 2012. PMID: 23001990 Free PMC article. Review.
-
Flu channel drug resistance: a tale of two sites.Protein Cell. 2010 Mar;1(3):246-58. doi: 10.1007/s13238-010-0025-y. Epub 2010 Feb 23. Protein Cell. 2010. PMID: 21203971 Free PMC article. Review.
Cited by
-
Elucidating Relayed Proton Transfer through a His-Trp-His Triad of a Transmembrane Proton Channel by Solid-State NMR.J Mol Biol. 2019 Jun 28;431(14):2554-2566. doi: 10.1016/j.jmb.2019.05.009. Epub 2019 May 11. J Mol Biol. 2019. PMID: 31082440 Free PMC article.
-
Activation of the Influenza B M2 Proton Channel (BM2).Biochemistry. 2024 Nov 19;63(22):3011-3019. doi: 10.1021/acs.biochem.4c00607. Epub 2024 Nov 3. Biochemistry. 2024. PMID: 39488842
-
Transport-Relevant Protein Conformational Dynamics and Water Dynamics on Multiple Time Scales in an Archetypal Proton Channel: Insights from Solid-State NMR.J Am Chem Soc. 2018 Jan 31;140(4):1514-1524. doi: 10.1021/jacs.7b12464. Epub 2018 Jan 22. J Am Chem Soc. 2018. PMID: 29303574 Free PMC article.
-
Structure and dynamics of the proton-selective histidine and the gating tryptophan in an inward rectifying hybrid influenza B and A virus M2 proton channel.Phys Chem Chem Phys. 2024 Jul 31;26(30):20629-20644. doi: 10.1039/d4cp01648c. Phys Chem Chem Phys. 2024. PMID: 39037444 Free PMC article.
-
The Potential of Cyclodextrins as Inhibitors for the BM2 Protein: An In Silico Investigation.Molecules. 2024 Jan 28;29(3):620. doi: 10.3390/molecules29030620. Molecules. 2024. PMID: 38338365 Free PMC article.
References
-
- Brammer L, Kniss K, Epperson S, Blanton L, Mustaquim D, Steffens C, D’Mello T, Perez A, Dhara R, Chaves SS, Elal AA, Gubareva L, Wallis T, Xu X, Villanueva J, Bresee J, Cox N, Finelli L, Havers F. Influenza Activity — United States, 2012–13 Season and Composition of the 2013–14 Influenza Vaccine; Morbidity and Mortality Weekly Report. Atlanta: Centers for Disease Control and Prevention; 2013.
-
- Koutsakos M, Nguyen T, Barclay W, Kedzierska K. Future Microbiol. 2016;11:119. - PubMed
Publication types
MeSH terms
Substances
Grants and funding
LinkOut - more resources
Full Text Sources
Other Literature Sources
