

Imaging cellular structures in super-resolution with SIM, STED and Localisation Microscopy: A practical comparison
- PMID: 27264341
- PMCID: PMC4893670
- DOI: 10.1038/srep27290
Imaging cellular structures in super-resolution with SIM, STED and Localisation Microscopy: A practical comparison
Abstract
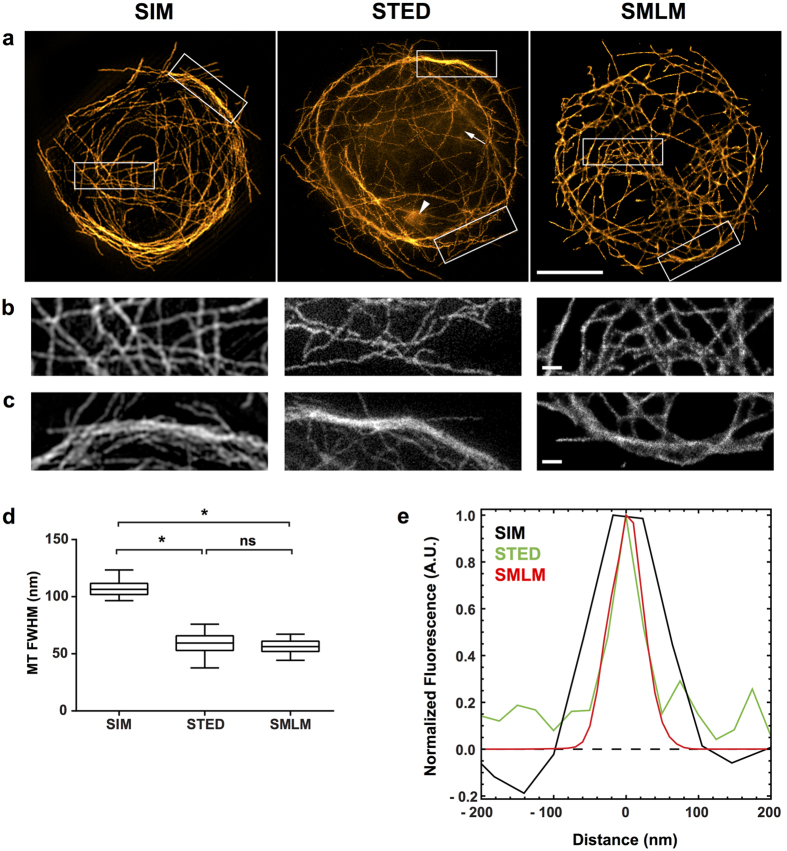
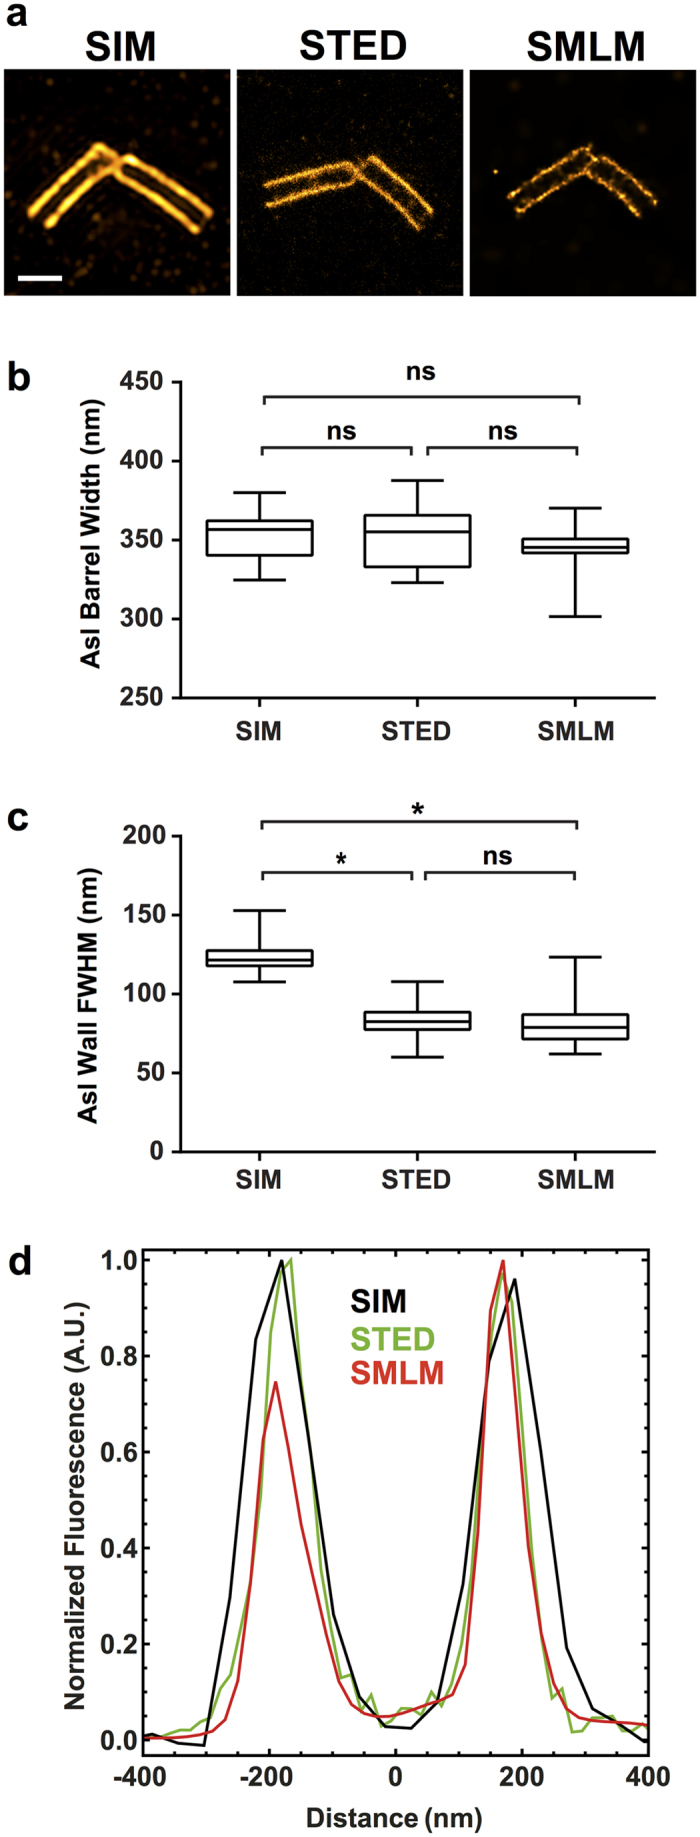
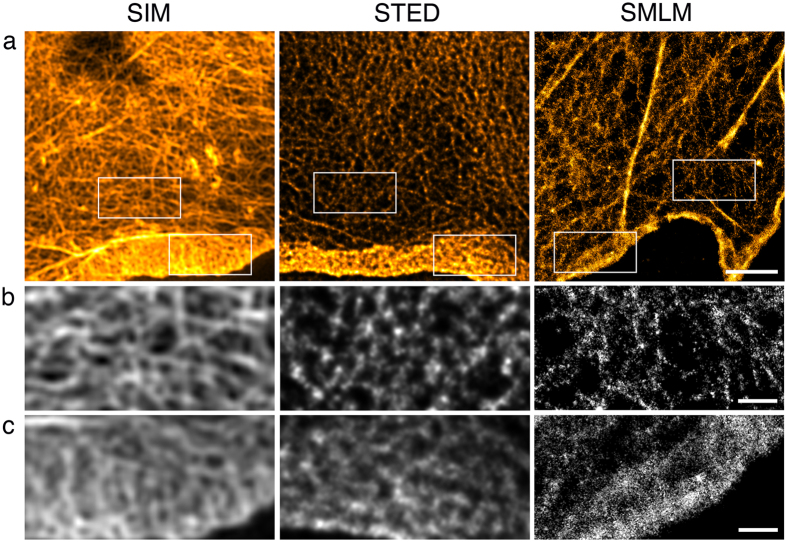
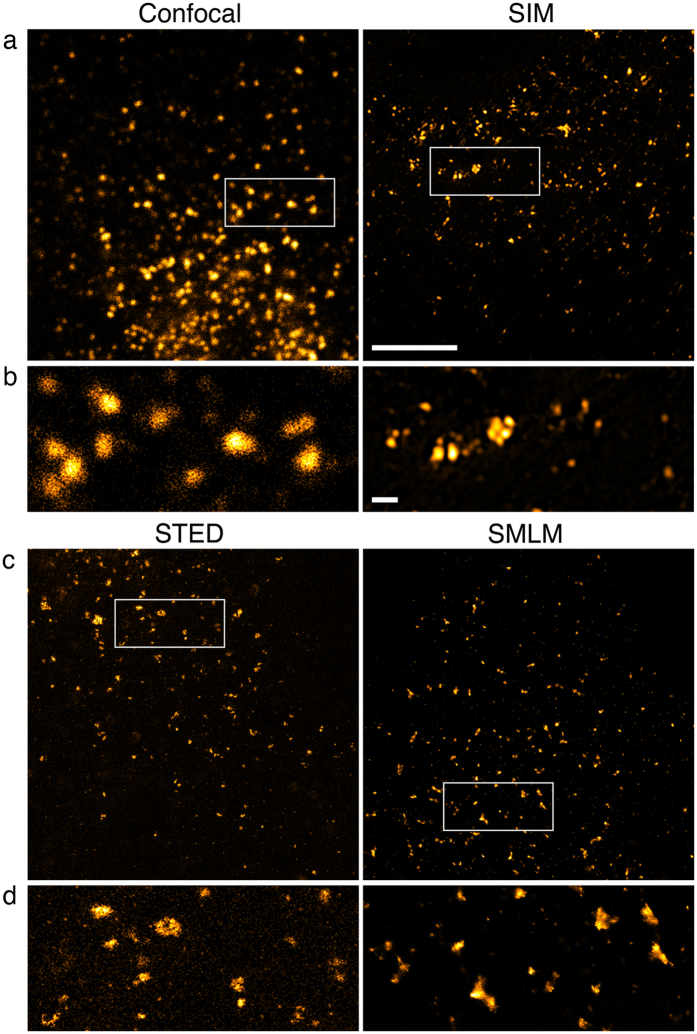
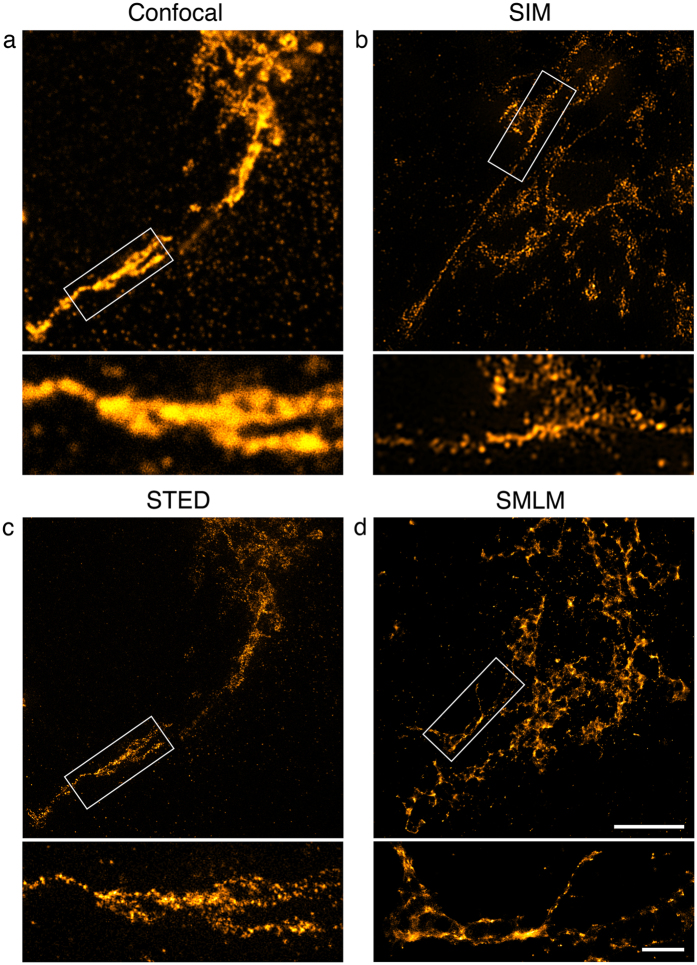
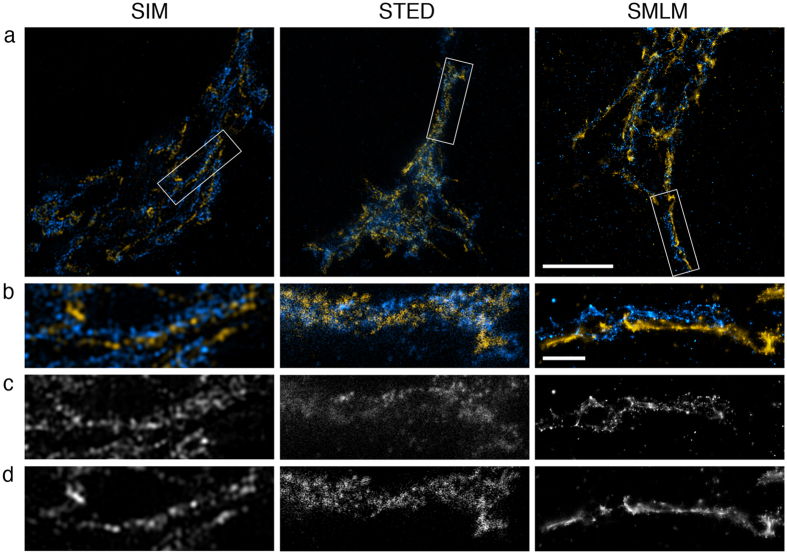
Many biological questions require fluorescence microscopy with a resolution beyond the diffraction limit of light. Super-resolution methods such as Structured Illumination Microscopy (SIM), STimulated Emission Depletion (STED) microscopy and Single Molecule Localisation Microscopy (SMLM) enable an increase in image resolution beyond the classical diffraction-limit. Here, we compare the individual strengths and weaknesses of each technique by imaging a variety of different subcellular structures in fixed cells. We chose examples ranging from well separated vesicles to densely packed three dimensional filaments. We used quantitative and correlative analyses to assess the performance of SIM, STED and SMLM with the aim of establishing a rough guideline regarding the suitability for typical applications and to highlight pitfalls associated with the different techniques.
Figures
Similar articles
-
[Comparison and progress review of various super-resolution fluorescence imaging techniques].Se Pu. 2021 Oct;39(10):1055-1064. doi: 10.3724/SP.J.1123.2021.06015. Se Pu. 2021. PMID: 34505427 Free PMC article. Review. Chinese.
-
From single molecules to life: microscopy at the nanoscale.Anal Bioanal Chem. 2016 Oct;408(25):6885-911. doi: 10.1007/s00216-016-9781-8. Epub 2016 Sep 9. Anal Bioanal Chem. 2016. PMID: 27613013 Free PMC article. Review.
-
Correlative super-resolution microscopy with deep UV reactivation.J Microsc. 2024 Nov;296(2):133-138. doi: 10.1111/jmi.13258. Epub 2024 Jan 3. J Microsc. 2024. PMID: 38145966
-
Fast widefield scan provides tunable and uniform illumination optimizing super-resolution microscopy on large fields.Nat Commun. 2021 May 24;12(1):3077. doi: 10.1038/s41467-021-23405-4. Nat Commun. 2021. PMID: 34031402 Free PMC article.
-
Expansion STED microscopy (ExSTED).Methods Cell Biol. 2021;161:15-31. doi: 10.1016/bs.mcb.2020.06.001. Epub 2020 Jun 29. Methods Cell Biol. 2021. PMID: 33478688
Cited by
-
Murine polyomavirus DNA transitions through spatially distinct nuclear replication subdomains during infection.PLoS Pathog. 2020 Mar 23;16(3):e1008403. doi: 10.1371/journal.ppat.1008403. eCollection 2020 Mar. PLoS Pathog. 2020. PMID: 32203554 Free PMC article.
-
CryoSIM: super-resolution 3D structured illumination cryogenic fluorescence microscopy for correlated ultrastructural imaging.Optica. 2020 Jul 13;7(7):802-812. doi: 10.1364/OPTICA.393203. eCollection 2020 Jul 20. Optica. 2020. PMID: 34277893 Free PMC article.
-
Challenges facing quantitative large-scale optical super-resolution, and some simple solutions.iScience. 2021 Feb 3;24(3):102134. doi: 10.1016/j.isci.2021.102134. eCollection 2021 Mar 19. iScience. 2021. PMID: 33665555 Free PMC article. Review.
-
Sample preparation and data collection for serial block face scanning electron microscopy of mammalian cell monolayers.PLoS One. 2024 Aug 9;19(8):e0301284. doi: 10.1371/journal.pone.0301284. eCollection 2024. PLoS One. 2024. PMID: 39121154 Free PMC article.
-
Improving axial resolution in Structured Illumination Microscopy using deep learning.Philos Trans A Math Phys Eng Sci. 2021 Jun 14;379(2199):20200298. doi: 10.1098/rsta.2020.0298. Epub 2021 Apr 26. Philos Trans A Math Phys Eng Sci. 2021. PMID: 33896203 Free PMC article.
References
-
- Thorley J. A., Pike J. & Rappoport J. Z. In Fluorescence Microscopy: Super-Resolution and other Novel Techniques (eds Cornea A. & Conn P. M.) Ch. 14, 199–212 (Elsevier, 2014).
-
- Heintzmann R. & Cremer C. G. Laterally modulated excitation microscopy: improvement of resolution by using a diffraction grating. Proc. SPIE 3568, 185–195 (1999).
-
- Gustafsson M. G. Surpassing the lateral resolution limit by a factor of two using structured illumination microscopy. J Microsc 198, 82–87 (2000). - PubMed
Publication types
MeSH terms
Grants and funding
LinkOut - more resources
Full Text Sources
Other Literature Sources
