. 2016 Jun 24;352(6293):1581-6.
doi: 10.1126/science.aaf3892. Epub 2016 Jun 2.

Tissue adaptation of regulatory and intraepithelial CD4⁺ T cells controls gut inflammation

Affiliations

Tissue adaptation of regulatory and intraepithelial CD4⁺ T cells controls gut inflammation

Tomohisa Sujino et al. Science. .

Abstract

Foxp3(+) regulatory T cells in peripheral tissues (pT(regs)) are instrumental in limiting inflammatory responses to nonself antigens. Within the intestine, pT(regs) are located primarily in the lamina propria, whereas intraepithelial CD4(+) T cells (CD4(IELs)), which also exhibit anti-inflammatory properties and depend on similar environmental cues, reside in the epithelium. Using intravital microscopy, we show distinct cell dynamics of intestinal T(regs) and CD4(IELs) Upon migration to the epithelium, T(regs) lose Foxp3 and convert to CD4(IELs) in a microbiota-dependent manner, an effect attributed to the loss of the transcription factor ThPOK. Finally, we demonstrate that pT(regs) and CD4(IELs) perform complementary roles in the regulation of intestinal inflammation. These results reveal intratissue specialization of anti-inflammatory T cells shaped by discrete niches of the intestine.


Figures

Fig. 1
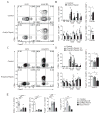
Fig. 1. ThPOK levels correlate with reciprocal Treg and CD4IEL localization and migration dynamics in the intestine
(A to F) Intravital microscopy (IVM) analysis of ileal villi. Mice were injected with Hoechst prior to imaging to visualize all nuclei (blue). Scale bar=10μm. (A) Time-stacked image of TCRγδGFP (left, green channel) mice and iFoxp3Tomato (right, red channel) mice, 24 hours after tamoxifen administration. Images are representative of 20–22 villi from at least 3 independent experiments. (B, C) Frequency of intraepithelial (IE), lamina propria (LP) or migratory TCRγδGFP and iFoxp3Tomato cells. (C) Percentages within migrating cells. (D to F) Sorted naïve CD4+ T cells from OT-II (RFP ThpokGFP) mice were transferred to Rag1−/− mice and recipient mice were fed an OVA-containing diet for 7 days before IVM analysis. (D) Time-stacked image of GFP+ (left, green channel and blue channel overlay) and GFP+ (yellow) and GFP (red) cells (right, green, red and blue channel overlay). Time-stacked images are representative of at least 50 villi from 4 independent experiments. (E) Quantification of tracked GFP+ and GFP cell dynamics from 4 different movies (total 6-paired villi) in 2 independent experiments. (F) Percentages within migrating cells. Cells were tracked using Imaris software (Bitplane UK). Data are expressed as mean ± SD from independent movies. ns: not significant, *P<0.05, **P<0.01, ***P<0.001 (Student’s t test).
Fig. 2
Fig. 2. Microbiota-dependent plasticity of Tregs in the intestinal epithelium
(A, B) Flow cytometry analysis of lymphocytes from spleen (spl), mesenteric lymph nodes (mLN) and small intestine epithelium (IEL) of wild-type C57BL/6 mice maintained under specific pathogen-free (SPF) or germ-free (GF) conditions. (A) Surface neuropilin-1 (Nrp-1) and intracellular Foxp3 expression by TCRβ+CD4+CD8β cells. Bar graphs represent frequency and total number of Foxp3+ (left) or Foxp3+Nrp-1 (pTregs) (right) among TCRβ+CD4+CD8β cells. Total cell number for T cell populations isolated from the sIELs is also shown. (B) Surface CD8α and intracellular ThPOK expression by TCRβ+CD4+CD8β cells. Bar graphs represent frequency and total number of CD8α+ (left) or ThPOKhigh (right) among TCRβ+CD4+CD8β cells. Data expressed as mean ± SD of individual mice (n=6), representative of 3 independent experiments. (C, D) Flow cytometry analysis of lymphocytes from spl, mLN and small intestine IEL of Foxp3CreER-eGFP:Rosa26lsl-tdTomato (iFoxp3Tomato) mice treated with tamoxifen and maintained with broad spectrum antibiotics for 5 weeks (ABX) or sucralose (CTRL). (C) Surface CD8α and Tomato expression or intracellular Foxp3 among TCRβ+CD4+ cells. (D) Frequency of Foxp3+ (black) and Tomato+ (white) among TCRβ+ CD4+ cells in each tissue. Data expressed as mean ± SD of individual mice (n=3), representative of 3 independent experiments. *P<0.05, **P<0.01, ***P<0.001 (Student’s t test).
Fig. 3
Fig. 3. ThPOK expression by intestinal epithelial CD4+ T cells plays a key role in the reciprocal development of Tregs and CD4IELs
(A–D) Flow cytometry analysis of lymphocytes from spleen (spl), mesenteric lymph nodes (mLN), small and large intestine epithelium (IEL) and lamina propria (LPL) of inducible conditional Thpok-deficient mice. (A, B) Cd4CreER:Thpokfl/fl (iCd4Thpok)) and (Cre) Thpokf/f littermate control mice 7 days post-tamoxifen administration. (A) Representative contour plot for surface CD8α and intracellular Foxp3 among TCRβ+CD4+CD8β cells. (B) Frequency of CD8α+ (upper) and Foxp3+ (lower) among TCRβ+CD4+CD8β or among total CD45+ cells in the indicated tissues. Data expressed as means ± SD of individual mice (n=3–6), representative of 6 independent experiments. (C, D) Foxp3CreER:Thpokfl/fl (iFoxp3Thpok)) and (Cre+)Thpok+/+ littermate control mice 7 days (shown in D) or 35 days post-tamoxifen administration. (C) Representative contour plot for surface CD8α and intracellular Foxp3 among TCRβ+CD4+CD8β cells. (D) Frequency of CD8α+ (upper) and Foxp3+ (lower) among TCRβ+CD4+CD8β or among total CD45+ cells in the indicated tissues. Data expressed as means ± SD of individual mice (n=3–8), representative of 3 independent experiments. (E) Frequency and total number of CD8α+ and Foxp3+ among TCRβ+CD4+CD8β cells from sIEL of Ox40Tbx21), Cd4Runx3), E8ITbx21), and wild-type (WT) mice. Data expressed as mean ± SD of individual mice (n=3–9), representative of 3 independent experiments. *P<0.05, **P<0.01, ***P<0.001 (Student’s t test (B), one-way ANOVA with Tukey post-test (D, E)).
Fig. 4
Fig. 4. Complementary roles for pTregs and CD4IELs in regulating local inflammatory response towards dietary antigens
OVA-specific TCR transgenic mice (Rag1−/− background) were fed an OVA-containing diet for 7 days. (A–C) ThpokGFP OT-II(ΔRunx3) and control ThpokGFP OT-II mice were analyzed. (A) Hematoxylin and eosin staining of the small intestine jejunum (SI) (upper panels) and the large intestine colon (LI) (lower panels). Original magnification, 40x. Graphs represent histological scores of the SI (upper) and the LI (lower) (each symbol represents one mouse). (B, C) Sorted naïve OVA-specific TCR transgenic cells (TCRVα2+CD4+CD62L+CD44low) from wild-type OT-II or tamoxifen-treated iOT-II(ΔThpok) were transferred to host OT-II(ΔRunx3) prior to treatment as in (A). (B) Frequency of diarrhea-free mice after oral OVA challenge. (C) Quantification of fecal Lipocalin-2. (D–F) TBmc Foxp3sf (scurfy) and TBmc control treated as in (A), and injected with isotype control or anti-CD8α depleting antibody. (D) Hematoxylin and eosin staining of the SI (upper) and the LI (lower). Original magnification, 40x. Graphs represent histological scores of the SI (upper) and the LI (lower) (each symbol represents one mouse). (E) Frequency of diarrhea-free mice after oral OVA challenge. (F) Quantification of fecal Lipocalin-2. Data expressed as mean +SD or median ± interquartile range (A, D), representative of at least two independent experiments (n=3 to 8 per group). Scale bar, 200 μm. *P<0.05, **P<0.01, ***P<0.001 (Student’s t test or Mann-Whitney test (A), one-way ANOVA with Tukey post-test (C, F), Log-rank test (B, E) and Kruskal-Wallis with Dunns post-test (D)).

Comment in

  • IMMUNOLOGY. Converting to adapt.
    Colonna M, Cervantes-Barragan L. Colonna M, et al. Science. 2016 Jun 24;352(6293):1515-6. doi: 10.1126/science.aag1719. Science. 2016. PMID: 27339967 No abstract available.

Similar articles

Cited by

References

    1. Shale M, Schiering C, Powrie F. CD4(+) T-cell subsets in intestinal inflammation. Immunological reviews. 2013 Mar;252:164. - PMC - PubMed
    1. Bilate AM, Lafaille JJ. Induced CD4+Foxp3+ regulatory T cells in immune tolerance. Annu Rev Immunol. 2012;30:733. - PubMed
    1. Furusawa Y, et al. Commensal microbe-derived butyrate induces the differentiation of colonic regulatory T cells. Nature. 2013 Dec 19;504:446. - PubMed
    1. Mucida D, et al. Oral tolerance in the absence of naturally occurring Tregs. J Clin Invest. 2005 Jul 1;115:1923. - PMC - PubMed
    1. Smith PM, et al. The microbial metabolites, short-chain fatty acids, regulate colonic Treg cell homeostasis. Science. 2013 Aug 2;341:569. - PMC - PubMed

Publication types

Substances