. 2016 Jun 1:7:11753.
doi: 10.1038/ncomms11753.

Convulsive seizures from experimental focal cortical dysplasia occur independently of cell misplacement

Affiliations

Convulsive seizures from experimental focal cortical dysplasia occur independently of cell misplacement

Lawrence S Hsieh et al. Nat Commun. .

Abstract

Focal cortical dysplasia (FCD), a local malformation of cortical development, is the most common cause of pharmacoresistant epilepsy associated with life-long neurocognitive impairments. It remains unclear whether neuronal misplacement is required for seizure activity. Here we show that dyslamination and white matter heterotopia are not necessary for seizure generation in a murine model of type II FCDs. These experimental FCDs generated by increasing mTOR activity in layer 2/3 neurons of the medial prefrontal cortex are associated with tonic-clonic seizures and a normal survival rate. Preventing all FCD-related defects, including neuronal misplacement and dysmorphogenesis, with rapamycin treatments from birth eliminates seizures, but seizures recur after rapamycin withdrawal. In addition, bypassing neuronal misplacement and heterotopia using inducible vectors do not prevent seizure occurrence. Collectively, data obtained using our new experimental FCD-associated epilepsy suggest that life-long treatment to reduce neuronal dysmorphogenesis is required to suppress seizures in individuals with FCD.


Figures

Figure 1
Figure 1. Generation of experimental FCD-associated convulsive seizures.
(a) Simplified diagram of the constitutively active Rheb (RhebCA) upstream of mTORC1. (b) Diagram of the electrode placement around an E15±0.5 fetal brain (left). Photograph of a P0 mouse head with GFP fluorescence in the medial prefrontal cortex (mPFC) following electroporation at E15 (right). The ellipse highlights the location of the somatosensory cortex (SSC). (c) Confocal images of pS6 immunostaining (red) and GFP and tdTomato fluorescence (green) in coronal sections from 2-month-old mice containing neurons electroporated with either RhebCA+tdTomatoCAG or GFPCAG alone in the mPFC. Scale bar, 40 μm. (d) Bar graphs of total pS6 immunoreactivity per cell (FU: arbitrary fluorescence unit, N=4 per condition) from data shown in (c). **P<0.01 (Student's t-test). (eg) Images of coronal sections (top) containing neurons electroporated with control plasmid in the mPFC (e), with RhebCA in the mPFC (f) or in the SSC (g), and corresponding representative examples of EEG (black) and EMG (grey) traces (bottom). Scale bar, 1 mm. (h) Expanded time window (10 s) view of events found in the EEG trace shown in f, numbered correspondingly to the blue boxes. (i) Bar graphs show the number (#) of seizures/day and seizure duration in animals with seizures (N=8) from the mPFC RhebCA-expressing cohort. Control animals (N=9) electroporated with a control plasmid did not exhibit any seizures. *P<0.05 (Student's t-test). (j) Three-dimensional reconstruction of mouse brains containing neurons electroporated with either RhebCA+tdTomatoCAG or a control plasmid GFPCAG, both pseudocolored green to ease visualization. ACC, anterior cingulate cortex; CC, corpus callosum; MC, motor cortex. Error bars, s.e.m.
Figure 2
Figure 2. Experimental cortical malformations display typical features of type II FCDs.
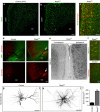
(a,b) NeuN immunostaining in coronal sections containing control (a) or RhebCA (b) expressing neurons. Electroporated neurons are not shown. Scale: 100 μm. (c) NeuN immunostaining (green) of tdTomato+ cells (red) in the RhebCA condition from the white rectangle shown in (b). Scale bar, 100 μm. (d) Myelin basic protein (MBP) immunostaining (green) of tdTomato+ cells (red) in the RhebCA condition illustrating myelin displacement and white matter heterotopia in the corpus callosum (CC). Scale bar, 100 μm. (e) SMI 311 immunostaining in a coronal section containing ipsilateral (RhebCA electroporated) and contralateral ACC. Electroporated neurons are not shown, but strong somatodendritic SMI 311 immunoreactivity is visible in ipsilateral neurons. Scale bar, 100 μm. (f) SMI 311 immunostaining (green) of tdTomato+ cells (red) in the RhebCA (from e) and control conditions. Scale bar, 50 μm. (g,h) Confocal images of control and RhebCA-expressing neurons in layer 2/3 of the ACC. Neurons were microinjected with neurobiotin and post-stained with Alexa Fluor 633 conjugated Streptavidin for visualization. Scale bar, 100 μm. (i) Bar graphs of soma size of control and RhebCA-expressing neurons in layer 2/3. **P<0.01 (Student's t-test). Error bars, s.e.m.
Figure 3
Figure 3. Gliosis but no change in GABAergic neuron density are visible in FCDs.
(a,b) GFAP immunostaining (green) in coronal sections containing electroporated neurons (red) under control (a) or RhebCA condition (b). The dotted line and white arrows point to a bulging of the ACC containing RhebCA-expressing cytomegalic neurons. Scale bar, 150 μm. (c) Bar graphs of fluorescence (Fu) intensity of GFAP immunoreactivity in both the ipsilateral (ipsi) and contralateral (contra) cortex under conditions shown in (a,b). P<0.01 (two-way analysis of variance (ANOVA)); *P<0.05, **P<0.01 (Sidak's multiple comparisons post-test). (d) T1-weighted MR images of control (d) and RhebCA (e) brains showing measuring bars for cortical thickness. (e) Quantification of cortical thickness shown in d,e with N=6 per condition. P<0.001 (two-way ANOVA); ***P<0.001 (Sidak's multiple comparisons post-test). (f) Serial tomograms from diffusion tensor imaging (DTI) with statistically significant (P<0.01) differences in fractional anisotropy (FA; RhebCA minus control, expressed in heat maps with scale at the bottom) between control (N=4) and RhebCA (N=4) transfected brains, overlaid on top of anatomical scans of a control brain. (g) Top, GABA immunostaining in coronal sections from mice electroporated with control or RhebCA plasmid. Scale bar, 300 μm. Bottom, bar graph of the density of GABAergic cells in control and RhebCA-expressing sections. Error bars, s.e.m.
Figure 4
Figure 4. FCDs and seizures are prevented by chronic postnatal rapamycin treatments but return following rapamycin withdrawal.
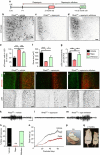
(a) Diagram illustrating the experimental protocol, including rapamycin treatment at 1 mg kg−1 every 48 h. (bd) B&W images of RhebCA-electroporated neurons expressing tdTomato in coronal sections from mice treated with either vehicle (b) or rapamycin (c), or following rapamycin withdrawal (d). Scale bar: 100 μm. (e) Bar graphs of the percentage of tdTomato+ RhebCA neurons in layer 2/3 in mice treated with vehicle (N=7) or rapamycin (N=6), or following rapamycin withdrawal (N=5). P<0.0007, one-way analysis of variance (ANOVA) followed by Tukey post hoc, *P<0.05; ***P<0.001, ****P<0.0001. (f,g) Bar graphs of tdTomato+ RhebCA neuron soma size (f) and pS6 immunoreactivity per cell (g) in mice treated with vehicle (N=7) or rapamycin (Rapa, N=6), or following rapamycin withdrawal (N=5). P<0.0001 and P<0.0026, respectively, one-way ANOVA followed by Tukey post hoc. (hj) Images of RhebCA-electroporated neurons expressing tdTomato and co-stained for pS6 (green and B&W for pS6 only) in coronal sections from mice treated with either vehicle (h) or rapamycin (i), or following rapamycin withdrawal (j). Scale bar, 100 μm. (km) Representative examples of EEG recordings in mice containing RhebCA-electroporated cells treated with either vehicle (k) or rapamycin (l), or following rapamycin withdrawal (m). Scale bars, 14 s, 500 μV. (n) Bar graphs of the percentage of RhebCA-electroporated mice displaying seizure activity that were treated with vehicle (black) or rapamycin (red), or following rapamycin withdrawal (green). (o) Plot of the body mass as a function of postnatal days of the animals treated with vehicle (N=7) or rapamycin (N=6). Mean (solid black line)±s.e.m. (colour shaded areas). P<0.0001 (two-way ANOVA with Sidak's multiple comparisons post-test). Significance starts at P13 of age. (p,q) Images of littermates at P5 (p) and 2 months (q) of age treated with vehicle or rapamycin. Error bars, s.e.m.
Figure 5
Figure 5. Dysmorphogenesis and cytomegaly of layer 2/3 mPFC neurons are sufficient to induce convulsive seizures.
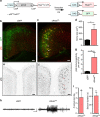
(a) Diagram illustrating the vectors and strategy used. (b,c,e,f) Images of cGFP+tdTomatoCAG or cRhebCA+GFPCAG-electroporated neurons co-stained for pS6 (red and B&W for pS6 only, (e,f)). Scale: 100 μm. Neurons were co-electroporated with an inducible Cre plasmid and injected with tamoxifen at P6. (d,g) Bar graphs of the soma size of cGFP+ (N=4) neurons and cRhebCA+ (N=3) neurons (d) and pS6 immunoreactivity per cell (g). *P<0.05 (Student's t-test). (h) Representative examples of EEG recordings from mice electroporated with plasmid encoding cGFP (left) and cRhebCA (right). Scale bar, 10 s, 210 μV. (i) Bar graphs show the number (#) of seizures/day and seizure duration in seizing cRhebCA animals (N=5). When compared to control (cGFP) littermates (N=6; *P<0.05; **P<0.01; Student's t-test). Error bars, s.e.m.

Similar articles

Cited by

References

    1. Schwartzkroin P. A., Roper S. N. & Wenzel H. J. in Recent Advances in Epilepsy Research (eds Binder D. K., Scharfman H. E. 145–170Springer (2004).
    1. Schwartzkroin P. A. & Walsh C. A. Cortical malformations and epilepsy. Ment. Retard. Dev. Disabil. Res. Rev. 6, 268–280 (2000). - PubMed
    1. Aronica E., Becker A. J. & Spreafico R. Malformations of cortical development. Brain Pathol. 22, 380–401 (2012). - PMC - PubMed
    1. Lee S. K. & Kim D. W. Focal cortical dysplasia and epilepsy surgery. J. Epilepsy Res. 3, 43–47 (2013). - PMC - PubMed
    1. Barkovich A. J., Kuzniecky R. I., Jackson G. D., Guerrini R. & Dobyns W. B. A developmental and genetic classification for malformations of cortical development. Neurology 65, 1873–1887 (2005). - PubMed

Publication types

MeSH terms