. 2016 May 18:10:124.
doi: 10.3389/fncel.2016.00124. eCollection 2016.

The Differential DRP1 Phosphorylation and Mitochondrial Dynamics in the Regional Specific Astroglial Death Induced by Status Epilepticus

Affiliations

The Differential DRP1 Phosphorylation and Mitochondrial Dynamics in the Regional Specific Astroglial Death Induced by Status Epilepticus

Ah-Reum Ko et al. Front Cell Neurosci. .

Abstract

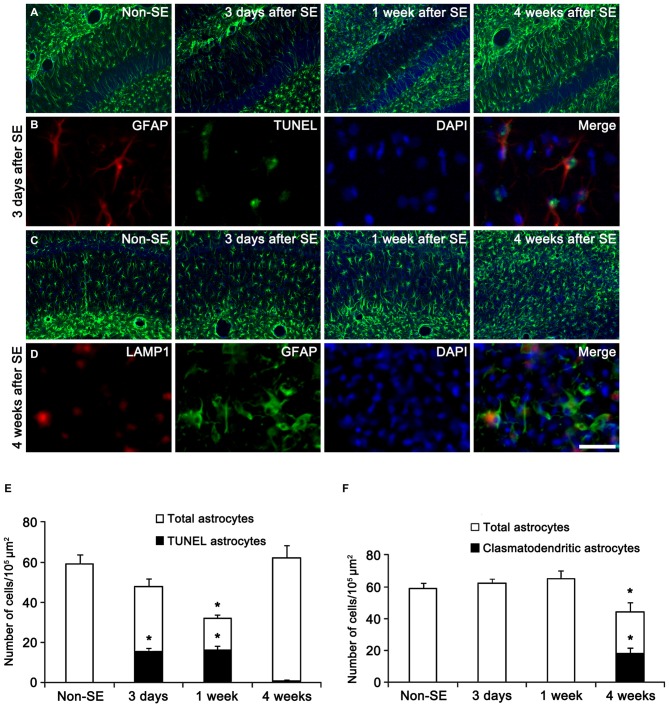
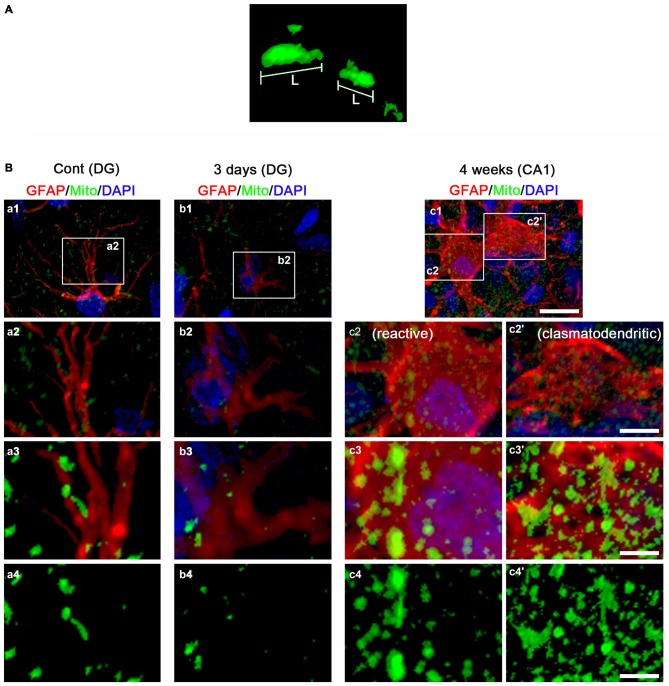
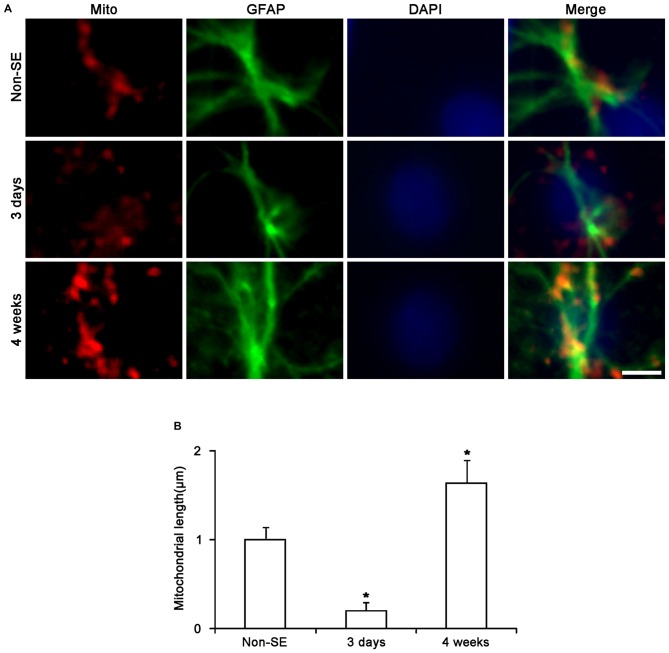
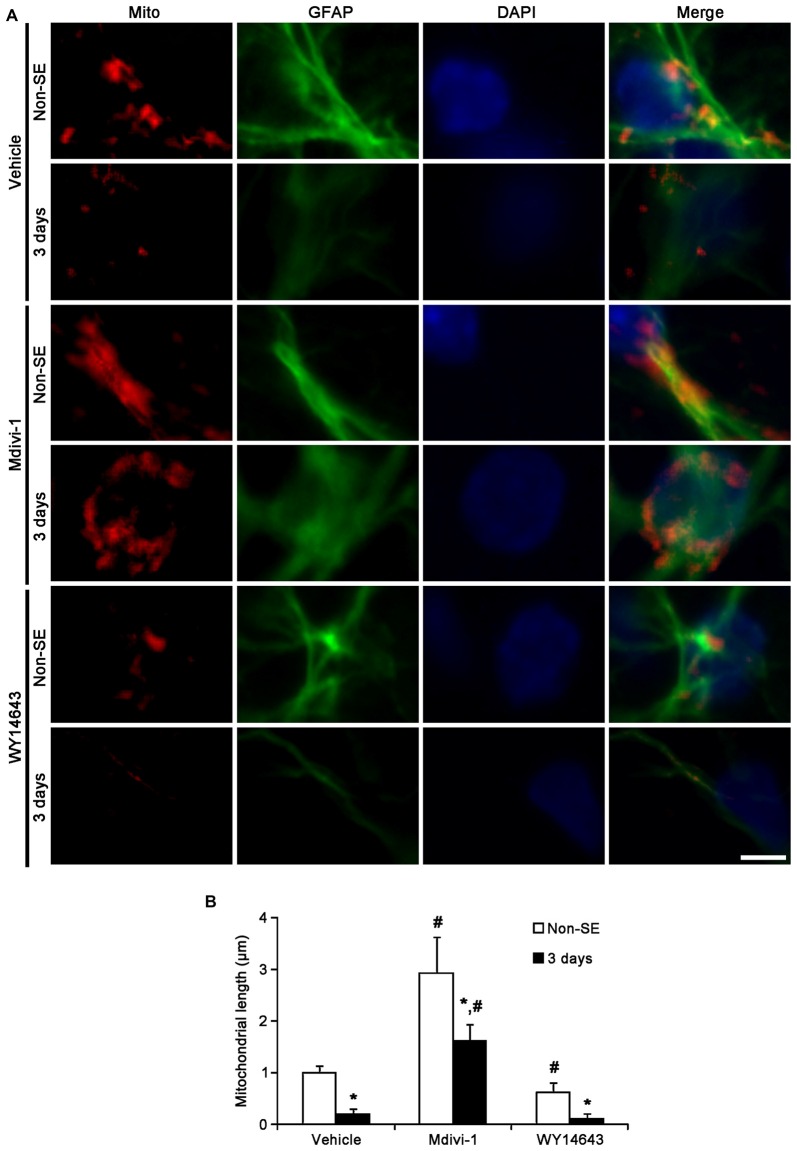
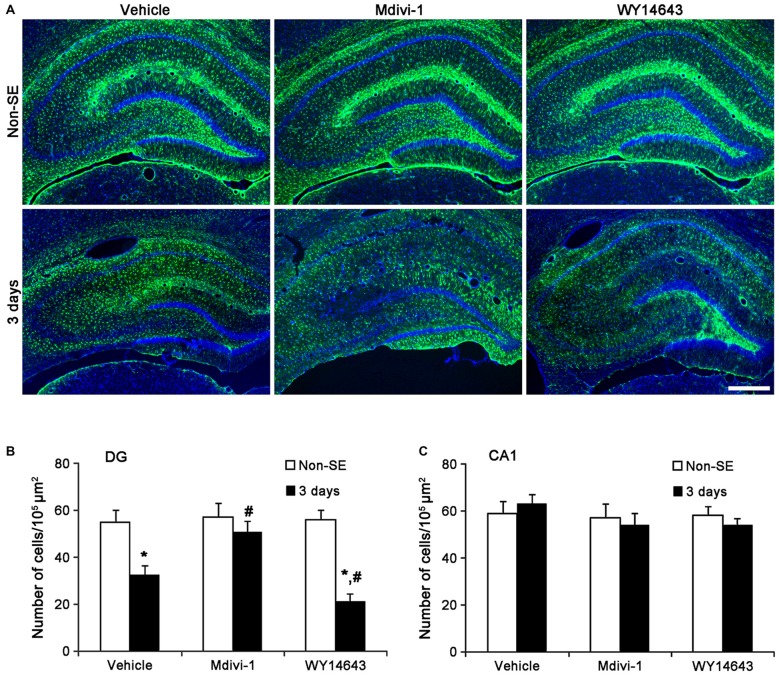
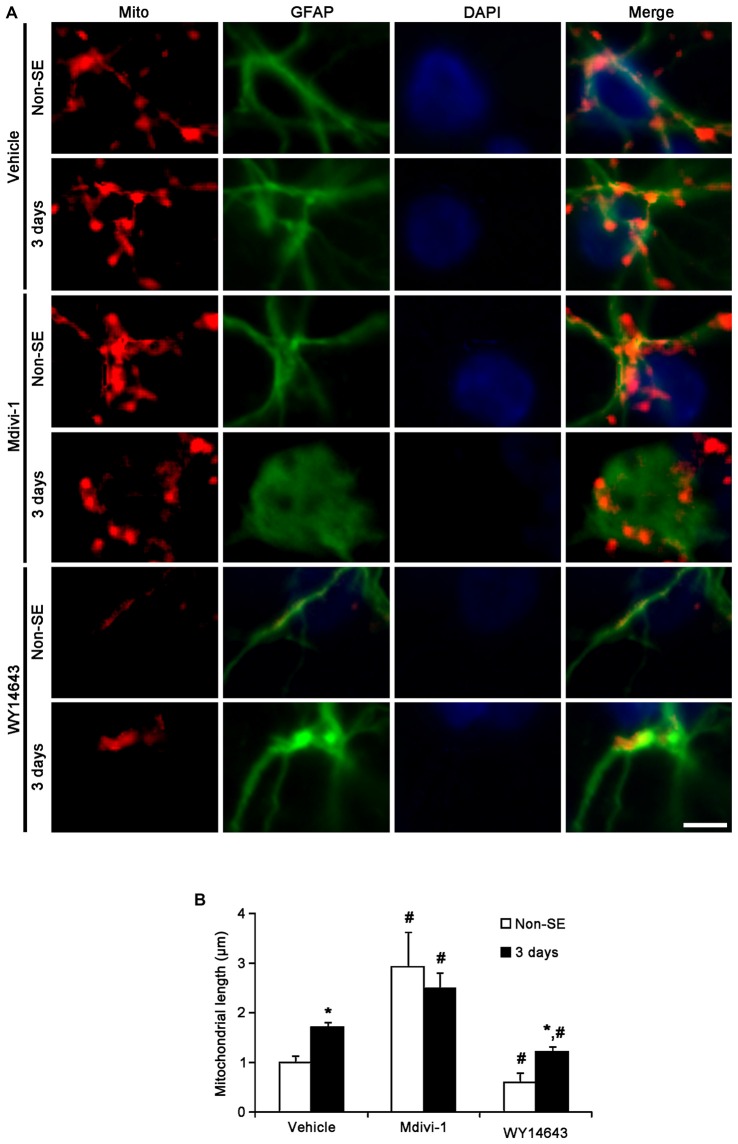
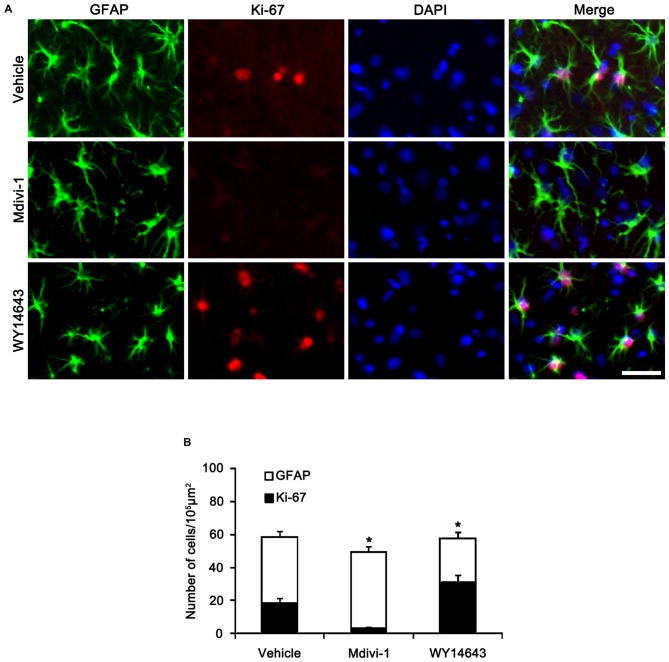
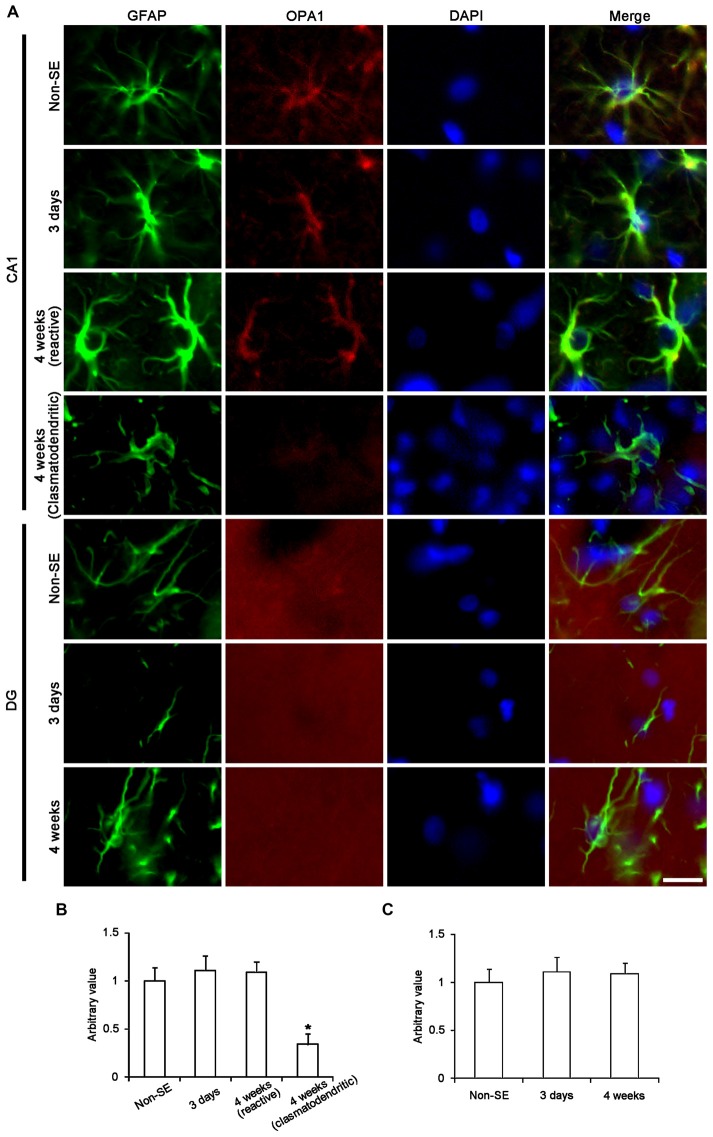
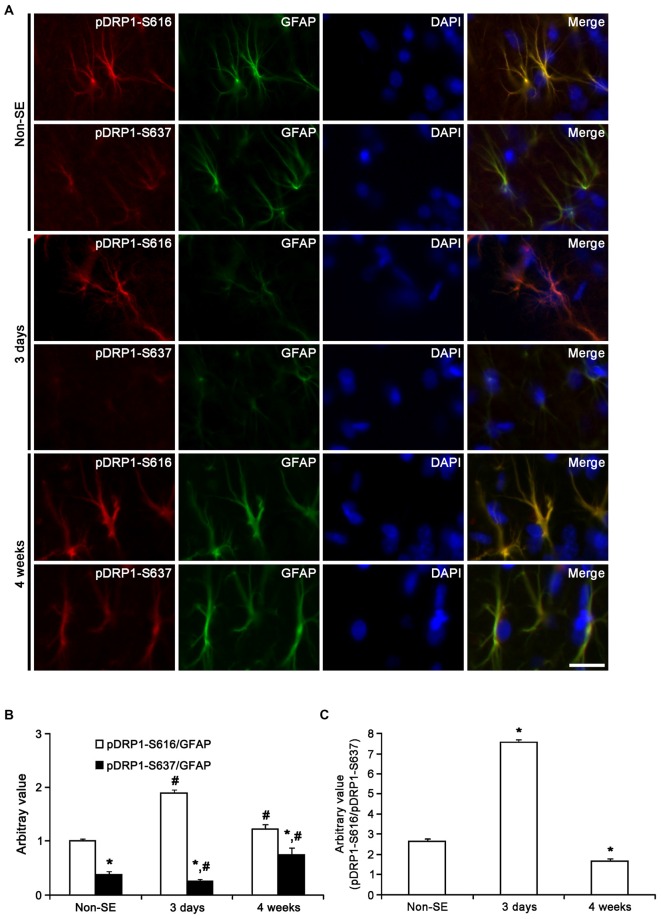
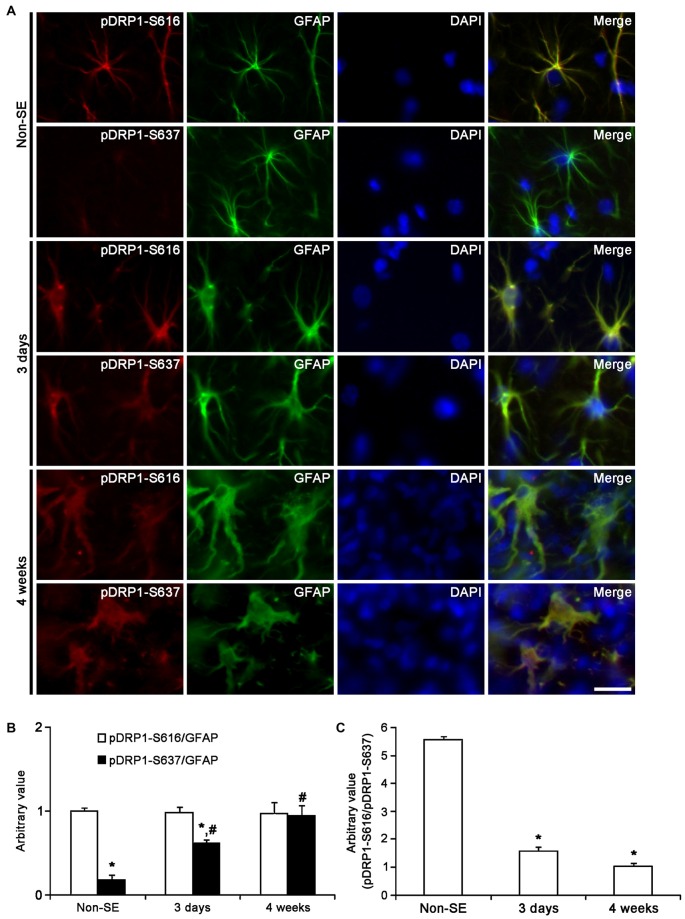
The response and susceptibility to astroglial degenerations are relevant to the distinctive properties of astrocytes in a hemodynamic-independent manner following status epilepticus (SE). Since impaired mitochondrial fission plays an important role in mitosis, apoptosis and programmed necrosis, we investigated whether the unique pattern of mitochondrial dynamics is involved in the characteristics of astroglial death induced by SE. In the present study, SE induced astroglial apoptosis in the molecular layer of the dentate gyrus, accompanied by decreased mitochondrial length. In contrast, clasmatodendritic (autophagic) astrocytes in the CA1 region showed mitochondrial elongation induced by SE. Mdivi-1 (an inhibitor of mitochondrial fission) effectively attenuated astroglial apoptosis, but WY14643 (an enhancer of mitochondrial fission) aggravated it. In addition, Mdivi-1 accelerated clasmatodendritic changes in astrocytes. These regional specific mitochondrial dynamics in astrocytes were closely correlated with dynamin-related protein 1 (DRP1; a mitochondrial fission protein) phosphorylation, not optic atrophy 1 (OPA1; a mitochondrial fusion protein) expression. To the best of our knowledge, the present data demonstrate for the first time the novel role of DRP1-mediated mitochondrial fission in astroglial loss. Thus, the present findings suggest that the differential astroglial mitochondrial dynamics may participate in the distinct characteristics of astroglial death induced by SE.

Keywords: DRP1; astroglial death; clasmatodendrosis; mitochondria; status epilepticus.


Figures

Figure 1
Figure 1
Regional specific astroglial death in the hippocampus following status epilepticus (SE). (A) Astroglial responses in the molecular layer of the dentate gyrus. Massive astroglial loss is observed in this region 3 days and 1 week after SE. (B) TUNEL-positive apoptosis in the molecular layer of the dentate gyrus 3 days after SE. (C) Astroglial responses in the CA1 region following SE. (D) LAMP1-positive clasmatodendrosis (round-shaped edematous cell body, short blunt processes, loss of distal processes, GFAP aggregation, nuclear dissolution and LAMP-1 positive vacuolization) in this region 4 weeks after SE. Bar = 100 (A,C) and 25 μm (B,D). (E) Quantification of the fraction of TUNEL-positive astrocytes in the total astrocytes within the molecular layer of the dentate gyrus following SE (mean ± SD, n = 7, respectively). *p < 0.05 vs. non-SE animals. (F) Quantification of the fraction of LAMP1-positive astrocytes in the total astrocytes within the CA1 region following SE (mean ± SD, n = 7, respectively). *p < 0.05 vs. non-SE animals.
Figure 2
Figure 2
3D-reconstruction of mitochondria in astrocytes within the hippocampus. (A) Representative image demonstrating the measurement of mitochondrial length. L, mitochondrial length (long axis). (B) Representative photos of 3D-reconstruction of mitochondria in astrocytes within the CA1 region and the dentate gyrus. Panels 1–3 are merge images for GFAP, mitochondrial marker and DAPI. Panel 4 demonstrates only image for mitochondrial marker. Panels c2,3 and c2’,3’ indicate reactive astrocytes and clasmatodendritic astrocytes, respectively. Panels 2,3 are high magnification images for rectangles in panels 1–3. Bar = 30 (panel 1), 7.5 (panel 2) and 3.75 (panels 3,4) μm.
Figure 3
Figure 3
Changes in mitochondrial morphology in astrocytes within the molecular layer of the dentate gyrus. (A) As compared to non-SE animals, mitochondrial length is reduced 3 days after SE. Four weeks after SE, mitochondria are elongated and the morphology of mitochondria is sphere shaped in reactive astrocytes. Bar = 3.75 μm. (B) Quantitative values (mean ± SEM) of mitochondrial length in the molecular layer of the dentate gyrus (n = 7, respectively). *p < 0.05 vs. non-SE animals.
Figure 4
Figure 4
Change in mitochondrial morphology in astrocytes within the CA1 region. (A) As compared to non-SE animals, mitochondrial length is increased 3 days after SE. Four weeks after SE, mitochondrial length is increased and the morphology of mitochondria is sphere shaped in reactive astrocytes as well as clasmatodendritic astrocytes. Bar = 3.75 μm. (B) Quantitative values (mean ± SEM) of mitochondrial length in the CA1 region (n = 7, respectively). *p < 0.05 vs. non-SE animals.
Figure 5
Figure 5
Effects of Mdivi-1 and WY14643 on the mitochondrial length in astrocytes within the molecular layer of the dentate gyrus 3 days after SE. (A) In non-SE animals, Mdivi-1 increases mitochondrial length, but WY14643 reduces it in astrocytes as compared to vehicle. Following SE, Mdivi-1 effectively attenuates reduction of mitochondrial length and induces hypertrophic and edematous changes in astrocytes without vacuolization. WY14643 does not affect reduction of mitochondrial length in astrocytes. Bar = 3.75 μm. (B) Quantitative values (mean ± SEM) of mitochondrial length in the molecular layer of the dentate gyrus (n = 7, respectively). *p < 0.05 vs. non-SE animals; #p < 0.05 vs. vehicle.
Figure 6
Figure 6
Effects of Mdivi-1 and WY14643 on the regional specific astroglial death in response to SE. (A) As compared to vehicle, Mdivi-1 effectively alleviates SE-induced astroglial death in the molecular layer of the dentate gyrus. In contrast, WY14643 aggravates SE-induced astroglial death in this region. Both Mdivi-1 and WY14643 did not affect the number of astrocytes in the CA1 region following SE. Bar = 6.25 μm.(B) Quantitative values (mean ± SEM) of the number of astrocytes in the molecular layer of the dentate gyrus (n = 7, respectively). *p < 0.05 vs. non-SE animals; #p < 0.05 vs. vehicle. (C) Quantitative values (mean ± SEM) of the number of astrocytes in the CA1 region (n = 7, respectively).
Figure 7
Figure 7
Effects of Mdivi-1 and WY14643 on the mitochondrial length in CA1 astrocytes 3 days after SE. (A) In non-SE animals, Mdivi-1 increases mitochondrial length, but WY14643 reduces it in astrocytes as compared to vehicle. Following SE, Mdivi-1 does not affect mitochondrial elongation, while WY14643 effectively inhibits it. CA1 astrocytes have round-shaped cell body, short blunt processes and vacuoles in the cytoplasm in Mdivi-1-treated animals, while CA1 astrocytes show typical reactive gliosis without vacuolization in vehicle- and WY14643-treated animals. Bar = 3.75 μm. (B) Quantitative values (mean ± SEM) of mitochondrial length in the molecular layer of the dentate gyrus (n = 7, respectively).*p < 0.05 vs. non-SE animals; #p < 0.05 vs. vehicle.
Figure 8
Figure 8
Effects of Mdivi-1 and WY14643 on Ki-67 induction in CA1 astrocytes 3 days after SE. (A) As compared to vehicle, Mdivi-1 infusion inhibits astroglial Ki-67 induction, while WY14643 infusion increases the number of Ki-67 positive astrocytes. Bar = 50 μm. (B) Quantitative values (mean ± SEM) of the fraction of Ki-67 positive astrocytes in total astrocytes (n = 7, respectively). *p < 0.05 vs. vehicle.
Figure 9
Figure 9
Astroglial optic atrophy 1 (OPA1) expression in the hippocampus following SE. (A) Double immunofluorescent images for GFAP and OPA1 following SE. In non-SE animals, OPA1 expression is clearly observed in CA1 astrocytes, while its expression is mainly detected in neuropils within the molecular layer of the dentate gyrus. As compared to non-SE animals, OPA1 expression is reduced in clasmatodendritic astrocytes, but not in reactive astrocytes. Bar = 6.25 μm. (B,C) Quantitative values (mean ± SEM) of OPA1 expression in the CA1 region (B) and the molecular layer of the dentate gyrus (C) (n = 7, respectively). *p < 0.05 vs. non-SE animals.
Figure 10
Figure 10
Astroglial DRP1 phosphorylation in the molecular layer of the dentate gyrus following SE. (A) Double immunofluorescent images for GFAP and pDRP1-S616/-S637 following SE. Three days after SE, pDRP1-S616 intensity is increased, while pDRP1-S637 intensity is reduced as compared to non-SE animals. Four weeks after SE, pDRP1-S616 intensity is unaltered, but pDRP1-S637 intensity is enhanced as compared to those observed in 3 days after SE. Bar = 12.5 μm. (B) Quantification of the ratio of pDRP1-S616/GFAP and pDRP1-S637/GFAP following SE (mean ± SEM, n = 7, respectively). *p < 0.05 vs. pDRP1-S616/GFAP ; #p < 0.05 vs. non-SE animals. (C) Quantification of the ratio of pDRP1-S616/pDRP1-S637 following SE (mean ± SEM, n = 7, respectively). *p < 0.05 vs. non-SE animals.
Figure 11
Figure 11
Astroglial DRP1 phosphorylation in the CA1 region following SE. (A) Double immunofluorescent images for GFAP and pDRP1-S616/-S637 following SE. Three days after SE, both pDRP1-S616 and pDRP1-S637 intensities are enhanced as compared to non-SE animals. Four weeks after SE, pDRP1-S616 intensity is unaltered, but pDRP1-S637 intensity is enhanced as compared to those observed in 3 days after SE. Bar = 12.5 μm. (B) Quantification of the ratio of pDRP1-S616/GFAP and pDRP1-S637/GFAP following SE (mean ± SEM, n = 7, respectively). *p < 0.05 vs. pDRP1-S616/GFAP; #p < 0.05 vs. non-SE animals. (C) Quantification of the ratio of pDRP1-S616/pDRP1-S637 following SE (mean ± SEM, n = 7, respectively). *p < 0.05 vs. non-SE animals.

Similar articles

Cited by

References

    1. Alaimo A., Gorojod R. M., Beauquis J., Muñoz M. J., Saravia F., Kotler M. L. (2014). Deregulation of mitochondria-shaping proteins Opa-1 and Drp-1 in manganese-induced apoptosis. PLoS One 9:e91848. 10.1371/journal.pone.0091848 - DOI - PMC - PubMed
    1. Anderson C. M., Swanson R. A. (2000). Astrocyte glutamate transport: review of properties, regulation and physiological functions. Glia 32, 1–14. 10.1002/1098-1136(200010)32:1<1::aid-glia10>3.3.co;2-n - DOI - PubMed
    1. Bach D., Pich S., Soriano F. X., Vega N., Baumgartner B., Oriola J., et al. . (2003). Mitofusin-2 determines mitochondrial network architecture and mitochondrial metabolism. A novel regulatory mechanism altered in obesity. J. Biol. Chem. 278, 17190–17197. 10.1074/jbc.m212754200 - DOI - PubMed
    1. Benard G., Rossignol R. (2008). Ultrastructure of the mitochondrion and its bearing on function and bioenergetics. Antioxid. Redox Signal. 10, 1313–1342. 10.1089/ars.2007.2000 - DOI - PubMed
    1. Birsa N., Norkett R., Higgs N., Lopez-Domenech G., Kittler J. T. (2013). Mitochondrial trafficking in neurons and the role of the miro family of GTPase proteins. Biochem. Soc. Trans. 41, 1525–1531. 10.1042/BST20130234 - DOI - PubMed

LinkOut - more resources