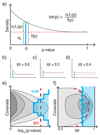
Data-driven hypothesis weighting increases detection power in genome-scale multiple testing
- PMID: 27240256
- PMCID: PMC4930141
- DOI: 10.1038/nmeth.3885
Data-driven hypothesis weighting increases detection power in genome-scale multiple testing
Abstract
Hypothesis weighting improves the power of large-scale multiple testing. We describe independent hypothesis weighting (IHW), a method that assigns weights using covariates independent of the P-values under the null hypothesis but informative of each test's power or prior probability of the null hypothesis (http://www.bioconductor.org/packages/IHW). IHW increases power while controlling the false discovery rate and is a practical approach to discovering associations in genomics, high-throughput biology and other large data sets.
Figures


Similar articles
-
Weighted multiple hypothesis testing procedures.Stat Appl Genet Mol Biol. 2009;8(1):Article23. doi: 10.2202/1544-6115.1437. Epub 2009 Apr 16. Stat Appl Genet Mol Biol. 2009. PMID: 19409067 Free PMC article.
-
Improving power of genome-wide association studies with weighted false discovery rate control and prioritized subset analysis.PLoS One. 2012;7(4):e33716. doi: 10.1371/journal.pone.0033716. Epub 2012 Apr 9. PLoS One. 2012. PMID: 22496761 Free PMC article.
-
twilight; a Bioconductor package for estimating the local false discovery rate.Bioinformatics. 2005 Jun 15;21(12):2921-2. doi: 10.1093/bioinformatics/bti436. Epub 2005 Apr 7. Bioinformatics. 2005. PMID: 15817688
-
Orchestrating high-throughput genomic analysis with Bioconductor.Nat Methods. 2015 Feb;12(2):115-21. doi: 10.1038/nmeth.3252. Nat Methods. 2015. PMID: 25633503 Free PMC article. Review.
-
Using R and Bioconductor in Clinical Genomics and Transcriptomics.J Mol Diagn. 2020 Jan;22(1):3-20. doi: 10.1016/j.jmoldx.2019.08.006. Epub 2019 Oct 9. J Mol Diagn. 2020. PMID: 31605800 Review.
Cited by
-
Radiotherapy in combination with CD47 blockade elicits a macrophage-mediated abscopal effect.Nat Cancer. 2022 Nov;3(11):1351-1366. doi: 10.1038/s43018-022-00456-0. Epub 2022 Nov 21. Nat Cancer. 2022. PMID: 36411318 Free PMC article.
-
Small noncoding RNA interactome capture reveals pervasive, carbon source-dependent tRNA engagement of yeast glycolytic enzymes.RNA. 2023 Mar;29(3):330-345. doi: 10.1261/rna.079408.122. Epub 2022 Dec 27. RNA. 2023. PMID: 36574981 Free PMC article.
-
A prognostic risk model for glioma patients by systematic evaluation of genomic variations.iScience. 2022 Nov 28;25(12):105681. doi: 10.1016/j.isci.2022.105681. eCollection 2022 Dec 22. iScience. 2022. PMID: 36536675 Free PMC article.
-
Integrated proteomics reveals alterations in sarcomere composition and developmental processes during postnatal swine heart development.J Mol Cell Cardiol. 2023 Mar;176:33-40. doi: 10.1016/j.yjmcc.2023.01.004. Epub 2023 Jan 16. J Mol Cell Cardiol. 2023. PMID: 36657638 Free PMC article.
-
Endometrial Epithelial ARID1A Is Required for Uterine Immune Homeostasis during Early Pregnancy.Int J Mol Sci. 2022 May 28;23(11):6067. doi: 10.3390/ijms23116067. Int J Mol Sci. 2022. PMID: 35682747 Free PMC article.
References
-
- Benjamini Y, Hochberg Y. Controlling the false discovery rate: a practical and powerful approach to multiple testing. Journal of the Royal Statistical Society. Series B (Statistical Methodology) 1995:289–300.
-
- Benjamini Y, Krieger AM, Yekutieli D. Adaptive linear step-up procedures that control the false discovery rate. Biometrika. 2006;93:491–507.
-
- Storey JD, Taylor JE, Siegmund D. Strong control, conservative point estimation and simultaneous conservative consistency of false discovery rates: a unified approach. Journal of the Royal Statistical Society: Series B (Statistical Methodology) 2004;66:187–205.
-
- Efron B. Large-scale inference: Empirical Bayes methods for estimation, testing, and prediction. Cambridge University Press; 2010.
Publication types
MeSH terms
LinkOut - more resources
Full Text Sources
Other Literature Sources
Molecular Biology Databases

